Mask Mandates and Retail Consumer Spending: A Comparison of Oklahoma Communities During COVID-19
The COVID-19 pandemic has impacted nearly all aspects of everyday life in the U.S., including how we shop for goods and services (Sheth, 2020). Panic buying took place in the early months as full or partial lockdowns were enacted, with increased purchases of health/personal care goods and food (J.P. Morgan, 2020). Later, online purchasing increased and some consumers showed a hesitancy to return to in-person shopping (McKinsey, 2021). These trends have important implications for Oklahoma communities, which depend heavily on retail sales taxes as a source of revenue.
As the pandemic unfolded, communities across Oklahoma responded in different ways. Governor Kevin Stitt closed non-essential businesses on March 24, 2020; this included many (but not all) retail stores. The state’s re-opening plan was initiated on April 24, 2020, with dining facilities allowed to partially re-open but bars remaining closed. The 2nd phase began on May 15, 2020 (with standing-room occupancy for bars) and the final 3rd phase started on June 1, 2020 (OK Commerce, 2020). Oklahoma was one of several states that did not enact a state-wide mask mandate at any point during the pandemic. However, some communities passed such mandates on their own, and some city mayors were more restrictive in when they allowed business to re-open.
In light of these circumstances, an unanswered question is whether mask mandates impacted local retail spending once businesses were allowed to reopen. An initial hypothesis is that shoppers in cities where mask mandates were implemented may have felt safer and were more willing to shop broadly at local stores in-person. To explore this hypothesis, tax collection data reported to the Oklahoma Tax Commission for 12 Oklahoma cities during the period July 2019 to March 2021 was gathered. Six of these cities enacted mask mandates, while the other six did not. Cities with mask mandates were identified by popular press articles and city government websites, which also identified the date of enactment (Douglas, 2020). Mirror cities to those with mask mandates were chosen by considering demographic characteristics such as population, median age, income, racial composition and poverty rates; however, exact matches were not possible. Table 1 below shows the 12 chosen cities, some basic demographic characteristics and the city-level tax rate.
Table 1. Demographic characteristics of communities analyzed.
City |
Mask Mandate |
Population |
% over 65 |
% Hispanic or Latino |
% Native American |
% Black |
% Poverty |
Median Household Income ($) |
City Tax Rate |
|---|---|---|---|---|---|---|---|---|---|
| Lawton | Y | 94,017 | 11.1 | 14.6 | 4.6 | 18.5 | 20.4 | 47,779 | 4.13% |
| Broken Arrow | N | 108,496 | 14.6 | 8.5 | 10.8 | 6.1 | 7.8 | 74,290 | 3.55% |
| Midwest City | Y | 57,288 | 15.3 | 5.9 | 7.2 | 26.8 | 14.8 | 49,914 | 4.60% |
| Bartlesville | N | 36,412 | 18.9 | 7 | 12.6 | 5 | 3.5 | 54,778 | 3.40% |
| Sapulpa | Y | 21,041 | 18.2 | 5.7 | 12 | 3.2 | 16 | 51,655 | 4.00% |
| Miami | N | 13,289 | 15.4 | 5.8 | 25.9 | 3.3 | 23.6 | 36,908 | 3.65% |
| Tahlequah | Y | 16,819 | 14.1 | 8.4 | 28.3 | 2.4 | 24.8 | 37,177 | 3.25% |
| Chickasha | N | 16,337 | 16.8 | 7.9 | 8.2 | 8.4 | 20.1 | 42,175 | 3.75% |
| Altus | Y | 18,338 | 13 | 26.9 | 1.6 | 8.8 | 18.3 | 47,691 | 3.75% |
| Guymon | N | 10,996 | 7.6 | 58.1 | 0.1 | 3.6 | 24.6 | 53,164 | 4.00% |
| The Village | Y | 9,452 | 18.2 | 7.7 | 5.8 | 8.8 | 10 | 58,947 | 4.50% |
| Collinsville | N | 6,882 | 13.5 | 1.5 | 18.3 | 2.8 | 13.1 | 65,299 | 4.30% |
Source: 2015-2019 American Community Survey; Oklahoma Tax Commission
The Oklahoma Tax Commission reports monthly sales taxes collected across all North American Industrial Classification System (NAICS) for each city in the state. NAICS codes 44 and 45 represent the retail trade sector and include sales ranging from furniture stores to restaurants; appliances to gasoline stations; and health care to general merchandising. Because each city can charge a different amount in local sales tax rate, the taxes collected by the OTC were divided by that rate to derive the total retail dollars spent in a city during that month. Finally, this total was divided by the city population to arrive at a “retail expenditures per capita” measure that is comparable across communities of different size. It is worth noting this data includes not only dollars spent at physical stores, but also online sales from stores with a presence in the state. Online retail sales did increase dramatically in the second quarter of 2020 (U.S. Census Bureau, 2021). However, even at its peak, e-commerce sales only comprised 16% of total retail sales, meaning most purchases continued to take place in brick-and-mortar locations. The cities with mask mandates had them in place until April 2021.
Figure 1 displays the average retail expenditures per capita across the two groups (six mask mandate cities vs. six non-mask mandate cities) along with the Oklahoma state average, during the period July 2019 to March 2021. Several patterns are clear:
- Cities with mask mandates had higher expenditures per capita both before and after the pandemic.
- Retail expenditures did trend up in the immediate aftermath of the pandemic, consistent with other evidence (J.P. Morgan, 2020).
- The towns included are above the state average in terms of retail sales expenditures per capita. This is expected since most of these cities are the largest in their counties and the state average represents per capita sales across communities of all sizes, including more than 400 with populations less than 2,500 (and thus smaller retail sectors).
Figure 1. Retail Sales Expenditures Per Capita in Mask Mandate vs. Non-Mask Mandate Communities in Oklahoma. Source: Oklahoma Tax Commission.
To examine whether the mask mandates had an impact on retail expenditures, sales after the mandates went into effect were considered relative to sales in the same community one year prior. This way, each community’s post-pandemic sales are compared with their experience prior to the pandemic. Figure 2 demonstrates the relative increase in mask mandate vs. non-mask mandate communities, with the analysis beginning in July 2020 (since most mandates began at that time).
The results in Figure 2 show that generally, retail expenditures have been higher in the COVID-19 era: for the state as a whole, expenditures per capita ranged between 3% and 19% higher when compared to the same month one year earlier. This pattern ends in March 2021, which is consistent with the large increase in retail expenditures at the beginning of the pandemic (March 2020) observed in Figure 1. Retail sales performance in mask mandate communities has slightly outpaced that in non-mask mandate cities. During the period July 2020 to Mar 2021, the six cities with mask mandates averaged an 11.6% increase in retail expenditures per capita from a year prior; this compares to 9.3% growth in the six comparison communities without mask mandates and 7.4% growth for the state as a whole. In each month of the analysis, the mask-mandate cities demonstrated stronger growth compared to baseline than did cities without mask mandates.
Figure 2. Percentage Change from 1 year Prior: Retail Sales Expenditures Per Capita in Mask Mandate vs. Non-Mask Mandate Communities. Source: Oklahoma Tax Commission.
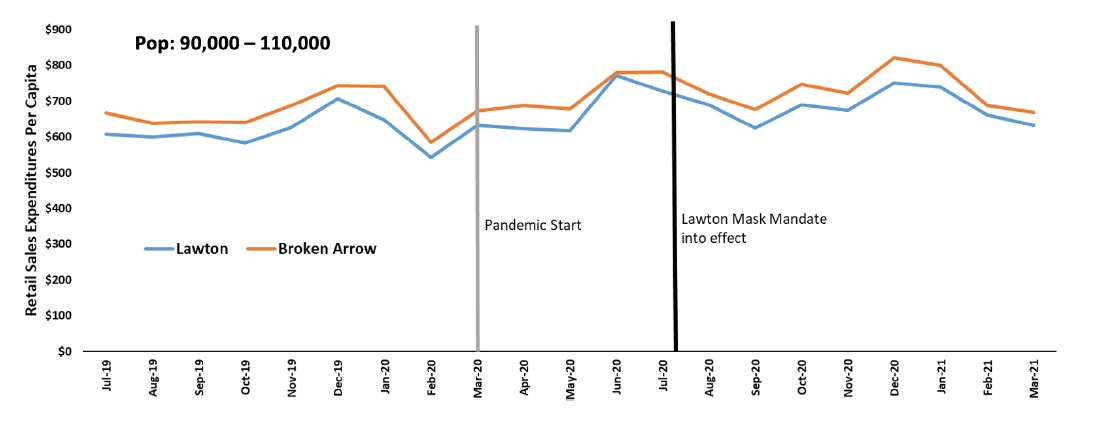
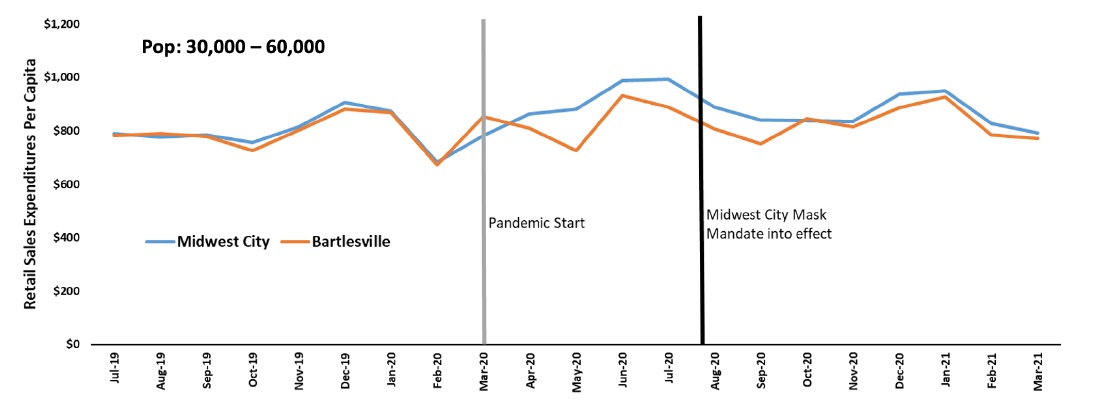
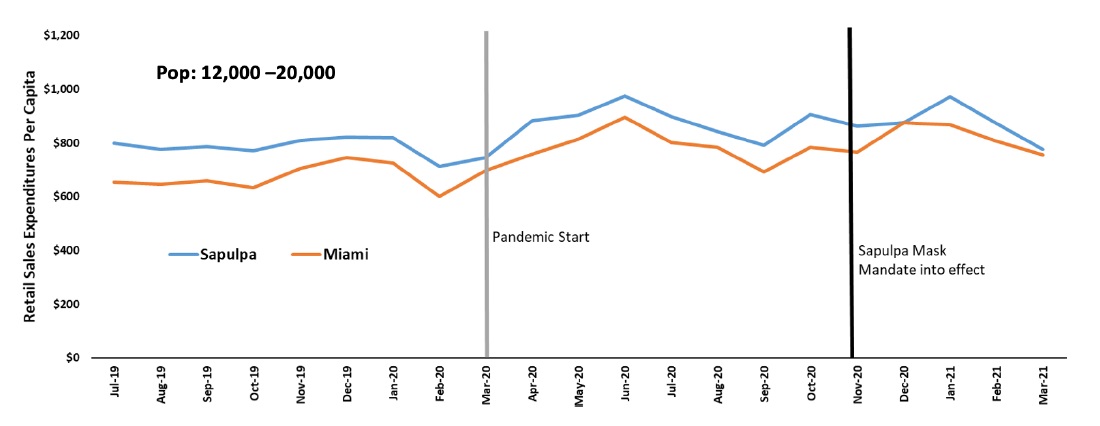
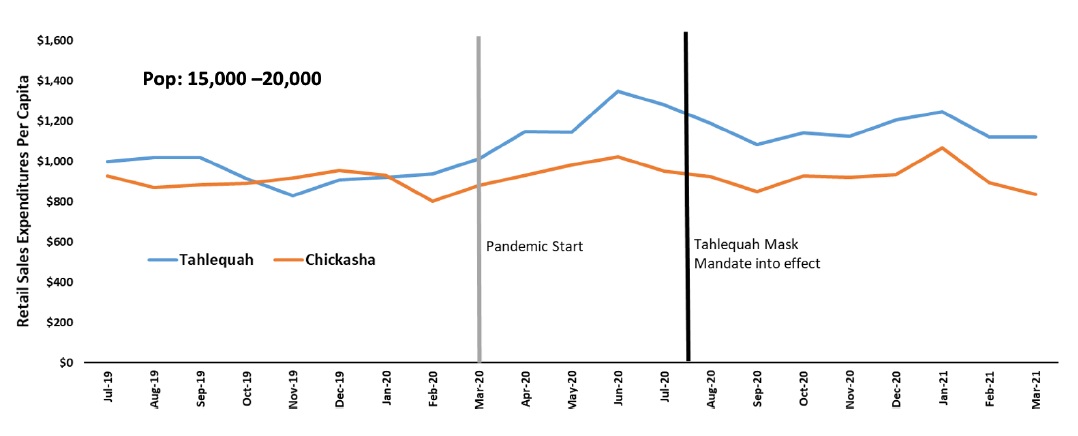
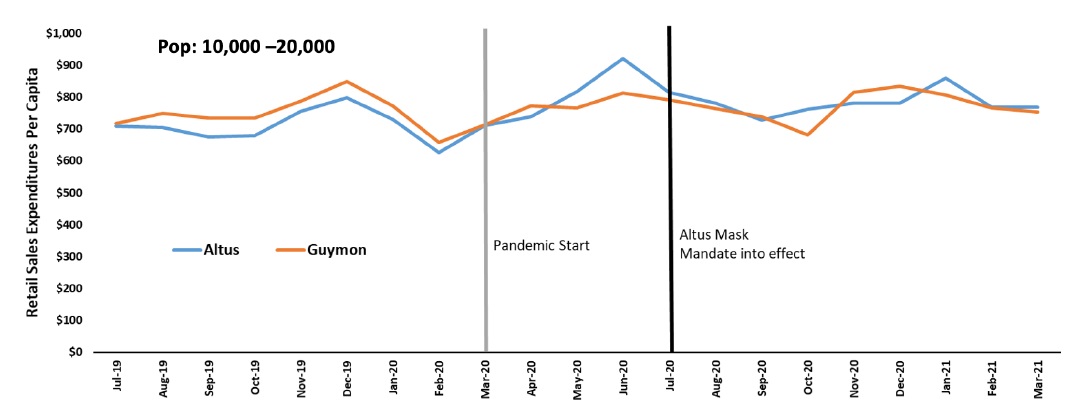
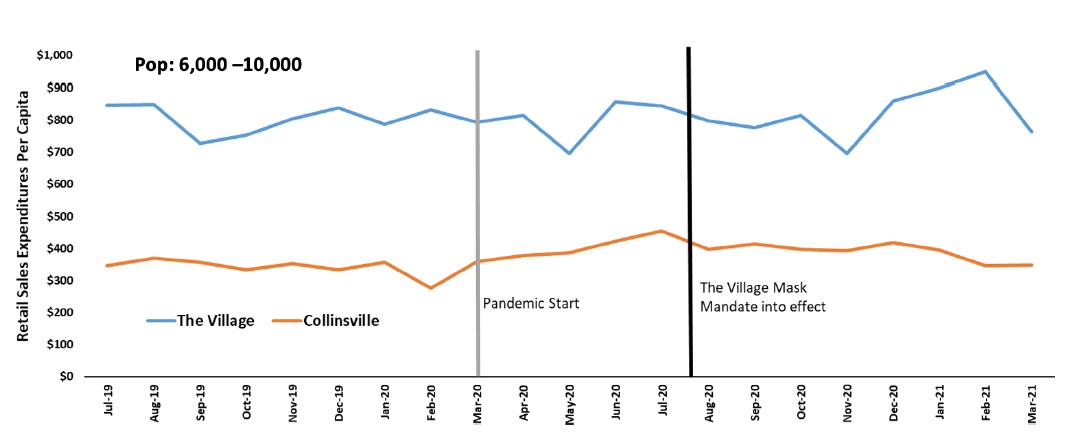
These results offer some evidence that mask mandates did seem to have a positive influence on retail sales expenditures in Oklahoma communities. However, the analysis here does not necessarily represent a causal relationship: there are other characteristics in each community that could affect retail sales activity (age/income of residents, commuting trends, strength of retail sector, behaviors of front-line clerks and customers), and the potential impacts of these characteristics are not considered here. A more in-depth analysis would require regression analysis or alternative statistical technique (such as coarsened exact matching) to isolate the effect of the mask mandate. Recent studies have used these tools to demonstrate other factors affecting retail sales in Oklahoma such as oil and natural gas activity and awarding of rural development business loans (Whitacre et al., 2020; Smith and Whitacre 2021). Other limitations are that local political views or the enforcement/acceptance of mandates were not accounted for. A case-by-case analysis of comparably sized communities (Appendix) shows a wide degree of variation in retail sales performance: in only one instance (Tahlequah vs. Chickasha) does a clear divergence emerge. Thus, while the aggregate evidence does support the idea that mask mandates matter, the true impact may be hidden by important local circumstances. Finally, data on the percentage of sales that were online in each city is not known. This is likely responsible for at least part of the increase seen in the immediate aftermath of the pandemic’s onset. Online purchases may have differed dramatically across our communities – and could have been affected by mask mandates in those locations.
Each of our six mask mandate cities allowed them to expire as of May 2021. Nonetheless, it is important to learn from the natural experiments that arose in response to the pandemic. The analysis here shows the six cities with mask mandates that were examined slightly outperformed comparable non-mask cities in terms of local retail expenditures per capita; however, both groups generally performed well (i.e. had larger retail expenditures compared to a year prior) as shoppers adjusted to dealing with COVID-19. It is likely future retail sales will not return to their exact pre-pandemic trends, and local officials should be aware of the shifts that have taken place.
Additional Resources
- Bureau of Labor Statistics. 2020. “Industries at a Glance. Retail Trade: NAICS 44-45.” Available online: https://www.bls.gov/iag/tgs/iag44-45.htm
- Douglas, Kaylee. 2020. “List: Oklahoma Cities with Mask Mandates.” Oklahoma News 4 Website. Available online: https://kfor.com/news/list-oklahoma-cities-with-mask-mandates/
- J.P. Morgan. 2020. “How COVID-19 Has Transformed Consumer Spending Habits.” Available online: https://www.jpmorgan.com/solutions/cib/research/covid-spending-habits
- McKinsey. 2021. “Survey: US Consumer Sentiment During the Coronavirus Crisis.” Available online: https://www.mckinsey.com/business-functions/marketing-and-sales/our-insights/survey-us-consumer-sentiment-during-the-coronavirus-crisis
- OK Commerce. 2020. “Open Up and Recover Safely: A Three-Phased Approach to Open Oklahoma’s Economy.”
- Available online: https://www.okcommerce.gov/wp-content/uploads/Open-Up-and-Recover-Safely-Plan.pdf
- Sheth, Jagdish. 2020. “Impact of COVID-19 on Consumer Behavior: Will the Old Habits Return or Die?” Journal of Business Research 117: 280-283.
- Smith, Ty and Whitacre, Brian. 2021. “The Impact of USDA’s Business and Industry Loan Guarantee Program on Tax Revenue in Oklahoma Communities.” Community Development. https://doi.org/10.1080/15575330.2020.1855221
- Whitacre, Brian, Johnston, Dylan, Shideler, David, and Lansford, Notie. 2020. “The Influence of Oil and Gas Employment on Local Retail Spending: Evidence from Oklahoma Panel Data.” The Annals of Regional Science 64(1): 133-157.
- U.S. Census Bureau. 2021. Quarterly Retail E-Commerce Sales. Available online: https://www.census.gov/retail/index.html#ecommerce
Appendix. Case-by-case analysis of retail sales per capita (by comparable population cities).


