Drought Exposure and Crop Impacts in Oklahoma and Surrounding States
Introduction
Over the past two decades (2000-2020), severe weather incidents have increased, resulting in extensive damage to land and businesses. Oklahoma has experienced two major drought events (2010-2015, 2022) in the past 10 years, causing major losses to agricultural enterprises in the state. Economic damages in the 2010 to 2015 Oklahoma drought alone surpassed $2 billion (NOAA, 2022). These damages are significant for farms and ranches but also affect the sustainability of communities, businesses and institutions, resulting in long recovery periods.
One way that farmers and ranchers mitigate the risks caused by severe weather incidents,
like drought, is through crop insurance. In Oklahoma, the acreage insured through
crop insurance reached a new high in 2021 with 7,391,525 insured acres
(USDA, 2022). When a crop is damaged by drought, the producer submits a notice of
loss even if the crop has not been harvested. The insurance agency will appraise
the extent of the loss before releasing the crop to another action like cutting forage
or destroying the damaged crop to plant another. For this reason, crop insurance
indemnity information can be used as a complementary data source in addition to U.S.
Drought Monitor data to measure the true severity of drought in agricultural areas.
Because crop insurance indemnity records serve as a robust proxy of drought damages,
this fact sheet provides a combined measure that simultaneously indicates both drought
exposure and impact for a given county across an 8-state region that includes Oklahoma
and surrounding states.
Determining Drought Exposure and Impact
Here crop insurance data are used as a complementary source of drought measurement, in addition to existing meteorological data on drought incidence. Data were sourced from two distinct data sets spanning from 2010 to 2021. County-level meteorological drought data were extracted from the U.S. Drought Monitor’s “Weeks in Drought” Database, while county-level crop insurance data by loss type were obtained from the USDA Risk Management Agency’s Cause of Loss Summary of Business.
To measure drought exposure in terms of meteorological severity, we tallied the number
of weeks in which each county experienced a severe drought. We limited our observation
to the two highest drought classifications, known colloquially
as D3 or D4 drought (extreme drought and exceptional drought, respectively). We weighted
each drought event so that one week of D4 drought was equivalent to two weeks of a
D3 drought. To adjust for varying impacts of droughts on crop growth according to
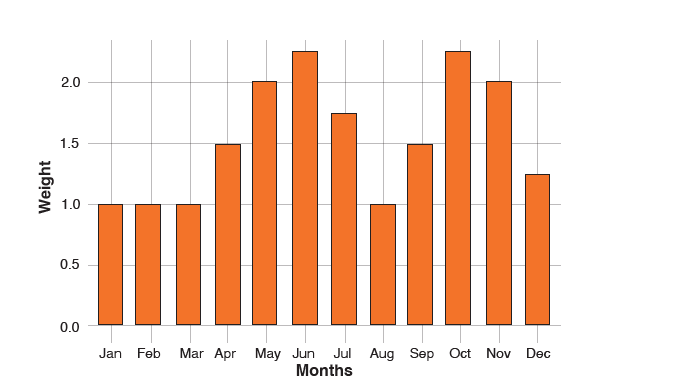
average harvesting schedules, we also assigned weights to each week based on the month
in which they occurred (see Figure 1). Weights were based on crop-specific planting
calendars for Oklahoma, with heavier weights on months that are critical for rainfall.
For example, drought was weighted more heavily for winter wheat planting months in
the early fall and critical growing months in the late spring before harvest. The
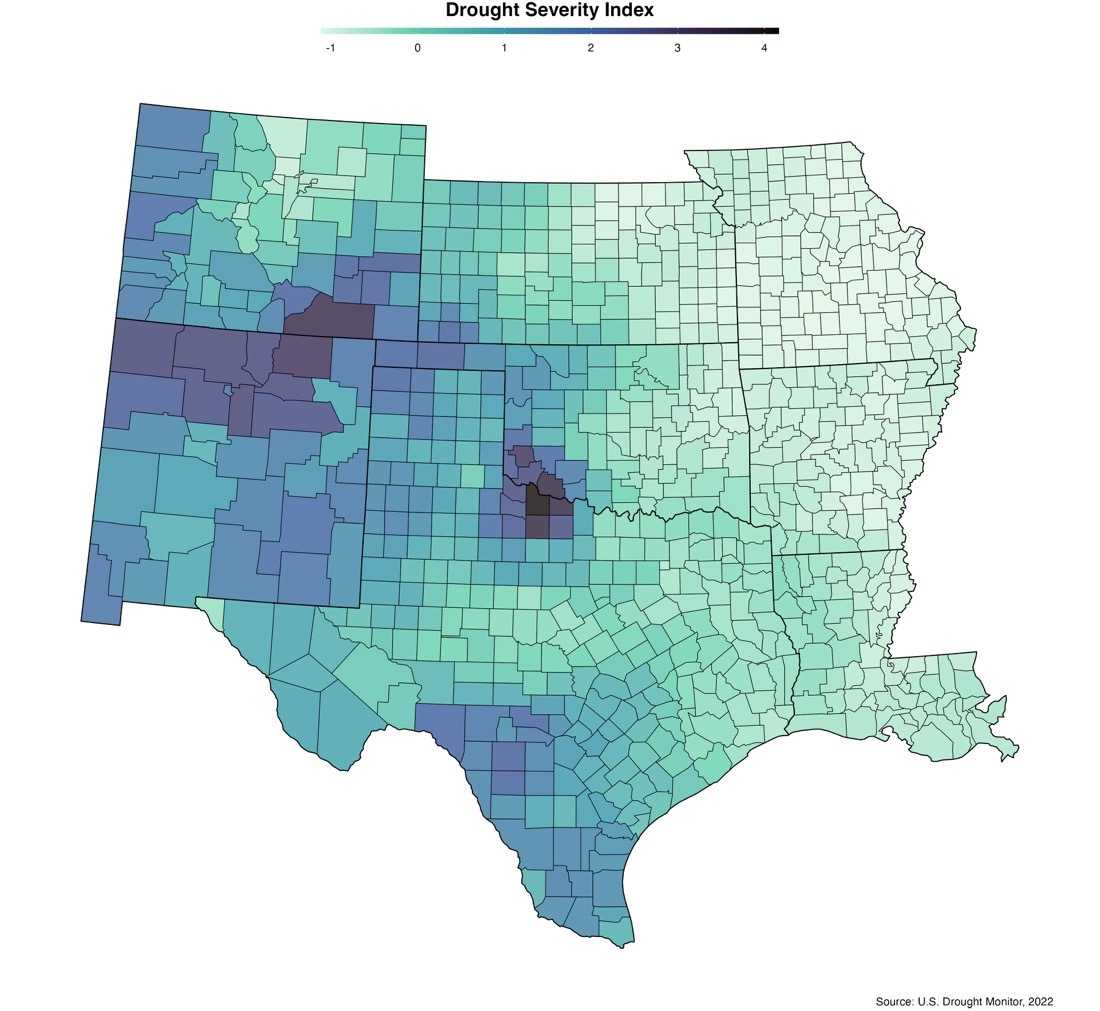
resulting index of drought exposure is illustrated in Figure 2.
Figure 1: Monthly weights used in season-weighted
severity index.
To measure drought impact in terms of agricultural damages, we generated an index using crop insurance COL data and the following formula:
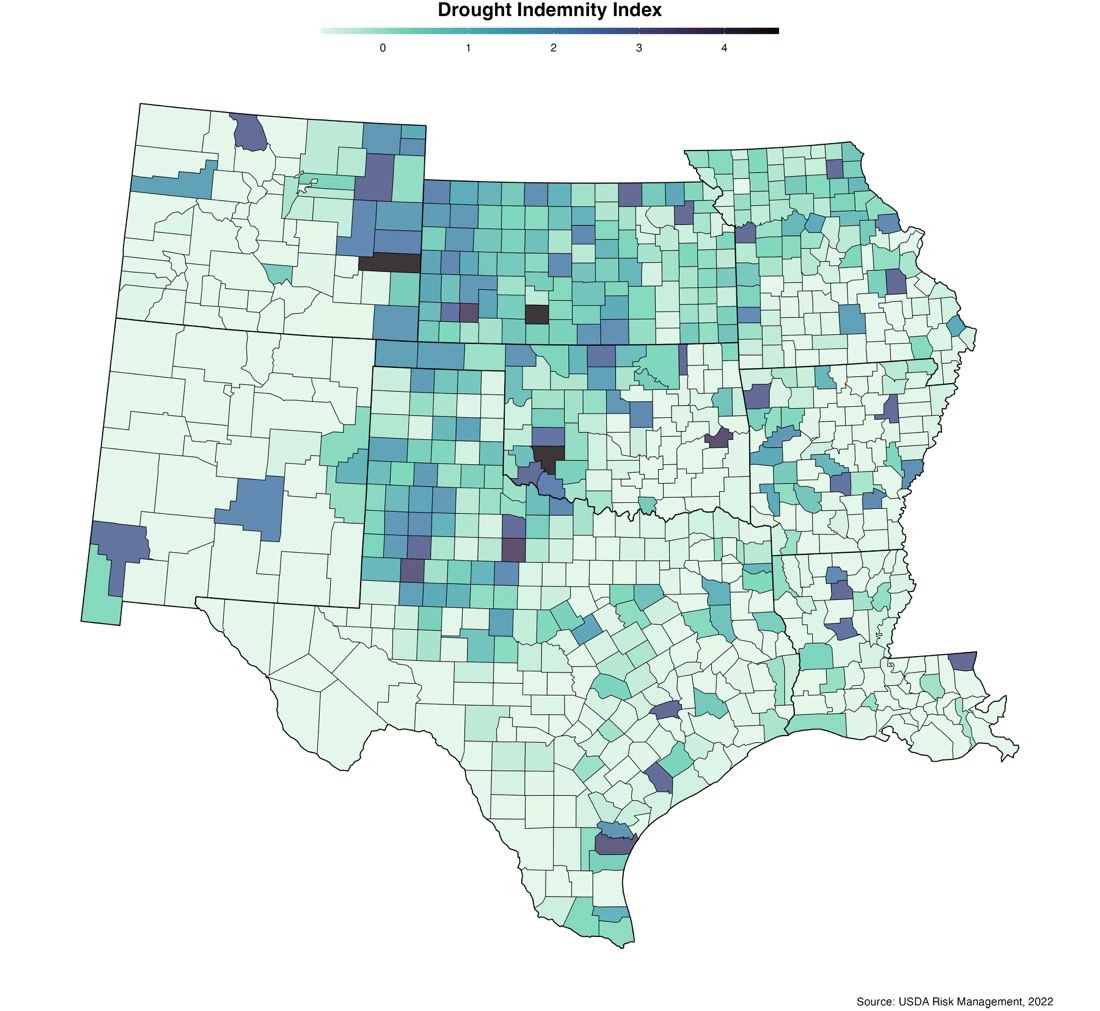
The formula is relatively straightforward. First, a “loss ratio” is calculated by dividing indemnity amounts by the total premium amounts (across all crop and policy types)for drought-associated loss. Since the loss ratios didn’t consider differences in production intensity among counties, the loss ratio is then multiplied by the number of acres corresponding with the damages. The resulting index of agricultural drought impact is illustrated in Figure 3.
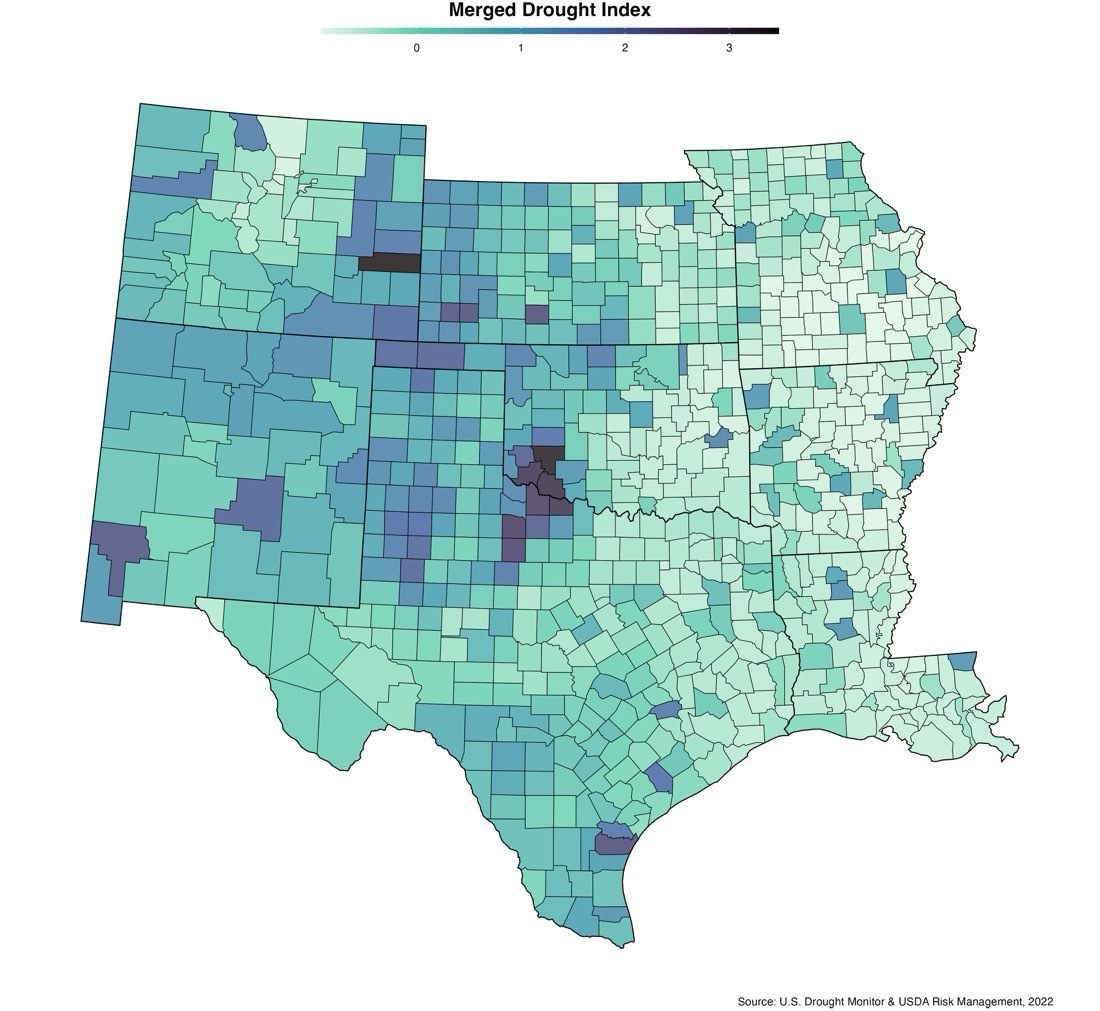
Finally, both measures—severity-weighted drought weeks and acre-weighted loss ratios—were merged to create a final combined index. This index highlights variations in both meteorological data and crop insurance indemnity amounts claimed by producers.
Figure 2 shows the U.S. Drought Monitor data reflecting the weighted severity. The most intensive drought was observed in New Mexico, Southeastern Colorado and Southwestern Oklahoma. In Oklahoma alone, drought-related direct damages for 2011 were estimated at $1.7 billion, with $463 million in crop insurance and disaster payments to help offset those losses (Shideler et al., 2012).Figure 3 shows the distribution of drought indemnities across the 9-state region, and slightly different areas of loss concentrations are seen corresponding to heavier densities of cropland. These areas may also grow higher-value summer crops that can be negatively impacted by untimely heat and drought. Figure 4 shows the combined index, which emphasizes portions of the eight-state area where drought and cropland intersect.
Figure 2: 2000-2020 Drought Severity Index for 8-State Region.
Figure 3: 2000-2020 Drought Indemnity Index for 8-State Region
Figure 4: 2000-2020 Merged Drought Index for 8-State Region
What Can We Learn from this Index?
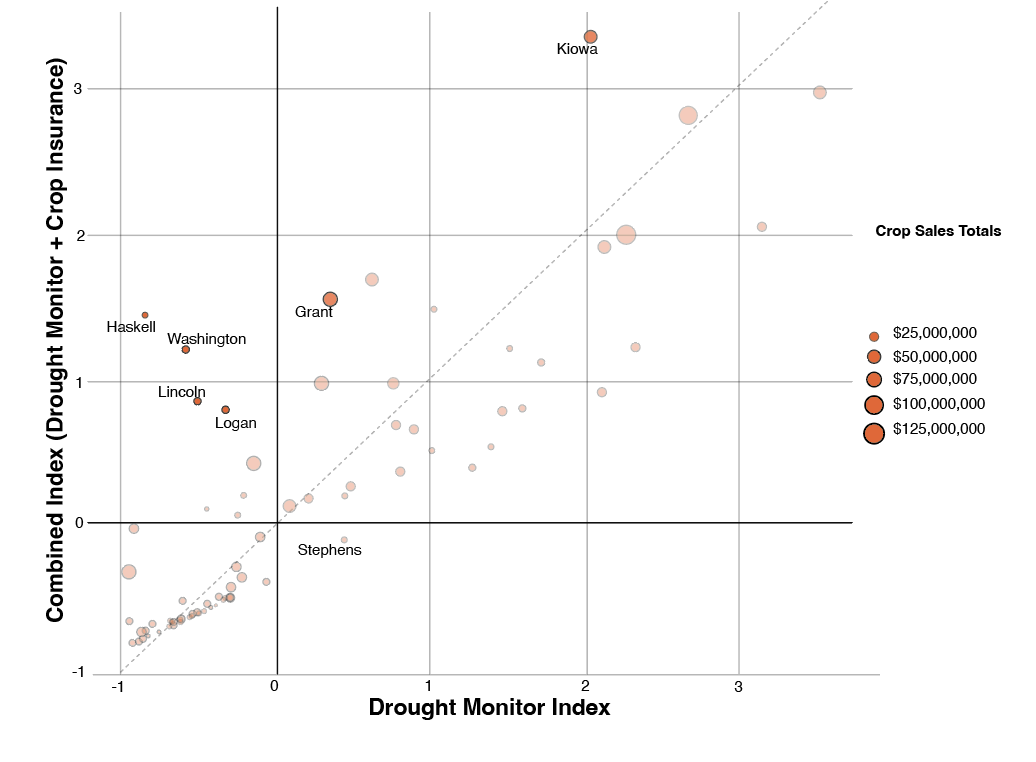
The addition of crop insurance indemnity data to drought severity helps us better understand drought impacts on crop production. Figure 5 offers a closer examination of the gap between the meteorological drought index value and the merged index value among Oklahoma counties. The comparison is broken into four groups (the vertical and horizontal dark lines). Looking at Figure 5, counties in the top-left quadrant experienced a slightly lower relative drought exposure (a low drought monitor index) but experienced higher relative damages (a high merged index value). This indicates that, in consideration of their agricultural risk, their drought damages were more severe than what one might expect from the Drought Monitor alone. This may be due to differences in wind speeds, soil composition or other non-drought factors that contribute to crop losses.
Counties in the top-right quadrant had a high initial drought monitor index and a high merged index value. Specifically, Grant and Kiowa counties experienced a significant change in their initial drought monitor index. This suggests that, in these counties already experiencing severe drought, producers also faced agricultural risks that further increased the drought’s effects. Although no significant changes were observed in counties located in the bottom quadrants, Stephens County stands out as the only county with a high initial drought monitor index but a lower merged index value, warranting further attention on how producers in that county are offsetting the impact of drought conditions. Overall, Figure 5 showcases that there may be certain places that face additional risk factors affecting damages and other places that are offsetting drought damages, perhaps by utilizing management practices that limit the effects of drought compared to what NOAA data-based drought exposure exhibits.
Figure 5: Comparison of Meteorological Drought Index and Combined Drought Index
Note: Faded dots indicate a change of less than one standard deviation from their original index value and were considered insignificant, while dots that remained solid represent a change of at least one standard deviation from their original index value and were considered significant.
Conclusion
This report is a starting point for conversations around drought damage expectations
in Oklahoma and surrounding states. The next steps are to dig further into some key
areas. First, what are the ways producers in the counties with high drought exposure
have adapted to reduce the impacts of drought? Partnerships and networks around the
state may be needed to delve deeper into the drought management practices employed
by farmers in specific counties and
their impact. Understanding these practices can inform more targeted decision-making
in drought mitigation and response. Second, this analysis also highlights the financial
impacts of drought on crop production, which then impacts local communities from the
agricultural cooperative and supply store to the gas station. It would be valuable
to study the factors influencing drought vulnerability and resilience within rural
communities, businesses and agricultural operations. By understanding these influences,
targeted interventions can be developed to enhance resilience in these sectors. Third,
this index uses only crop insurance data, but there are several disaster programs
producers can use during drought. For example, the impacts on livestock producers
may be underrepresented in these maps but could be improved by looking at Livestock
Forage Program eligibility and payments. In addition, the developed indices can be
utilized beyond resilience analysis to assess the effectiveness and impact of disaster
programs and crop insurance. By incorporating these indices into such studies, a comprehensive
understanding of the strengths and limitations of these programs can be gained.
Future research may also expand the geographic scope of this study to include more
states beyond Oklahoma. The US Drought Monitor and RMA COL sources include data
for all fifty states, which would allow for a nationwide index of drought exposure.
Another area of expansion is type of loss: the RMA COL data include a wide variety
of loss types, including freezing weather, hail and fire. These could be merged with
corresponding meteorological data (using sources such as NOAA or the CDC) to produce
similar exposure indices for other types of hazardous weather.
In conclusion, the impacts of drought are local and may vary greatly across counties (and even within a county). Results show that, while U.S. Drought Monitor data are important and useful, estimating the damages from drought may need to consider several other local factors. These findings highlight the need for additional research into county-specific drought management practices, the factors that influence vulnerability and resilience, and the integration of the developed indices into assessments of disaster programs and crop insurance. By pursuing these information avenues, we can gain deeper insights into the most effective strategies for enhancing resilience in rural communities, businesses and agricultural operations. Ultimately, these efforts will contribute to the development of more robust and sustainable drought management practices, ensuring the long-term resilience and well-being of these vital sectors.

