Oklahoma Bermudagrass Variety Performance Tests: 2019 Forage Year
Introduction
Selecting the most appropriate variety is very important for establishing perennial pastures, such as Bermudagrass, because variety selection will dictate the potential forage yield and quality for many years to come. Establishment method (sprigging vs. seeding), winter hardiness, site-specific adaptations, growth morphology (grazing vs. hay types) and forage quality are all traits that must be considered when deciding which Bermudagrass variety to plant. Fact sheet PSS-2600, Selecting an Appropriate Bermudagrass Variety for Pastures, available at: extension.okstate.edu, discusses the traits that are important for choosing the most appropriate variety for a specific location.
The purpose of this current report is to highlight differences in forage yield among commercially available sprigged and seeded Bermudagrass varieties grown in trials in several locations across Oklahoma. This information can give producers an indication of forage potential of the varieties evaluated. However, the forage yields reported here are the results derived from complex interaction among varietal genetic potential, management factors such as planting date, seeding rate, soil fertility and environmental factors, such as temperature, rainfall amount and distribution. These factors vary greatly from location to location and among Oklahoma’s geographic regions, so final forage yield and quality observed by producers will be affected by environmental and management. Thirteen commercially available varieties were tested in four different locations across Oklahoma (Figure 1). Fact sheet PSS-2600 contains brief descriptions of the agronomic characteristics of all tested varieties.
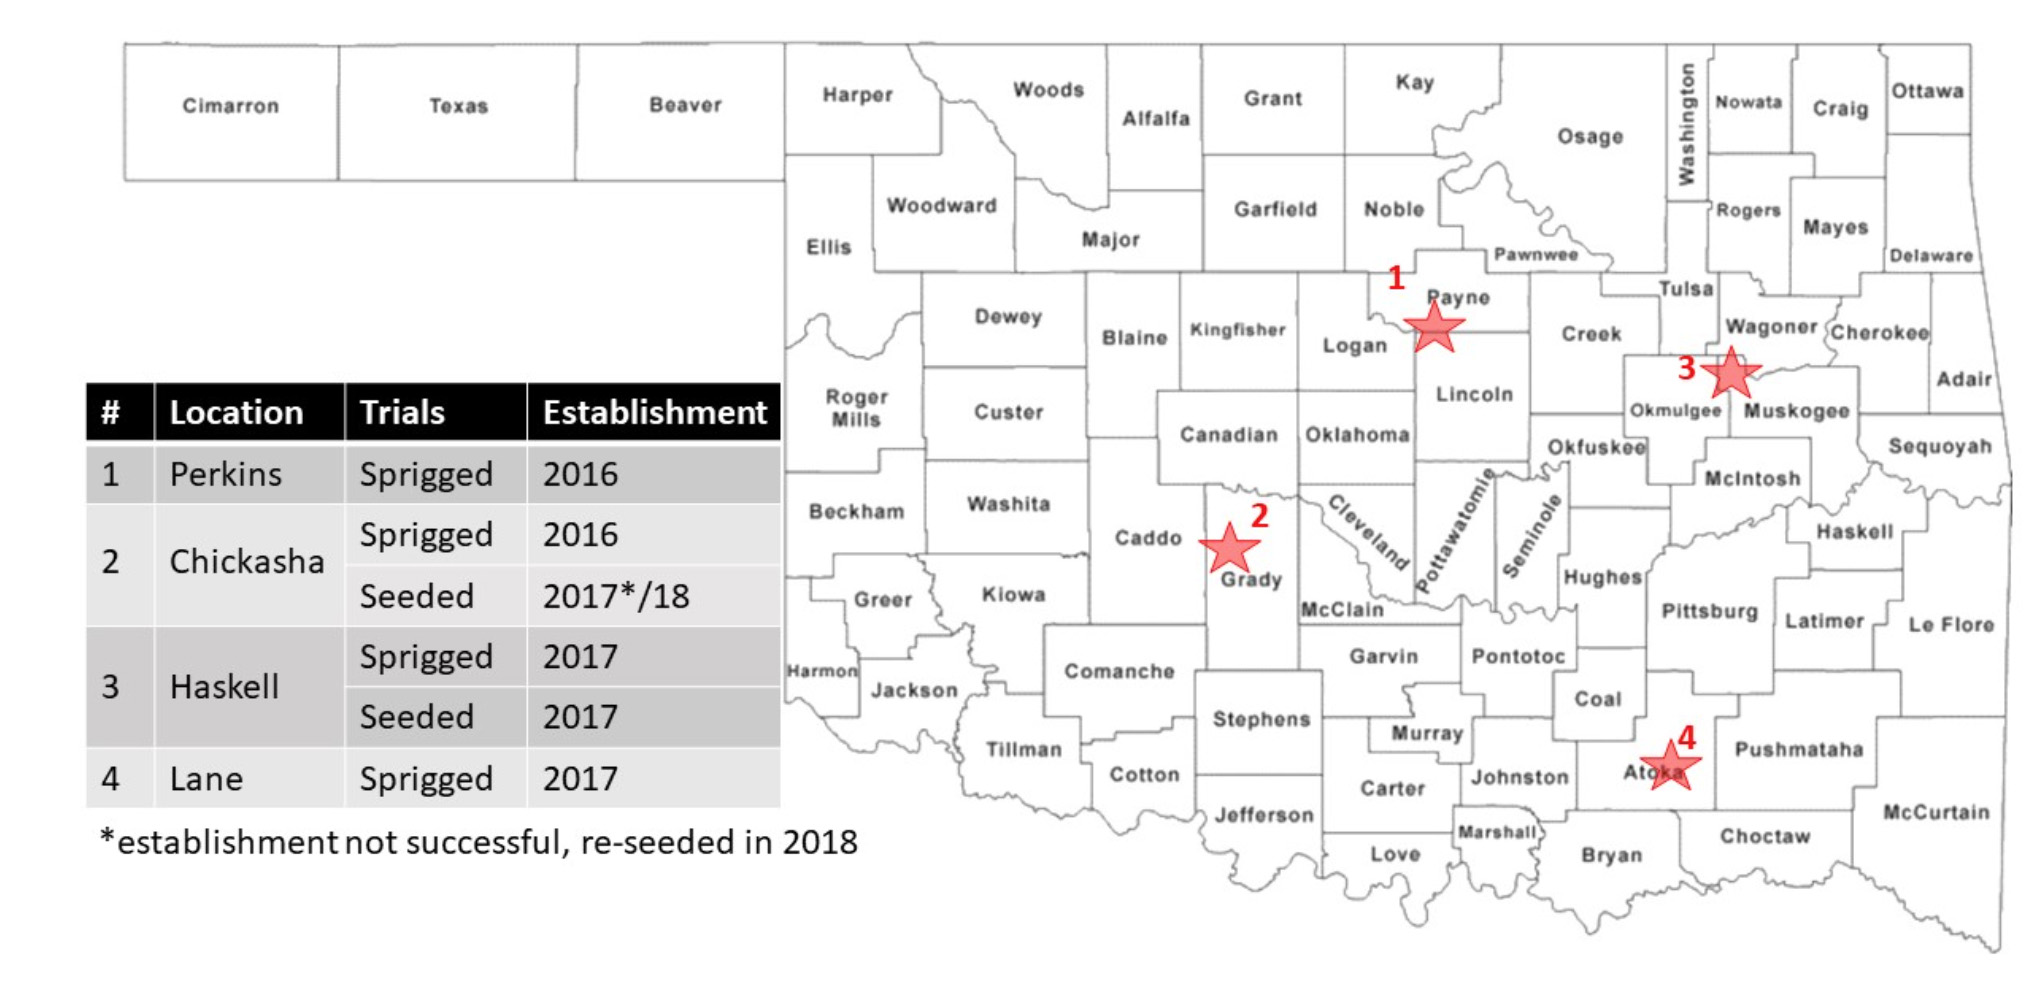
Figure 1. Bermudagrass performance test locations.
Site Description and Methods
Bermudagrass variety performance tests were established at four locations in Oklahoma in 2016 and 2017. Forage yields were harvested in successive years. The experimental design was a randomized complete block with four replications. Plots were established in a conventionally-tilled, firm seedbed. Phosphate (P) and potash (K) were applied according to soil test recommendations (Table 1) and incorporated 3 inches deep during seedbed preparation. Sprigged plots were sprigged at four sprigs per 10 square feet, which is similar to a rate of 40 to 50 bushels of sprigs per acre. Seeded plots were seeded at 15 pounds of pure live seed per acre, which corresponds to the highest recommended seeding rate among participating companies. Thirty pounds of actual nitrogen per acre (65 pounds of urea per acre) was broadcast when stolons were three inches long. At subsequent years, P and K was broadcast early spring at same rate applied during establishment. Nitrogen fertilizer was broadcast at a rate of 200 pounds nitrogen per acre (440 pounds of urea per acre) right after Bermudagrass broke dormancy and produced the first green leaves (green-up) every year.
Table 1. Site Description and Methods.
| Locations | Establishment method | Establishment date | Soil texture | pH | N | STP | STK | |
|---|---|---|---|---|---|---|---|---|
| Perkins | Sprigged | 7/15/2016 | sandy loam | 6.3 | 0 | 17 | 110 | |
| Chickasha | Sprigged | 7/18/2016 | clay loam | 6.6 | 3 | 67 | 510 | |
| Chickasha | Seeded | 5/6/2018 | silt loam | 6.4 | 9 | 76 | 336 | |
| Haskell | Sprigged/seeded | 5/18/2017 | silt loam | 7.1 | 4 | 42 | 103 | |
| Lane | Sprigged | 5/20/2017 | sandy loam | 6.9 | 5 | 18 | 122 | |
- STP: soil test P index; STK: soil test K index
Plots were hand-weeded during the establishment phase to avoid potential herbicide injury. After establishment, pre-emergent (pendimethalin) and post-emergent (glyphosate) herbicides were applied in late winter or early spring (before green-up), respectively. Early-season weeds at green up (early May) were controlled by mowing at 2 to 3 inches in height. In-season weeds were controlled by hand-weeding and/or selective post-emergent herbicides such as 2,4-D and dicamba.
Forage was measured by hand clipping three 1-square-foot quadrats per plot 1 inch above the soil surface. Plots were mowed and cleaned to simulate hay harvest immediately after sample collection. Samples were oven-dried until constant weight indicating that all samples were completely dry (absent of moisture), and total dry forage yield was assessed. Forage sampling (cut) was targeted for every six weeks, which generally resulted in three to four cuttings per year, depending on temperature and rainfall amount and distribution through the season.
Results
Perkins
Forage yields were similar to those reported in 2018; however, yields were less than in 2017. Herbicides failed to control weeds during the early stages. Abnormal large rainfall totals in March and April delayed pre-emergent application and prohibited post-emergence herbicide application before Bermudagrass green-up. Consequently, weed interference negatively impacted the first cut yields. Inadequate rainfall after first cut consequently limited second cut yields. The third cut was the least productive of the season; however, it was similar to previous years.
Chickasha
Large amounts of rainfall during early spring limited the effect of the pre-emergent herbicide and prohibited the application of a non-selective post-emergent herbicide before green-up. As a result, weed interference was substantial during the early season, which decreased forage yield when compared to the previous year. Inadequate rainfall after the first cut reduced forage yield in the second cut. As expected, the third cut was the least of the season; however, it was similar to the last years.
Among sprigged cultivars, total forage yields ranged from 7.0 to 3.9 tons per acre. The top highest-yielding varieties were Ozark, Tipton44 and Goodwell, respectively. Greenfield was the lowest yielding variety.
Good total forage production was observed among seeded cultivars at their first-year production. All seeded cultivars showed similar total dry forage yields ranging from 5.7 to 5.0 tons per acre.
Haskell
Although amounts of rainfall during early spring were greater than optimal in Haskell, pre- and post-herbicides were applied during early spring; therefore, weed incidence was much less than at other locations. However, a large number of cloudy days during the early season reduced air temperature, total solar radiation, and consequently, yields at first cut when compared to the previous year. Second and third cuts yields were similar to the previous year. No weeds or water stress were observed throughout the entire growing season.
Ozark (6.0 tons per acre) followed by Midland 99 and Goodwell were the top total forage yielding sprigged cultivars, and Greenfield (3.9 tons per acre) was the lowest yielding cultivar. Among seeded cultivars, the top total yielding varieties were Riata (6.0 tons per acre), Stampede Plus and Wrangler. Tierra Verde (4.8) was the lowest yielding.
Lane
Much like Perkins and Chickasha, delayed pre- and post- herbicide application resulted in weed interference during the early season. Furthermore, highfield humid conditions resulting in abundance of free moisture in the plant canopy during May and June resulted in a very high incidence of fungal disease, i.e., Bipolaris Leaf Spot (Bipolaris spp.) in all cultivars. This disease persisted after the first cutting, affecting plants regrowth. Consequently, the first and second cuts had reduced forage yields when compared to the previous year’s yields. All cultivars provided similar total forage yields ranging from 5.9 to 5.0 tons per acre, except for Greenfield (4.4 tons er acre).
Final Considerations
Differences among varieties across locations were observed; however, it is too early to conclude which varieties are best adapted to each location. Bermudagrass takes three to four years to establish and to provide data that are indicative of final yield potential. These Bermudagrass variety performance tests will be continued to assist producers in making future variety decisions.
Acknowledgments
Thanks to the Oklahoma Agricultural Experiment Station (OAES) superintendents Josh
Massey, Michael Pettijohn, Rodney Farris and Jim Vaugham for conducting field management
practices such as soil bed preparation, fertilization, weed/pest control and alleys
maintenance. This research was developed in collaboration with OAES, Oklahoma Cooperative
Extension Service (OCES); and partially funded by Pennington® seeds and Johnston Seeds
Co.
Table: Sprigged Bermudagrass Performance test, Perkins, 2019
Cimarron Valley Research Station, Payne County
(Tons Dry Matter/Acre)
| Entry | 27-Jun | 13-Aug | 30-Sep | Total | |
|---|---|---|---|---|---|
| Goodwell | 2.7 | 1.2 | 1.1 | 4.9 | |
| Ozark | 2.8 | 1.0 | 1.0 | 4.8 | |
| Midland99 | 2 | 1.3 | 1.3 | 4.6 | |
| Midland | 2.1 | 1.0 | 1.0 | 4.1 | |
| Tifton44 | 2.8 | 1.2 | 1.2 | 5.2 | |
| Greenfield | 2.5 | 1.3 | 0.9 | 4.7 | |
| Mean | 2.5 | 1.2 | 1.1 | 4.7 | |
| 5% LSD | NS | 0.3 | 0.3 | NS |
- Design: Randomized Complete Block
- Plot size: 17 x 17 ft. planted
- No. of Reps: 4
- NS = not significant at p = 0.05
Data provided by the Plant & Soil Sciences Department of the Division of Agricultural Sciences and Natural Resources of Oklahoma State University. For additional information, contact Alex Rocateli at alex.rocateli@okstate.edu
Table: Sprigged Bermudagrass Performance test, Chickasha, 2019
South Central Research Station, Grady County
(Tons Dry Matter/Acre)
| Entry | 14-Jun | 8-Aug | 23-Sep | Total | |
|---|---|---|---|---|---|
| Goodwell | 4.0 | 1.8 | 1.1 | 6.9 | |
| Ozark | 4.0 | 2.2 | 1.2 | 7.4 | |
| Midland99 | 4.1 | 2.3 | 1.0 | 7.4 | |
| Midland | 3.5 | 2.0 | 1.1 | 6.6 | |
| Tifton44 | 3.8 | 2.0 | 1.1 | 6.9 | |
| Greenfield | 3.9 | 1.3 | 0.8 | 5.9 | |
| Mean | 3.9 | 1.9 | 1.1 | 6.9 | |
| 5% LSD | NS | 0.4 | 0.3 | 0.8 |
- Design: Randomized Complete Block
- Plot size: 17 x 17 ft. planted
- No. of Reps: 4
- NS = not significant at p = 0.05
Data provided by the Plant & Soil Sciences Department of the Division of Agricultural Sciences and Natural Resources of Oklahoma State University. For additional information, contact Alex Rocateli at alex.rocateli@okstate.edu
Table: Seeded Bermudagrass Performance test, Chickasha, 2019
South Central Research Station, Grady County
(First year production Tons Dry Matter/Acre)
| Entry | Licensee | 14-Jun | 8-Aug | 23-Sep | Total | |
|---|---|---|---|---|---|---|
| Cheyenne II | Pennington ® | 2.0 | 1.8 | 1.2 | 5.0 | |
| Mohawk | Pennington ® | 2.1 | 1.7 | 1.2 | 5.0 | |
| Riata | Johnston Seed Co. | 2.3 | 1.6 | 1.3 | 5.2 | |
| Sahara II | Pennington ® | 2.4 | 2.0 | 1.3 | 5.7 | |
| Stampede Plus | Johnston Seed Co. | 2.5 | 1.9 | 1.2 | 5.6 | |
| Tierra Verde | Pennington ® | 2.7 | 1.7 | 1.2 | 5.7 | |
| Wrangler | Johnston Seed Co. | 2.6 | 1.5 | 1.4 | 5.5 | |
| Mean | 2.3 | 1.8 | 1.2 | 5.3 | ||
| 5% LSD | 0.7 | NS | 0.4 | NS |
Design: Randomized Complete Block
Plot size: 8 x 17 ft. planted
No. of Reps: 4
NS= not significant at p = 0.05
Data provided by the Plant & Soil Sciences Department of the Division of Agricultural Sciences and Natural Resources of Oklahoma State University. For additional information, contact Alex Rocateli at alex.rocateli@okstate.edu
Table: Sprigged Bermudagrass Performance test, Haskell, 2019
Eastern Research Station, Muskogee County
(Tons Dry Matter/Acre)
| Entry | 18-Jun | 1-Aug | 25-Sep | Total | ||
|---|---|---|---|---|---|---|
| Goodwell | 3.3 | 1.7 | 1.0 | 6.0 | ||
| Ozark | 3.9 | 2.0 | 1.1 | 7.0 | ||
| Midland99 | 3.0 | 1.8 | 1.1 | 6.6 | ||
| Midland | 3.4 | 2.1 | 1.2 | 5.7 | ||
| Tifton44 | 2.8 | 1.3 | 1.1 | 5.2 | ||
| Greenfield | 2.2 | 0.9 | 0.9 | 3.9 | ||
| Mean | 3.1 | 1.6 | 1.1 | 5.7 | ||
| 5% LSD | 0.8 | 0.4 | 0.2 | 1.2 |
- Design: Randomized Complete Block
- Plot size: 8 x 17 ft. planted
- No. of Reps: 4
- NS= not significant at p = 0.05
Data provided by the Plant & Soil Sciences Department of the Division of Agricultural Sciences and Natural Resources of Oklahoma State University. For additional information, contact Alex Rocateli at alex.rocateli@okstate.edu
Table: Sprigged Bermudagrass Performance test, Lane, 2019
Eastern Research Station, Muskogee County
(Tons Dry Matter/Acre)
| Entry | Licensee | 27-Jun | 13-Aug | 30-Sep | Total | |
|---|---|---|---|---|---|---|
| Cheyenne II | Pennington ® | 2.4 | 1.6 | 1.0 | 4.9 | |
| Mohawk | Pennington ® | 2.1 | 1.2 | 1.2 | 4.5 | |
| Riata | Johnston Seed Co. | 2.6 | 1.8 | 1.6 | 6.0 | |
| Sahara II | Pennington ® | 2.3 | 1.5 | 1.0 | 4.8 | |
| Stampede Plus | Johnston Seed Co. | 3.0 | 1.6 | 1.3 | 6.0 | |
| Tierra Verde | Pennington ® | 2.5 | 1.4 | 0.9 | 4.8 | |
| Wrangler | Johnston Seed Co. | 3.0 | 1.3 | 1.0 | 5.3 | |
| Mean | 2.6 | 1.5 | 1.4 | 5.2 | ||
| 5% LSD | 0.5 | 0.5 | 0.3 | 0.8 |
- Design: Randomized Complete Block
- Plot size: 8 x 17 ft. planted
- No. of Reps: 4
- NS= not significant at p = 0.05
Data provided by the Plant & Soil Sciences Department of the Division of Agricultural Sciences and Natural Resources of Oklahoma State University. For additional information, contact Alex Rocateli at alex.rocateli@okstate.edu
Table: Forage Yield Summary - Past Years (Sprigged )
(Tons Dry Matter/Acre)
| Entry | Perkins 2017 | Perkins 2018 | Chickasha 2017 | Chickasha 2018 | Haskell 2018 | Lane 2018 | |
|---|---|---|---|---|---|---|---|
| Goodwell | 7.4 | 5 | 7.7 | 8.1 | 6.2 | 6 | |
| Ozark | 7 | 5 | 6.1 | 9.2 | 7.6 | 7.4 | |
| Midland99 | 6.6 | 5 | 6.3 | 9.8 | 6.6 | 7.3 | |
| Midland | 6.3 | 4.7 | 5.5 | 8.2 | 6.2 | 6.6 | |
| Tifton44 | 6.2 | 4.8 | 5 | 8.9 | 6.2 | 7.1 | |
| Greenfield | 4.1 | 4.3 | 6.7 | 6.6 | 5 | 5.2 | |
| Mean | 6.3 | 4.8 | 6.2 | 8.5 | 6.3 | 6.6 | |
| 5% LSD | 1.3 | NS | NS | 2.7 | 2.4 | 1.4 |
Table: Forage Yield Summary - Past Years (Seeded)
(Tons Dry Matter/Acre)
| Entry | Perkins 2017 | Perkins 2018 | Chickasha 2017 | Chickasha 2018 | Haskell 2018 | Lane 2018 | |
|---|---|---|---|---|---|---|---|
| Cheyenne II | - | - | - | - | 4.7 | - | |
| Mohawk | - | - | - | - | 4.7 | - | |
| Riata | - | - | - | - | 7 | - | |
| Sahara II | - | - | - | - | 4.6 | - | |
| Stampede Plus | - | - | - | - | 6.7 | - | |
| Tierra Verde | - | - | - | - | 5.9 | - | |
| Wrangler | - | - | - | - | 4.4 | - | |
| Mean | 5.4 | ||||||
| 5% LSD | 1.5 |
- Design: Randomized Complete Block
- Plot size: sprigged 17 x 17 ft.
- No. of Reps: 4
- Seeded 8 x 17 ft.
- NS= not significant at p = 0.05
Data provided by the Plant & Soil Sciences Department of the Division of Agricultural Sciences and Natural Resources of Oklahoma State University. For additional information, contact Alex Rocateli at alex.rocateli@okstate.edu
FOR A DETAILED DESCRIPTION OF PAST YEARS ACCESS CR-2604 at https://extension.okstate.edu/fact-sheets/oklahoma-bermudagrass-variety-performance-tests-2016-2018-forage-years.html
 and rainfall (bar graph) from April 15 to October 15 in each respective location and year.")
Figure 2. Average daily temperature (line graph) and rainfall (bar graph) from April 15 to October 15 in each respective location and year. Weather data courtesy of the Oklahoma Mesonet.
Alex Rocateli
Forage Systems Extension Specialist
Lucas Freires Abreu
Graduate Research Assistant, Forage Systems