Cool Season Forage and Hay Quality Result Summary (2019-2024)
- Jump To:
- Key Takeaways
- Related Fact Sheets
Knowing the quality of your forage and hay is essential for properly managing your livestock. It is also a valuable tool for marketing your hay for sale or identifying areas of improvement needed in hay crop management. The proteins ADF (acid detergent fiber), and NDF (neutral detergent fibers) are all affected by species, environment, nutrient management, cutting timing, and baling practices. Low protein values would suggest that nitrogen (N) availability could be limited or that the crop was harvested at a mature stage. The ADF and NDF values can help determine the reason for low protein. As described in PSS-2117, ADF and NDF values increase as the crop matures. Therefore, if your samples have low protein (ADF and NDF results) collecting a soil sample to plan your fertilizer strategy would be recommended. The guide E-1021 should be utilized in making fertilizer recommendations. However, if the protein is low and both ADF and NDF are high, there is a reasonable probability that the forage was harvested at a very mature stage. The Oklahoma State University Soil, Water, Forage Analytical Laboratory (SWFAL) processes thousands of forage samples annually. Armed with the knowledge of the results of samples sent to SWFAL, producers can make more informed decisions on management and marketing.
The graphs below represent the range of results for samples submitted under the SWFAL crop codes 1 (Wheat), 9 (Fescue and Cool Season Grasses), and 11 (Rye Grass). The bar is a heat graph, where red indicates poorer quality and green signifies higher quality. The values shared are the minimum and maximum (the lowest and highest values recorded during the time frame), the average of all the samples, and the percentiles of 25%, 75%, and 90%. These values can help understand the distribution of the results. For example, results above the 90th percentile are better than 90% of submitted samples.
For results, such as fescue/cool season NDF, there is not enough data to analyze so only the minimum, maximum and average are presented.
Key Takeaways
If your results are in the range below 25%
- Your forage/hay quality has great potential to be improved.
- Look at soil fertility, weed control, harvest timing, post-harvest management.
If your results are near the average 50%
- Your forage/hay quality is near the state average but has potential to be improved.
- Look at soil fertility, weed control, harvest timing, post-harvest management.
If your results are in the range above 90%
- Your forage/hay quality has limited potential to be improved.
- Look at the opportunity to market hay as having exceptional quality with potential for added value.
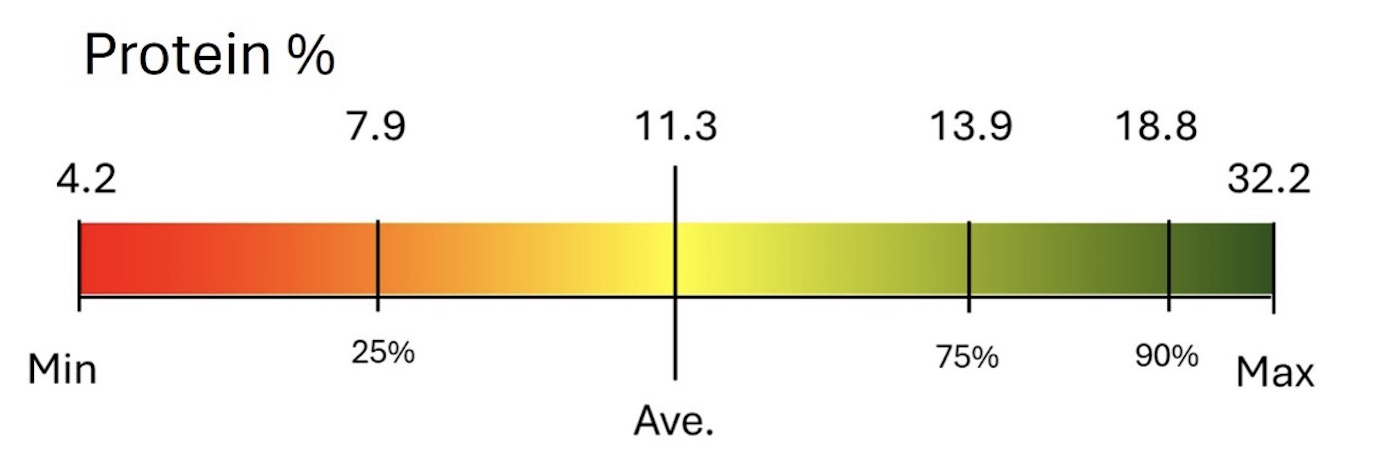
Figure 1a. Protein % distribution of the quality results of forage samples submitted to SWFAL under the crop code 1 (Wheat) from January 2019—June 2024.
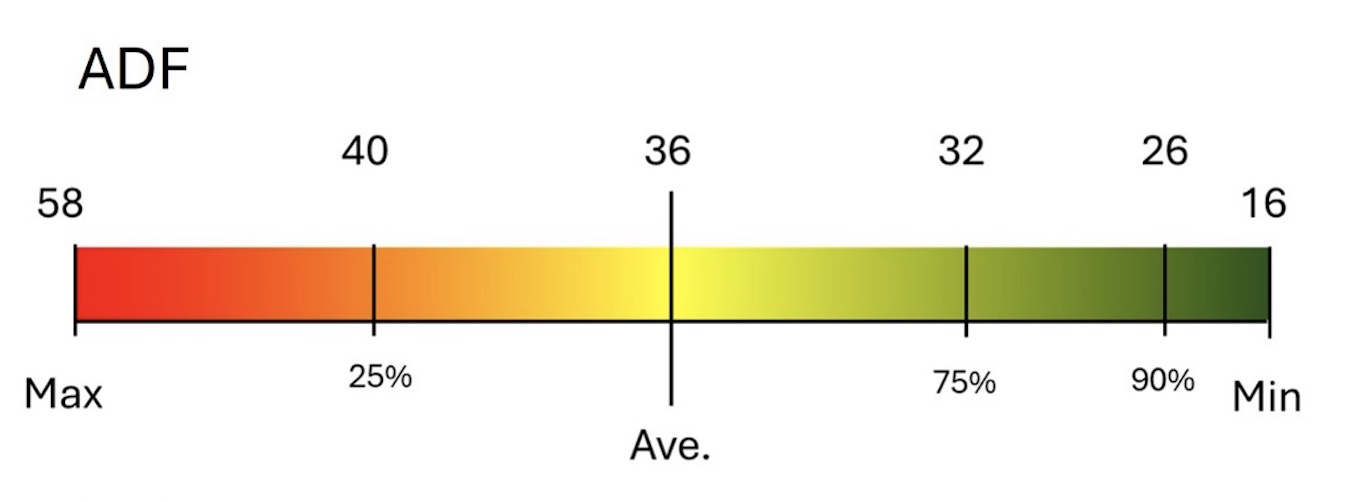
Figure 1b. ADF distribution of the quality results of forage samples submitted to SWFAL under the crop code 1 (Wheat) from January 2019—June 2024.
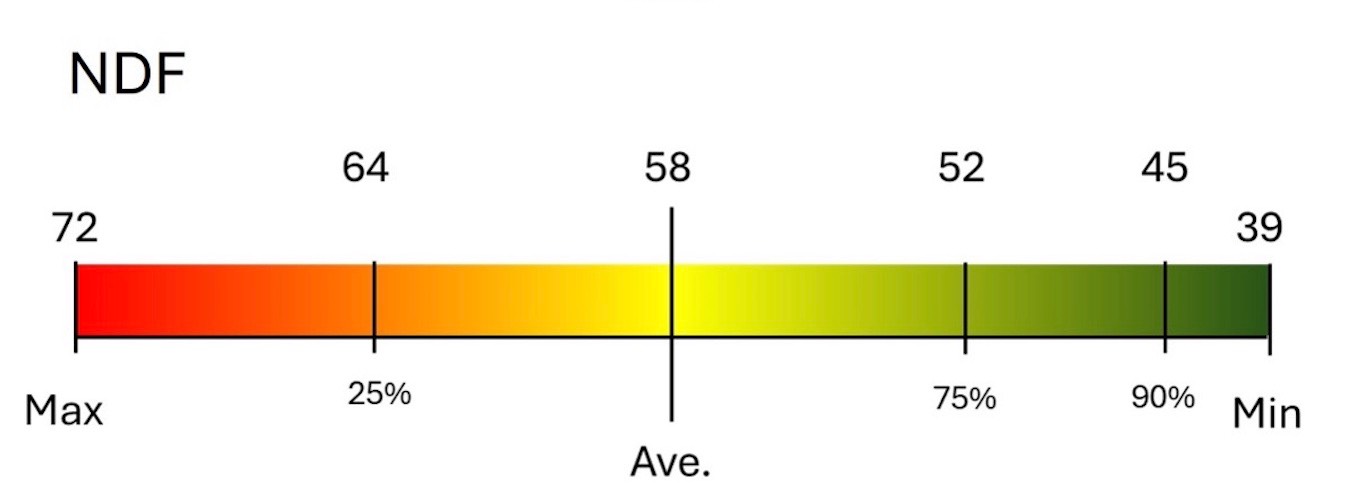
Figure 1c. NDF distribution of the quality results of forage samples submitted to SWFAL under the crop code 1 (Wheat) from January 2019—June 2024.
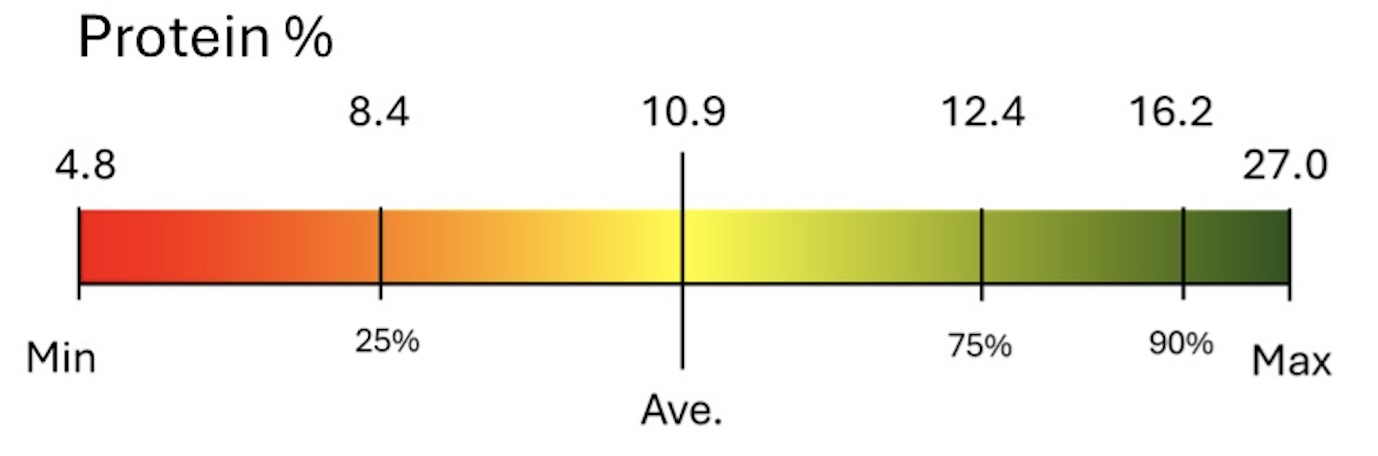
Figure 2a. Protein % distribution of the quality results of forage samples submitted to SWFAL under the crop code 9 (Fescue and Cool Season Grasses) from January 2019–June 2024.
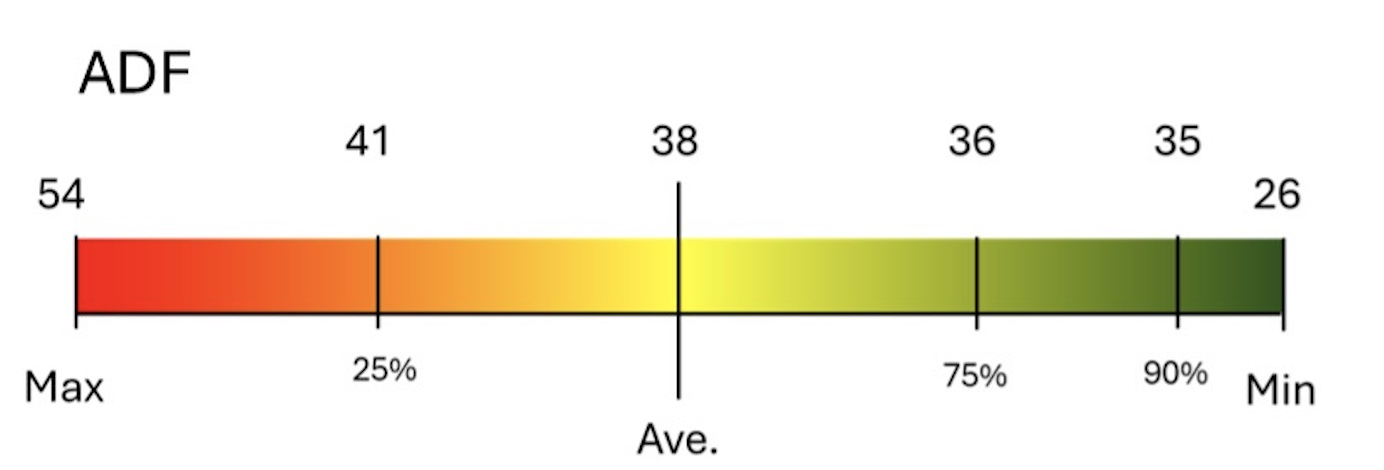
Figure 2b. ADF distribution of the quality results of forage samples submitted to SWFAL under the crop code 9 (Fescue and Cool Season Grasses) from January 2019–June 2024.
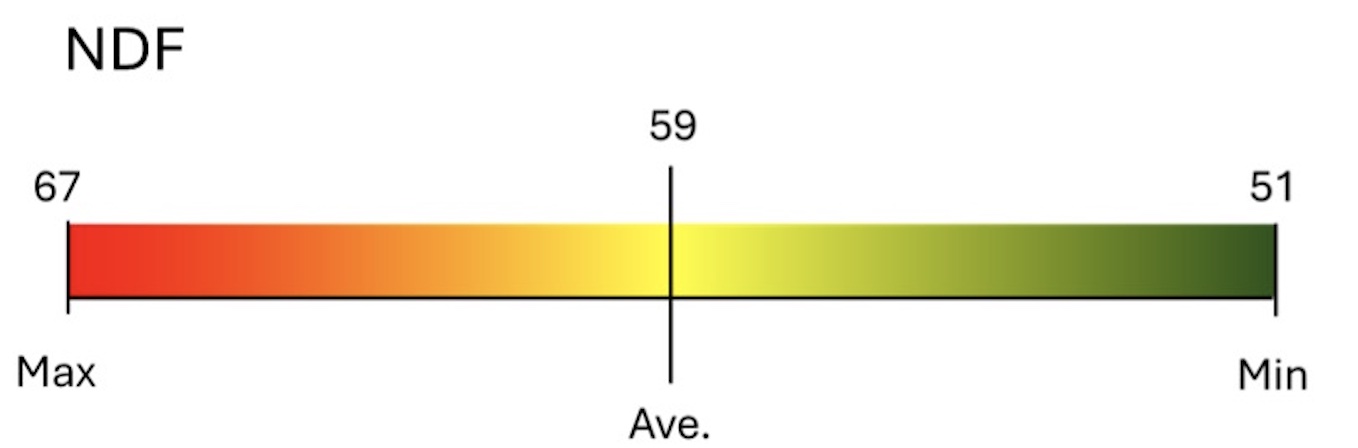
Figure 2c. NDF distribution of the quality results of forage samples submitted to SWFAL under the crop code 9 (Fescue and Cool Season Grasses) from January 2019–June 2024.
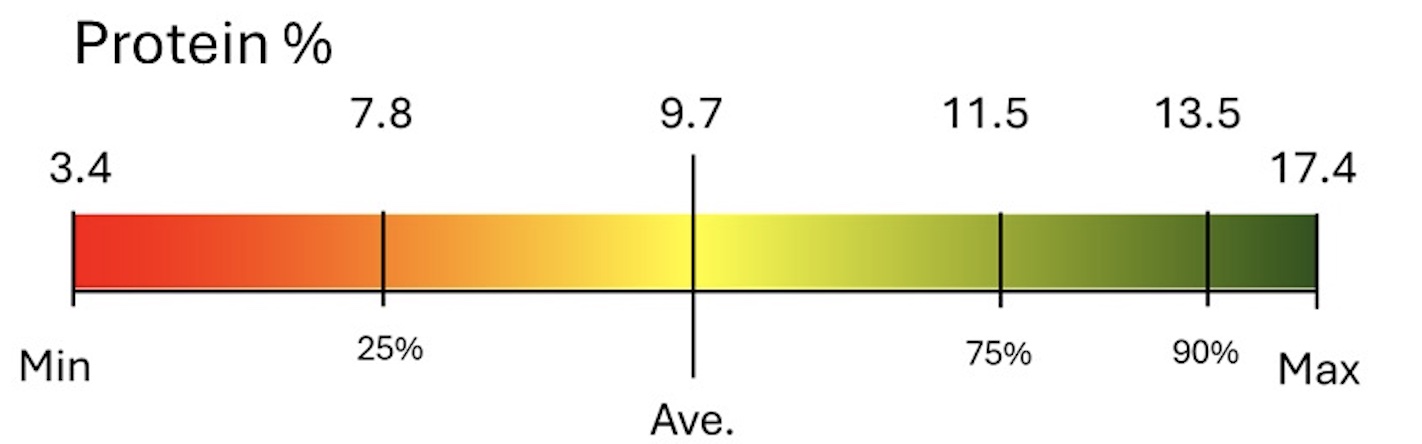
Figure 3a. Protein % distribution of the quality results of forage samples submitted to SWFAL under the crop code 11 (Rye Grass) from January 2019–June 2024.
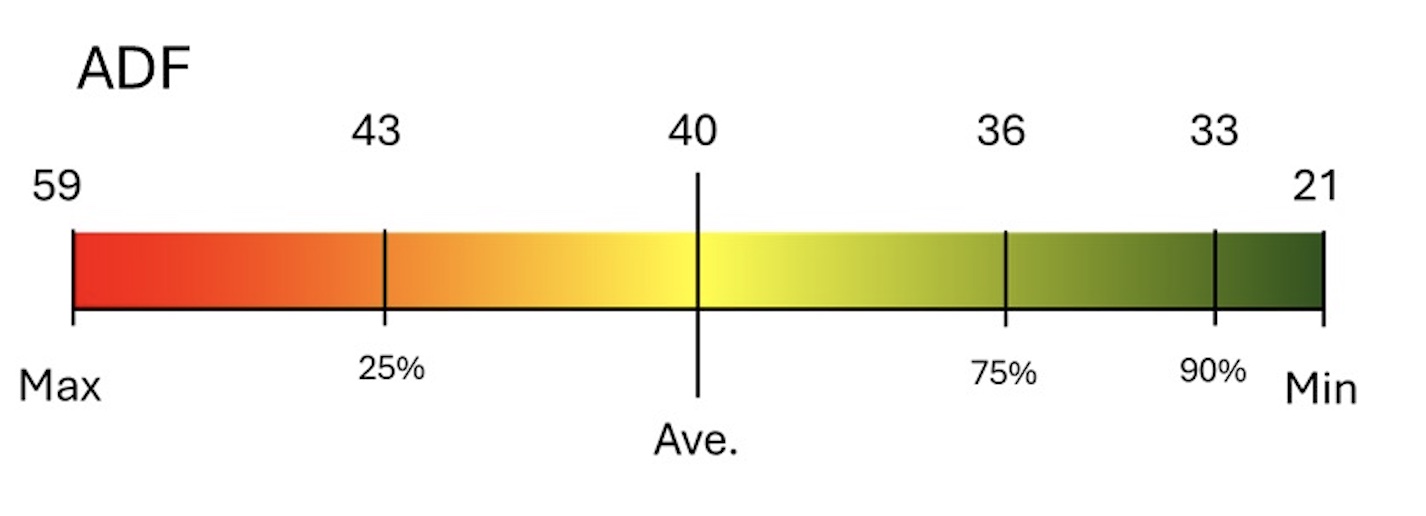
Figure 3b. ADF distribution of the quality results of forage samples submitted to SWFAL under the crop code 11 (Rye Grass) from January 2019–June 2024.
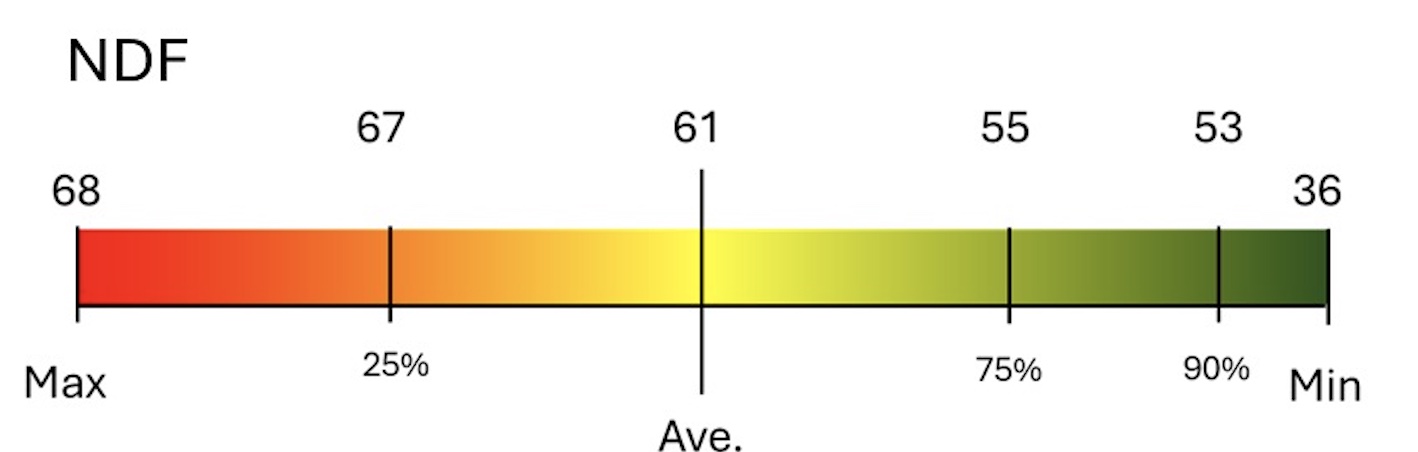
Figure 3c. NDF distribution of the quality results of forage samples submitted to SWFAL under the crop code 11 (Rye Grass) from January 2019–June 2024.
Table 1. Full data of the distribution analysis of the quality results of forage samples submitted to SWFAL under the crop codes 1 (Wheat), 9 (Fescue and Cool Season Grasses) and 11 (Rye Grass) from January 2019 to June 2024. n = the number of observations. The % (5, 10, 25, 75, 90 and 95) is the value at which x % of samples fall below. For example, 95% of the rye grass protein results were below 9.7%.
| Crop Code Analysis |
1-Wheat Protein % |
1-Wheat ADF |
1-Wheat NDF |
9- Fescue/ Cool Season Protein % |
9- Fescue/ Cool Season ADF |
9- Fescue/ Cool Season NDF |
11- Rye Grass Protein % |
11- Rye Grass ADF |
11- Rye Grass NDF |
|---|---|---|---|---|---|---|---|---|---|
| n | 2154 | 1358 | 137 | 198 | 162 | 6 | 358 | 317 | 34 |
| Average | 11.3 | 35.6 | 58.0 | 10.9 | 38.3 | 58.9 | 9.7 | 39.4 | 61.1 |
| Minimum | 1,1 | 15.5 | 38.7 | 4.8 | 26.3 | 51.0 | 3.4 | 21.2 | 35.9 |
| Maximum | 32.2 | 56.6 | 71.6 | 27.0 | 53.7 | 66.7 | 17.4 | 59.4 | 72.6 |
| 95 | 21.2 | 46.5 | 70.0 | 18.7 | 44.4 | 14.6 | 49.2 | 72.0 | |
| 90 | 18.8 | 44.4 | 68.6 | 16.2 | 43.0 | 13.5 | 46.5 | 69.8 | |
| 75 | 13.9 | 40.4 | 64.1 | 12.4 | 40.9 | 11.5 | 42.6 | 66.9 | |
| 25 | 7.9 | 32.0 | 51.9 | 8.4 | 35.9 | 7.8 | 35.8 | 55.0 | |
| 10 | 6.1 | 25.5 | 44.9 | 6.9 | 34.7 | 6.3 | 32.8 | 53.3 | |
| 5 | 5.1 | 22.4 | 43.1 | 6.4 | 32.0 | 5.6 | 31.4 | 44.8 | |
Related Fact Sheets
- PSS-2117 Forage Quality Interpretations
- PSS-2589 Collecting Forage Samples for Analysis
- E-1021 Oklahoma Forage and Pasture Fertility Guide
- PSS-2588 Evaluating Hay Quality Based on Sight, Smell and Feel – Hay Judging