Agribusiness Management Series: Oklahoma Wheat Stocker Graze Out Decision Aid
The Oklahoma Wheat Stocker Graze Out Decision Aid was developed to assist wheat stocker producers project the economically optimal date to cease grazing of winter wheat. Using user-supplied data, the program projects returns from grazing stocker calves through various dates including post first hollow stem. The program is a joint project of the Departments of Agricultural Economics and Animal Science at Oklahoma State University. The program can be downloaded from:OSU Department of Agricultural Economics (Author: DeVuyst; Type: Spreadsheet).
If you are interested in a model to help decided if you should purchase stockers, see the Oklahoma Wheat Stocker Budget Generator or the Oklahoma Wheat Stocker Purchase Planner Decision.
This software is programmed in MS Excel 2007. Substantial loss of functionality, run-time errors and calculation errors will likely occur if it is run in MS Excel 2003 or earlier versions of Excel. So, its use in MS Excel 2003 or previous versions is not recommended. For the program to function properly, the user must allow the macro features of MS Excel. In MS Excel 2007, the user is prompted with a warning just below the button bar that macros have been disabled. Click on the warning and enable macros.
If you have received a copy of this program from another user, it is recommended that you download a current version (free) from the address below to be sure you have the most up-to-date version. To download a free copy of the program see: Wheat Stocker Decision Aid.
Data input
Only cells with a yellow background and black text are changeable. All other cells are calculated automatically by the program, are not accessible to the user and have a light blue or green background.
The program has four sections accessed by the tabs at the bottom of the screen. The tabs are labeled Producer info, Cattle info, Wheat info, and Results. Another tab “Cost of gain” can be accessed through a macro on the “Cattle info” tab.
Producer Info Tab
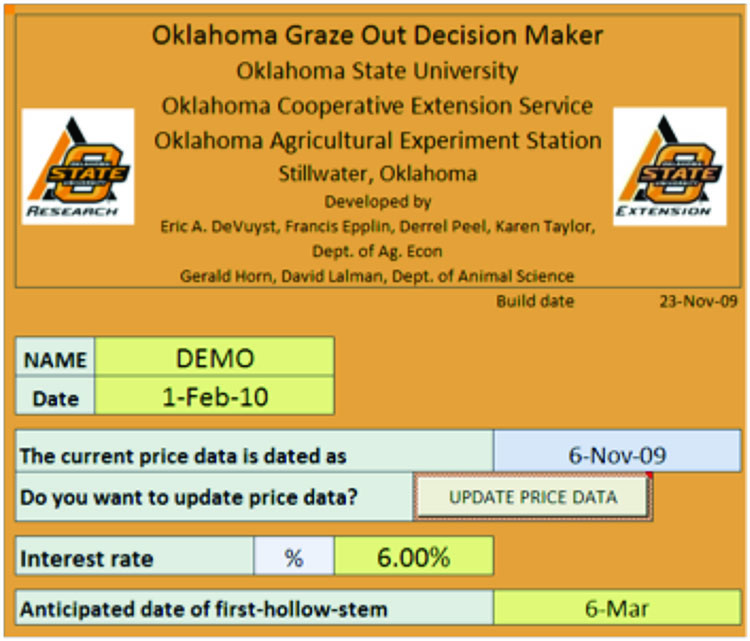
The first section (see Table 1) allows the user to enter a scenario name (“DEMO”) in the table below and the date of the scenario.
Oklahoma Graze Out Decision Maker
The program utilizes a price data set to forecast returns. These prices are hidden to the user, but can be updated with a few clicks of the mouse. To update prices, first connect to the internet. Then open the spreadsheet. Click on “UPDATE PRICE DATA.” If asked if you want to proceed, click “OK.” Note, if your internet connection is slow, this may take several minutes. The screen may flash several times as files and tabs are opened and closed.
Next enter an operating note interest rate and the expected date of the first hollow stem.
Table 1. “Producer info” tab.
Cattle Info Tab
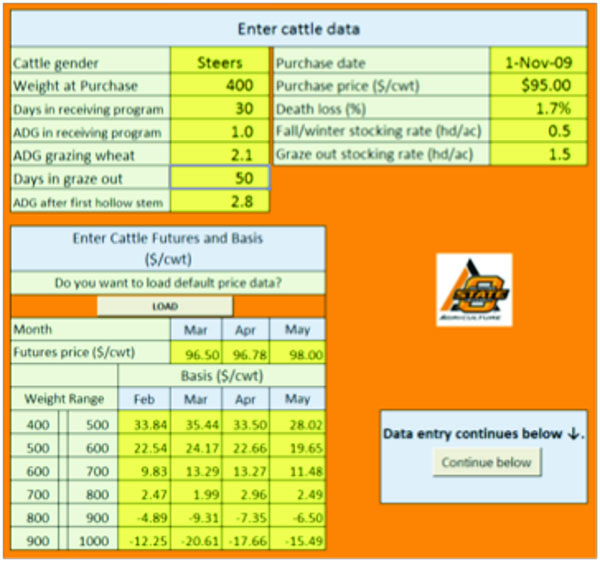
The top of the Cattle info requires the user to enter information regarding the gender of calves, weight at purchase and relevant production data, including average daily gain (ADG), days in receiving program, days grazing wheat, expected death loss, stocking rates before first hollow stem and stocking rate if during a graze out period. (See Table 2.)
The program can utilize downloaded price data (see Producer info tab) and basis to forecast sales price for calves. To utilize this feature, the user must first update prices, as described above, or enter his/her subjective price forecast in the middle of Cattle info table. The program utilizes a set of default basis values by month, weight and gender. The user can overwrite these defaults in the Futures and Basis section of the table. Note if calf prices are projected to be less than fed cattle futures, the fed cattle futures price is used as the calf sales price on the Results tab.
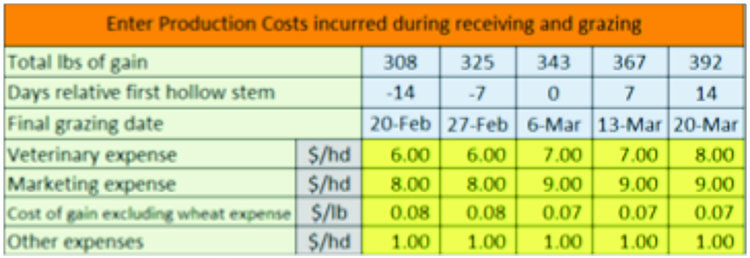
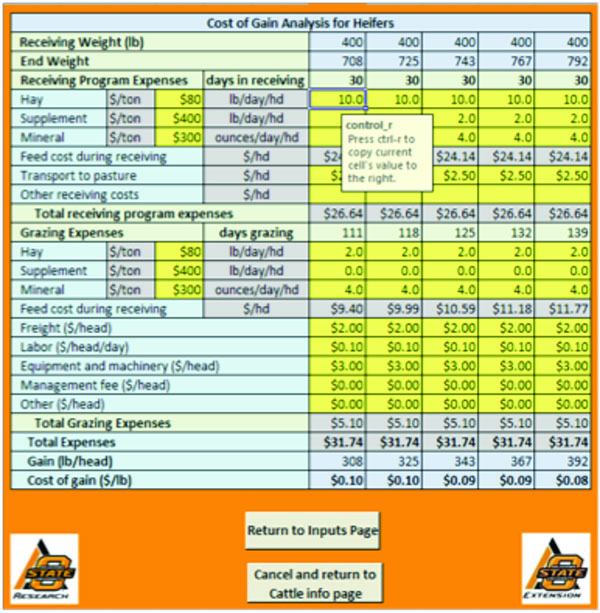
The bottom of the Cattle info tab requires information on production costs during grazing (see Table 3). A sub-table for cost of gain can be used by clicking on any yellow-shaded cell in the “Cost of gain excluding wheat exp” line. Then, press ctrl + t to view the cost of gain sub-table (see Table 4). After completing the cost of gain sub-table, click on “Return to inputs” to use the calculated costs of gains or press “Cancel and return to Cattle info page” to ignore the calculated values. Note, cost of gain does NOT include wheat rent. Wheat rent is entered on the Wheat info tab (see next section).
Table 2. Cattle info tab (top of page).
Table 3. Cattle info tab (bottom of page).
Table 4. Cost of gain sub-table.
Wheat Info Tab
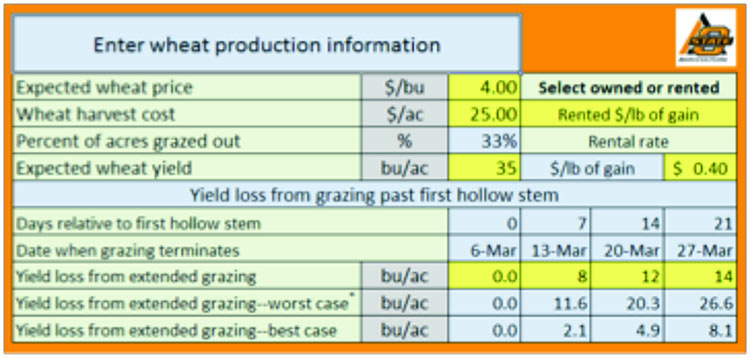
The Wheat info tab requires the user to enter expected wheat price ($/bu), expected wheat harvest cost ($/ac) and expected wheat yield if calves are removed prior to first hollow stem. If the wheat were to be grazed out, the percent of acres grazed out is entered.
Next, the user enters wheat tenure in cell H6. If wheat is owned, the user will be prompted to enter an opportunity cost for wheat grazing after first hollow stem. In other words, what rent ($/ac) would be received if the producer rented out wheat acres after first hollow stem? In most cases this will be $0 as few other producers would be willing to move cattle for only one to two weeks of grazing.
If wheat pasture is rented, the user is prompted to enter the rental terms, either $/cwt/month or $/lb of gain.
Finally, the producer enters yield loss associated with extended grazing. The program allows yield losses to be nonlinear in days after first hollow stem. In the example in table 5, the producer expects no loss if calves are removed at first hollow stem (March 6, in the example). If grazed until seven days past first hollow stem, the producer expects to lose 8 bu/ac. At 14 days, the program allows losses to increase. In the example, grazing through 14 days (or longer) past first hollow stem results in yield losses of 12 bu/ac. At 21 past first hollow stem, yield losses are 14 bu/ac in the example below. The table also provides some guidance on the range of yield losses from OSU field trials. The “worst case” and “best case” are derived from studies by Redmon et al. and Fieser et al. The program automatically calculates these values given the expected yield entered in the top of the table.
Table 5. Wheat info tab.
Table 6. Returns tab.
Results Tab
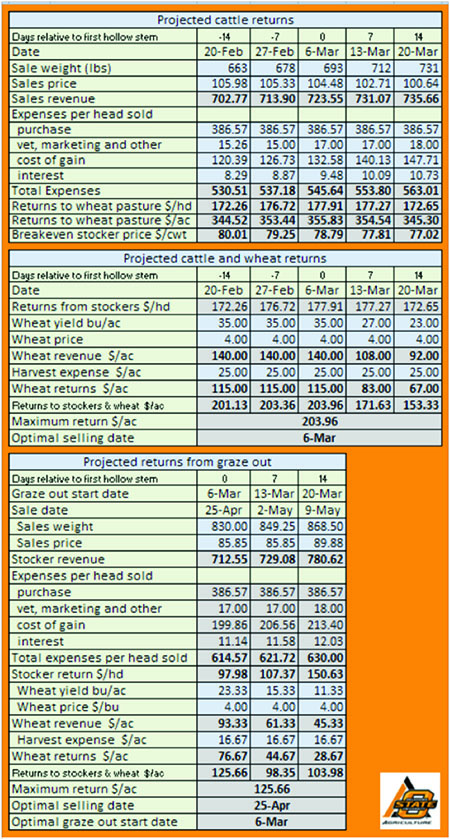
The Results page is divided into three sections. The top section computes the returns associated with the stocker calves.
Revenues and expenses are reported from the stockers for various grazing termination dates. Prices are calculated from the prices and basis entered on the Cattle info page. If prices seem unreasonable to you, change the basis on the Cattle info page to reflect local market prices. Cost of gains includes either rental cost or opportunity cost of wheat. Results for the stockers are reported in terms of $/ac, $/hd and breakeven stocker price $/cwt.
The middle section of the Results page compiles returns for wheat plus wheat stockers. Returns ($/ac) are reported for grazing termination dates in weekly intervals around first hollow stem. The program computes the maximum expected return and the associated grazing termination date.
The bottom of the Results page reports the returns from wheat and stocker associated with extended grazing. Graze out (intensive grazing) is assumed to start within two weeks of first hollow stem. (The user can specify the length of the graze out period on the Cattle info tab.) Returns to stockers are reported in weekly intervals. The maximum return and associated sale date are reported.
The maximum returns to wheat and stockers and the maximum returns from graze out serve to guide the graze out decision. If returns from graze out are significantly higher, the user should consider a graze out strategy. However, strategies should be considered to manage adverse price movement during the graze out period. Forward contracts, futures and options or price insurance might be advisable.
Alternative Scenarios
The program allows users to rapidly change assumptions (e.g., ADG, death loss, sale price) and determine the consequences. If you want to retain a given scenario, use the save option under the Excel menu. Using descriptive file names can be helpful in recalling the alternative assumptions in each scenario. If you save over the original version of this program, you can download another version at Wheat Stocker Decision Aid. Updated versions of this program will also be available at that link.
References:
Fieser, B.G., G.W. Horn, J.T. Edwards, and E.G. Krenzer, Jr. “Time of grazing termination in Dual-Purpose Winter Wheat Enterprises,” The Professional Animal Scientist 22 (2006):210-216.
Redmon, L.A., E.G. Krenzer, Jr., D.J. Bernardo, and G.W. Horn. “Effect of wheat morphological stage at grazing termination on economic return,” Agronomy Journal 88 (1996):94-97.
For more information contact:
Eric DeVuyst, Oklahoma State University, 530 Ag. Hall, Stillwater, OK 74078-6026. 405-744-6166. eric.devuyst@okstate.edu.
Eric A. DeVuyst
Associate Professor
Farm Management and Production Management
Francis Epplin
Professor, Agricultural Business and Commercial Agriculture
Derrell Peel
Professor, Livestock Marketing
Karen Taylor
Vice President, Farm Credit Canada
Gerald Horn
Professor, Beef Cattle Nutrition and Management
David Lalman
Professor, Beef Cattle

