Wildfires in Oklahoma
Fire is a naturally occurring process in all of the native ecosystems throughout Oklahoma and a recent study found that 74 percent of the residents of our state believe fire is necessary to manage the land1, but don’t want fire in their backyard. Oklahoma does experience frequent wildfires, with 3,519 wildfires burning around 70,000 acres in 2007 and 5,572 wildfires burning more than 196,000 acres across the state in 20082. It is interesting to note that while wildfires get almost all of the publicity, there are more than 1,000,000 acres burned annually by Oklahoma landowners using prescribed fires to manage their land. From 2000 to 2007, more than 680,000 acres were burned by wildfires in the state. During the same time, more than 8,000,000 acres were burned by prescribed fires.
If unprepared, wildfire can become a threat to human life and personal property. During 2009, property damaged by wildfires in Oklahoma was estimated at nearly $30 million3. Suppression of these wildfires also cost the state taxpayers millions of dollars each year. For example, in 2011, it was estimated that it cost around $5 million to extinguish a single wildfire that burned around 40,000 acres in southwestern Oklahoma. In the United States, the federal government spends billions of dollars each year to suppress wildfires. In 2002 and 2006, the USDA-Forest Service spent more than $1.6 billion each year on suppression of wildfires throughout the United States. In 2007, they broke previous records by spending $1.8 billion, and these costs have continued to increase annually4,5.
With the increase in the number of wildfires and acres burned, it is becoming more important to understand what conditions present the highest fire danger in order to prevent the loss of life and property. We also need to equip our planners and fire fighting professionals with the latest information. It is also essential to understand how the different seasons of the year impact wildfires in Oklahoma. With this information, basic guidelines can be established for fire management professionals to determine wildfire danger, as well as guide state and local officials in the implementation of burn bans.
Wildfire Information
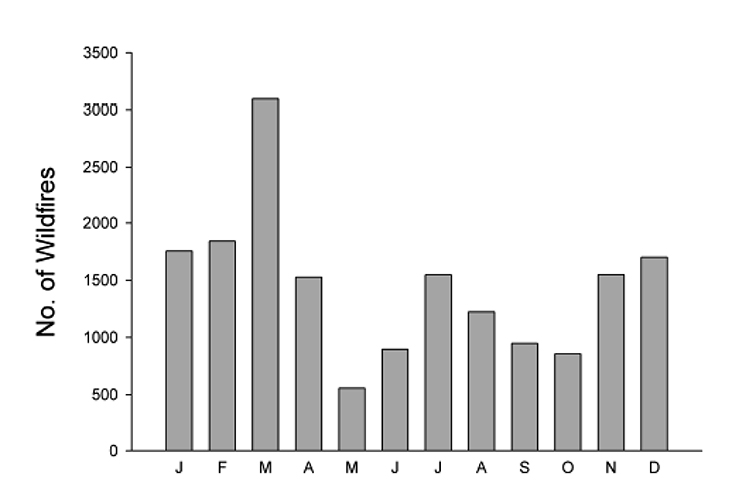
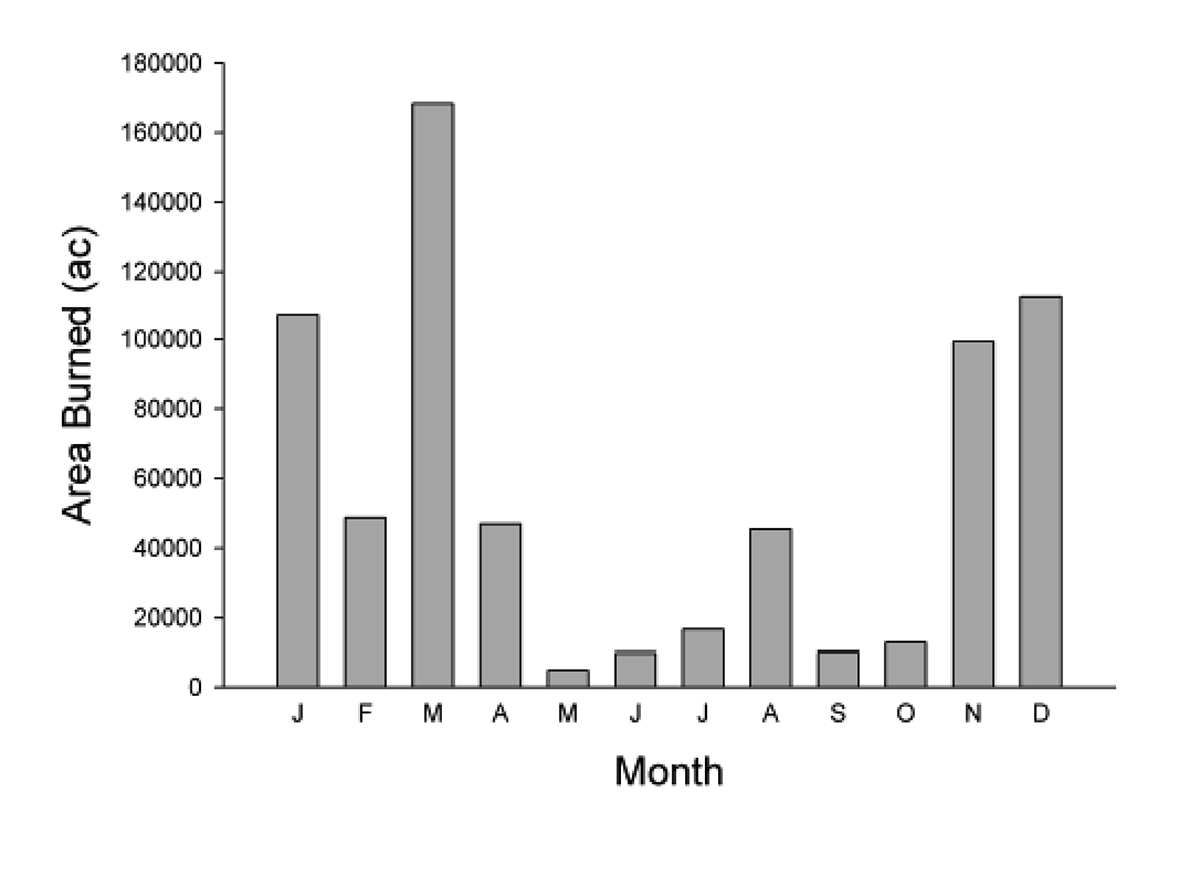
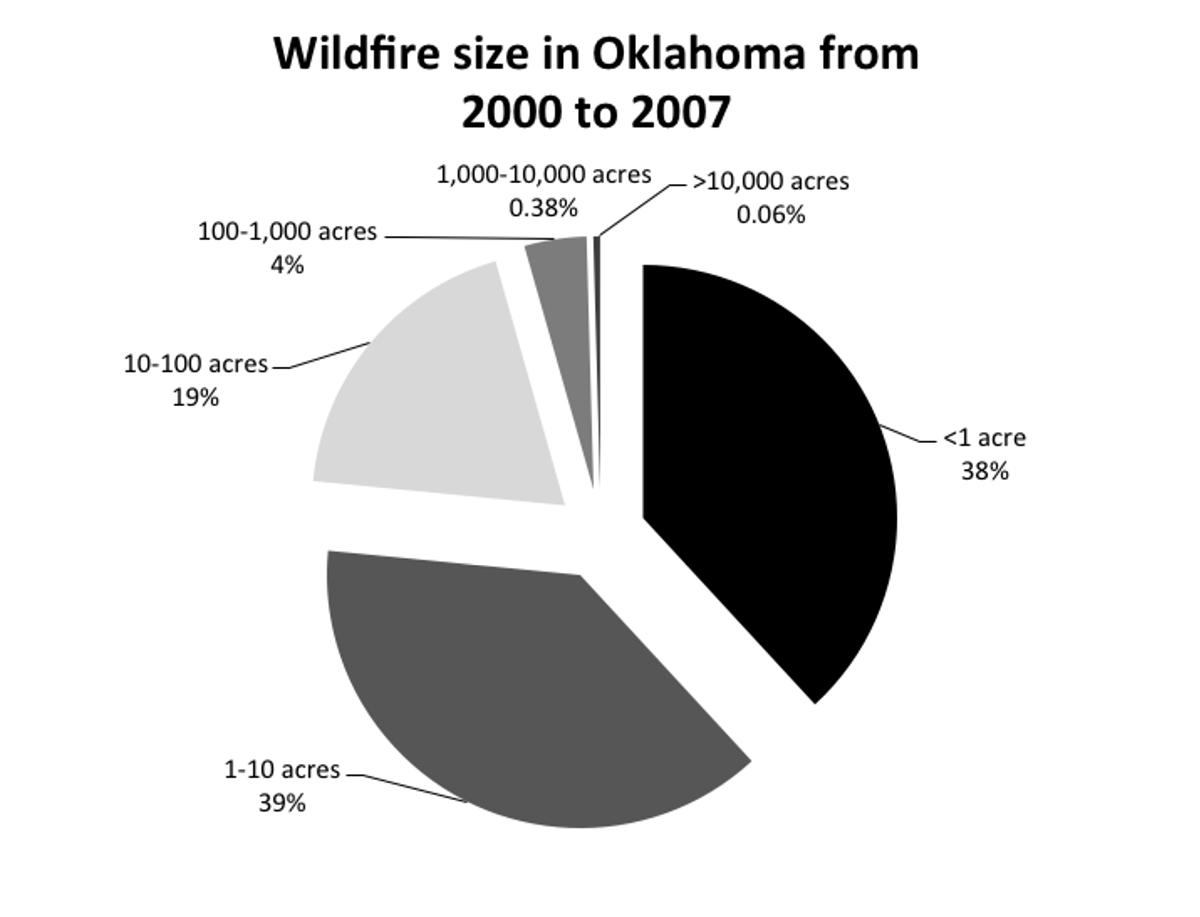
Information from the state fire marshal’s office showed there were 17,499 wildfires reported from 2000 to 2007 in Oklahoma 6. During this time, the number of wildfires averaged 1,458 per month, but ranged from 3,099 in March to 556 in May (Figure 1). March also had the highest number of fires, except for those >10,000 acres, which was the highest in January and December. The average area burned per month was 56,955 acres with a total area of 683,455 acres burned during the eight years of available wildfire information. Acres burned per month was also comparable to the number of wildfires per month, with March having the highest total area burned, 168,336 acres, and May the least, 4,790 acres (Figure 2). The most notable difference between the number of wildfires and area burned is that throughout the summer, though there are a large number of wildfires, the actual area burned by these fires is quite small. From the 17,499 reported wildfires, 77 percent were less than 10 acres in size, while the larger wildfires (more than 1,000 acres) which receive most of the publicity made up less than a half of one percent (0.44 percent) of the total number of fires (Figure 3).
Figure 1. The number of wildfires that occurred by month in Oklahoma from 2000-2007. During this time, the number of wildfires averaged 1,458 per month, but ranged from 3,099 in March to 556 in May.6
Figure 2. The total area burned by month by wildfire in Oklahoma from 2000-2007. Area burned per month was also comparable to the number of wildfires per month, with March having the highest total area burned, 168,336 acres, and May the least, 4,790 acres.6
Figure 3. The percentage of wildfires by size from 2000 to 2007. From the 17,499 reported wildfires, 77 percent were less than 10 acres in size, while the larger wildfires (more than 1,000 acres) which receive most of the publicity made up less than a half of one percent (0.44 percent) of the total number of fires.
Weather Factors that Impact Wildfires
The majority of wildfires in Oklahoma occur in late fall, through winter and into early spring, which coincides with dormant vegetation and the time of year the state receives the least amount of precipitation7 (Figure 1). The number of wildfires declines during mid-spring when vegetation begins to green up, with an additional peak in wildfire activity occurring in July and August before again declining into the fall. Most wildfire activity in the state occurs when fine fuels are dormant and at their driest due to lower precipiation7. This pattern is normally consistent unless there is some type of extreme weather event, such as a drought.
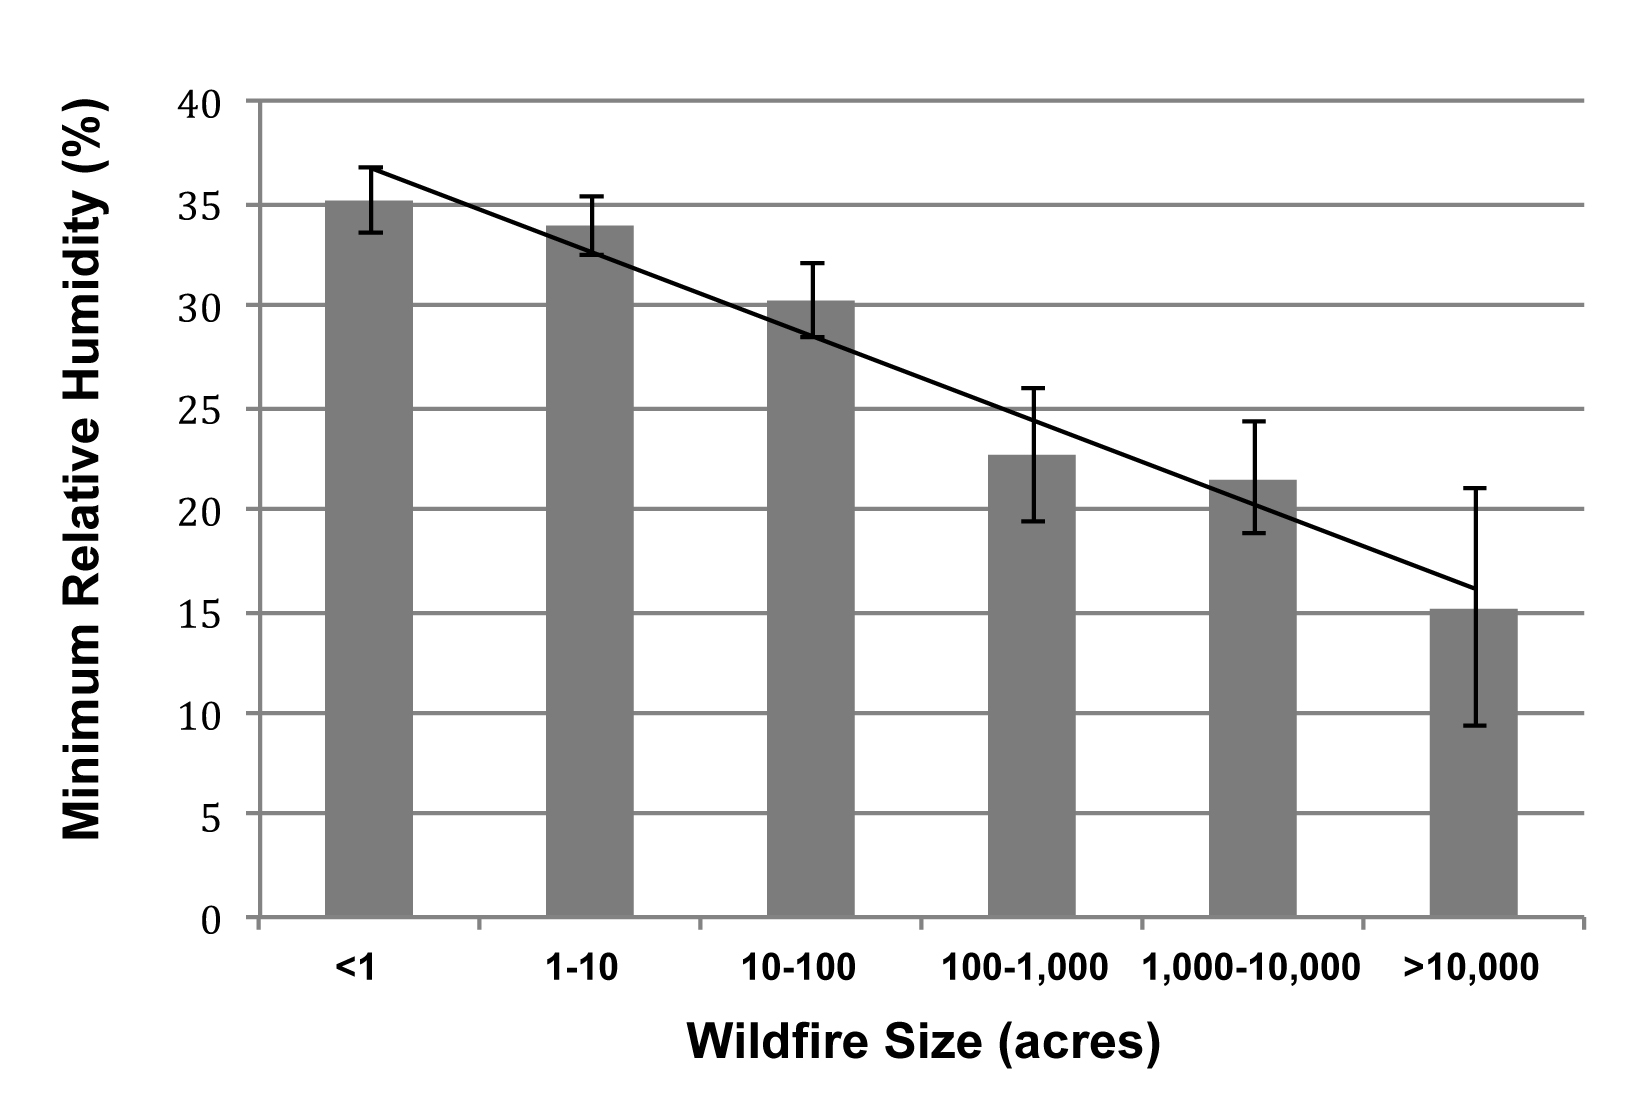
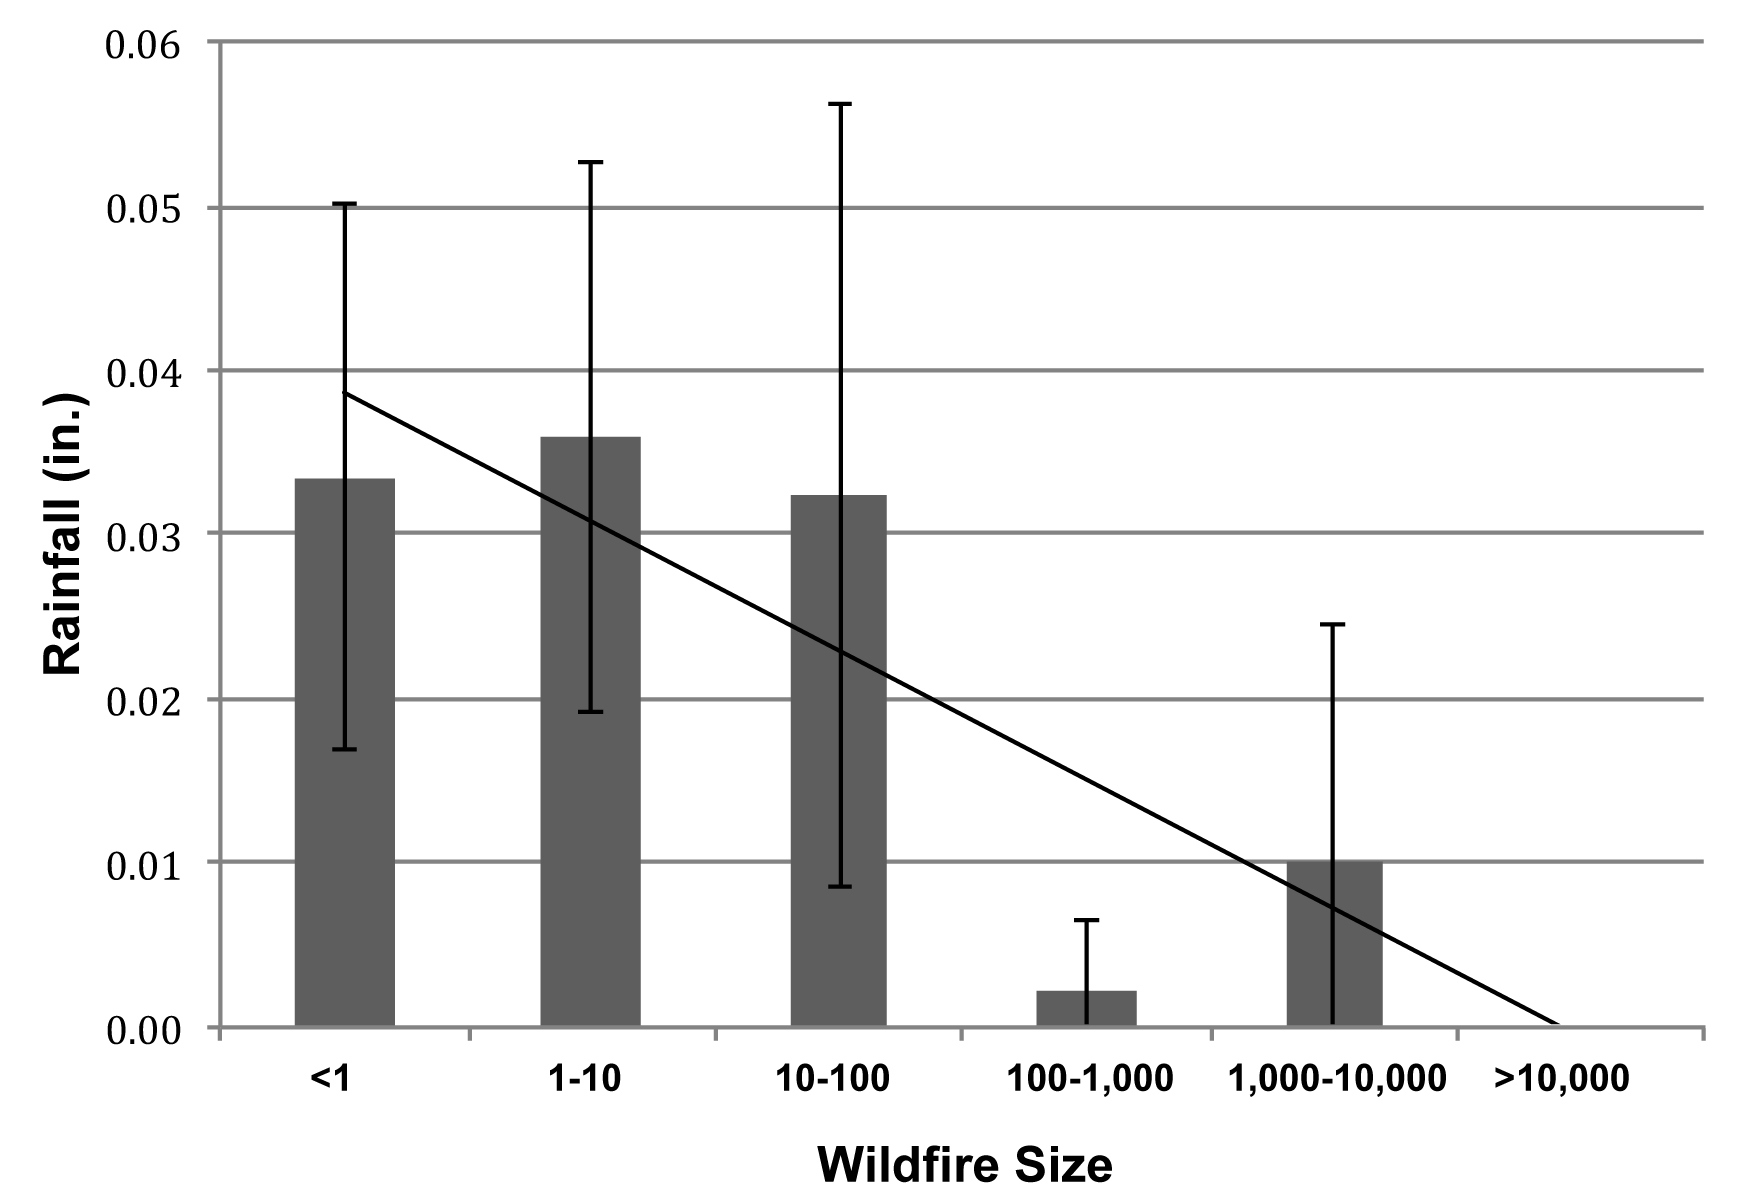
Wildfires can occur under a wide variety of weather conditions during any month of the year, but the size of the fire is found to be significantly related to relative humidity, rainfall, and wind speed6. It is interesting to note that many times temperature is referenced as an indicator of high wildfire danger, but in this case it was not found to be significantly related to wildfire size. Relative humidity relates negatively with wildfire size, with minimum relative humidity having the strongest relationship with wildfire size (Figure 4). It was found that the lower the minimum relative humidity, the more area burned. Wildfires smaller than 1 acre in size occurred under conditions with a minimum relative humidity ranging from 10 percent to 90 percent with an average of 35 percent, while fires > 10,000 acres in size had a range of 8 percent to 39 percent and an average relative humidity of 15 percent. Though 100 percent relative humidity was rarely recorded for any of the fires, negligible amounts of precipitation sometimes occurred the day of the wildfire, but never reached an average of more than 0.04 inches for any size fire. It should be noted that there was no precipitation recorded for fires more than 10,000 acres. Though variation within and across wildfire size is high, even a slight amount rainfall on the day of wildfire has a significant negative relationship with fire size (Figure 5).
Figure 4. Relative humidity relates negatively with wildfire size. Between the three relative humidity variables, minimum relative humidity has the strongest relationship with wildfire size. We found that the lower the minimum relative humidity the more area the wildfire burned.6
Figure 5. Variation within and across wildfire categories is high, even a slight amount rainfall on the day of wildfire has a significant negative relationship with fire size.6
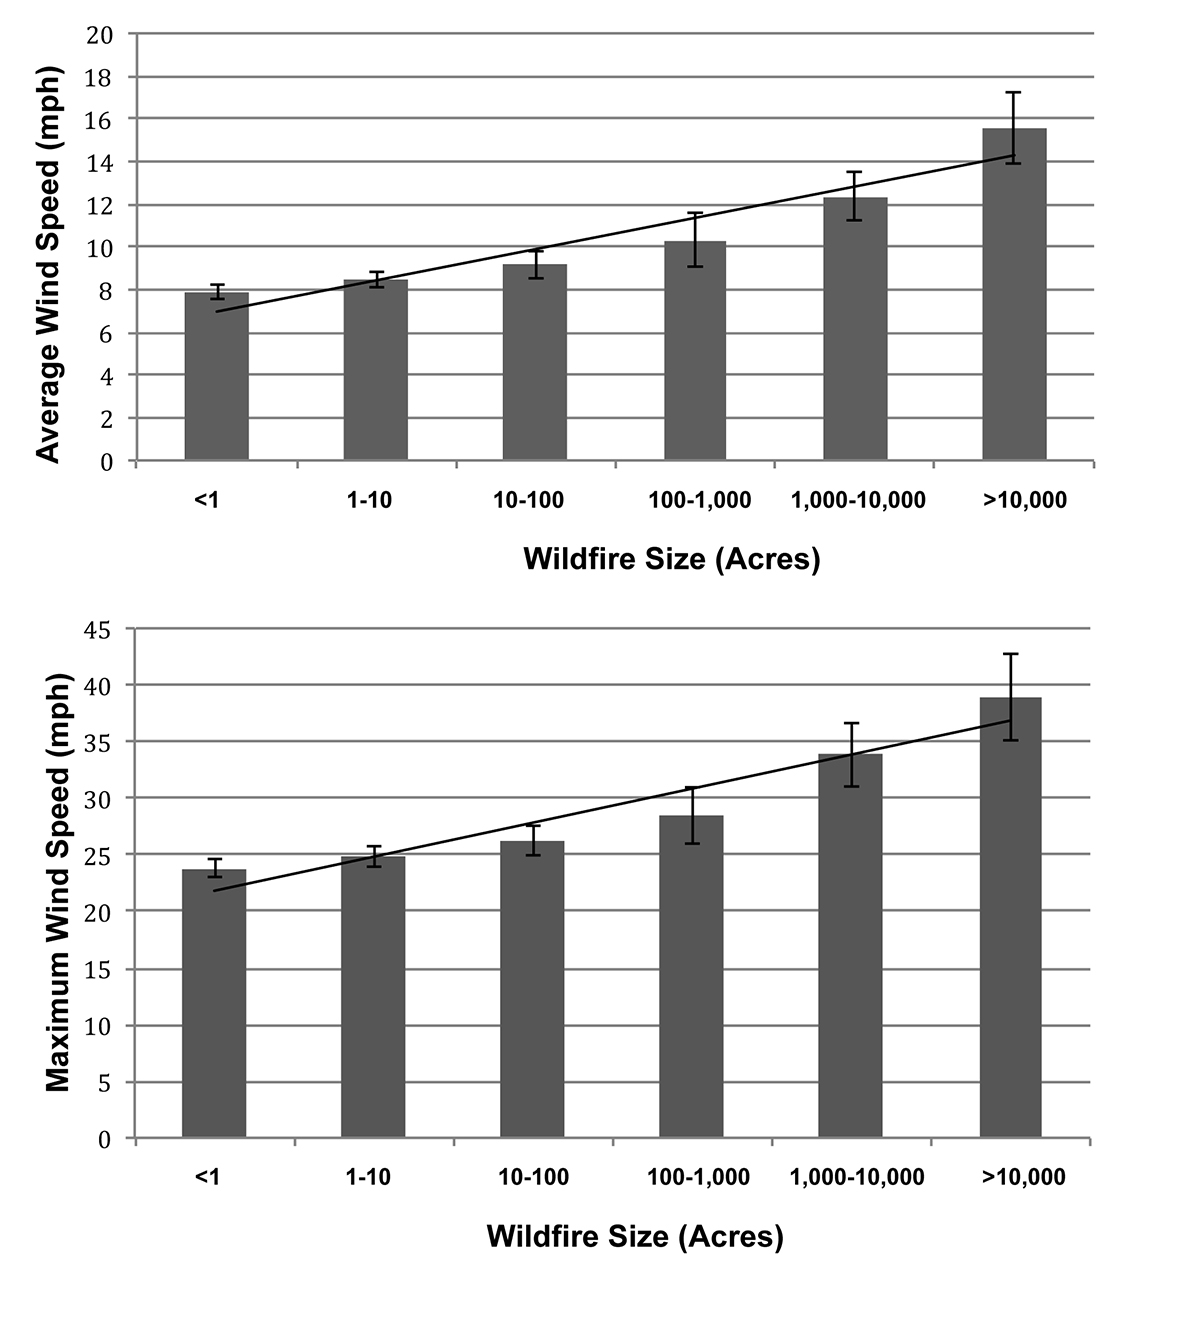
Average and maximum wind speed have strong positive relationships with wildfire size (Figure 6). As both average and maximum wind speed increase, so does the size of a wildfire. The large wildfire sizes were associated with higher average and maximum wind speeds. The smallest fires occurred during periods of low wind speeds; fires less than 1 acre in size had an average of 7.9 mph wind speeds while fires more than 10,000 acres had an average approximately double that, 15.6 mph. Maximum wind speeds varied from 23.7 mph to 38.9 mph on average for the smallest and largest fire sizes, respectively. It was found that maximum wind speed and minimum relative humidity are the two weather variables that correlate most strongly with wildfire size6.
Figure 6. Average and maximum wind speed both have strong positive relationships with wildfire size. As both average and maximum wind speed increase, so does size of wildfire.
Application of Findings
Weather conditions are some of the best predictors to determine present and forecasted wildfire danger. But by also looking at the past wildfire weather data for Oklahoma, it is possible to identify the strongest relationships between specific weather variables and wildfire size so emergency personnel can be prepared for those events. Our research shows that high wind speeds are the main factor to consider for high fire danger6. Higher wind speeds dry out fuels and increases the rate of fire spread, along with increasing spot fire potential, which in turn creates conditions favorable for large wildfires8.
The impact of wind can be seen in the March wildfire data. March is one of Oklahoma’s windiest months7 and it has the greatest number of wildfires, along with the largest number of acres burned. On the other hand, March cannot be placed in a permanent burn ban, because it is the main month for land managers in the state to conduct prescribed burns, and more than half the days during that month can be suitable for conducting prescribed burns9.
Moisture through precipitation and relative humidity is the second most important factor in the distribution and size of wildfires. Most of the large wildfire events (more than 1,000 acres) in our state, occur in December and January6, which coincides with dormant vegetation and periods with the lowest precipitation and relative humidity7. By examining the month of May in previous graphs we can see how moisture impacts wildfire. May has the highest average precipitation across 90 percent of the state7 and has the fewest number of wildfires with the least amount of area burned. The least amount of wildfires and lowest total area burned in the state occurs between May and October (Figures 1 and 2). These months coincide with when the state receives 62 percent of its annual precipitation7 and when most vegetation is green and actively growing. All these factors help reduce flammability of fuels and the occurrence of wildfires.
These findings demonstrate the relationship between relative humidity, wind speed, and season of year to provide a model to predict wildfire danger. This information is important for fire management personnel to understand so that they can be better prepared to address wildfires in our state. Also this information should assist decision makers on issuing burn bans.
It also important for homeowners and landowners to be prepared before a wildfire occurs in their area. Homeowners should consult the Oklahoma Forestry Services website (http://www.forestry.ok.gov/howtoprotectyourhome) for information about protecting homes and communities from the impacts of wildfires. The vegetation in Oklahoma is adapted to fire and it will burn no matter what we do to try and stop it. Research from all across the nation has shown over and over again that the more we restrict the safe and controlled use of fire, the larger and more devastating wildfires become. It is important to continue to promote the use of prescribed fire and continue to educate everyone on its importance.
Worst Day for Wildfires
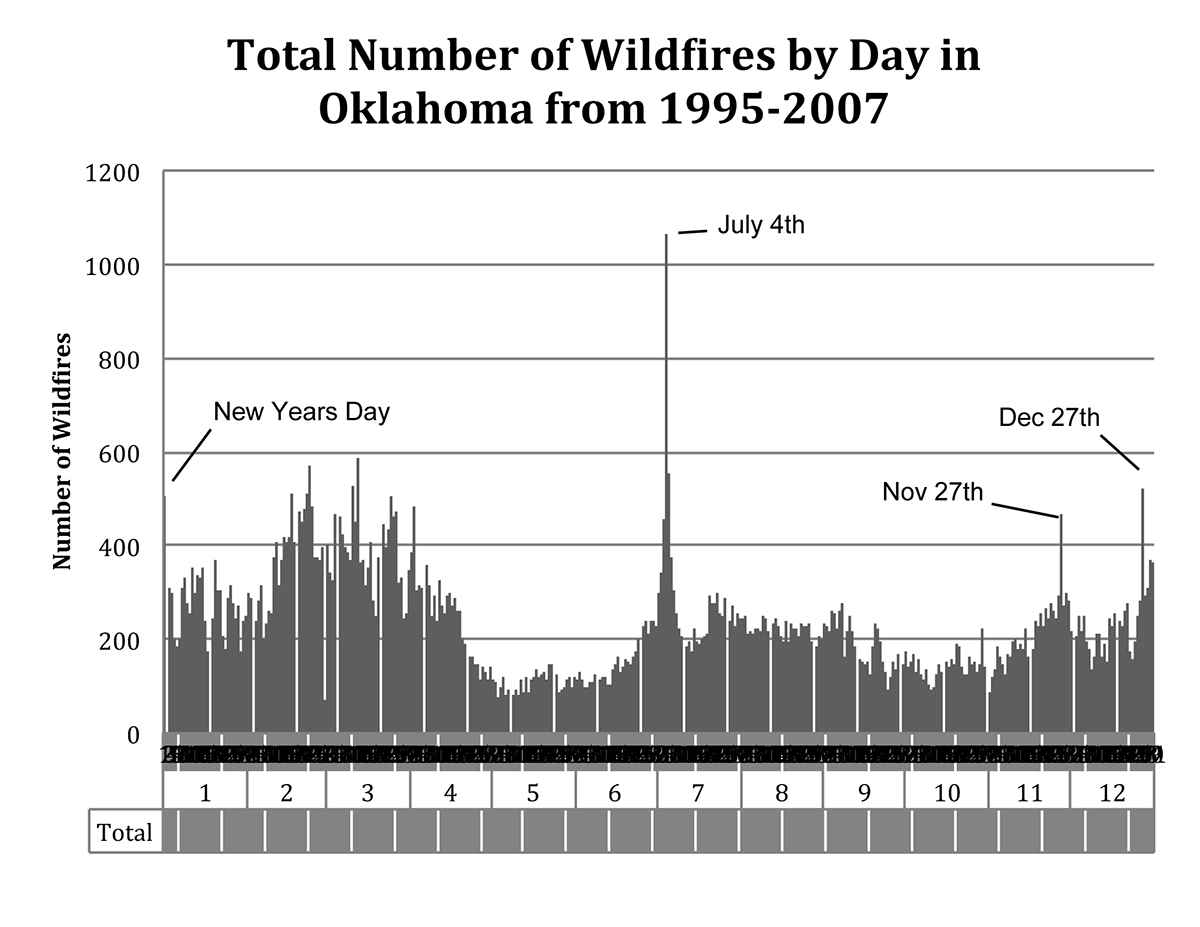
Figure 7. The total number of wildfires by day in Oklahoma from 1995-2007. Note the number of fires that occur on July Fourth and on or near other holidays (Thanksgiving, Christmas, and New Years).
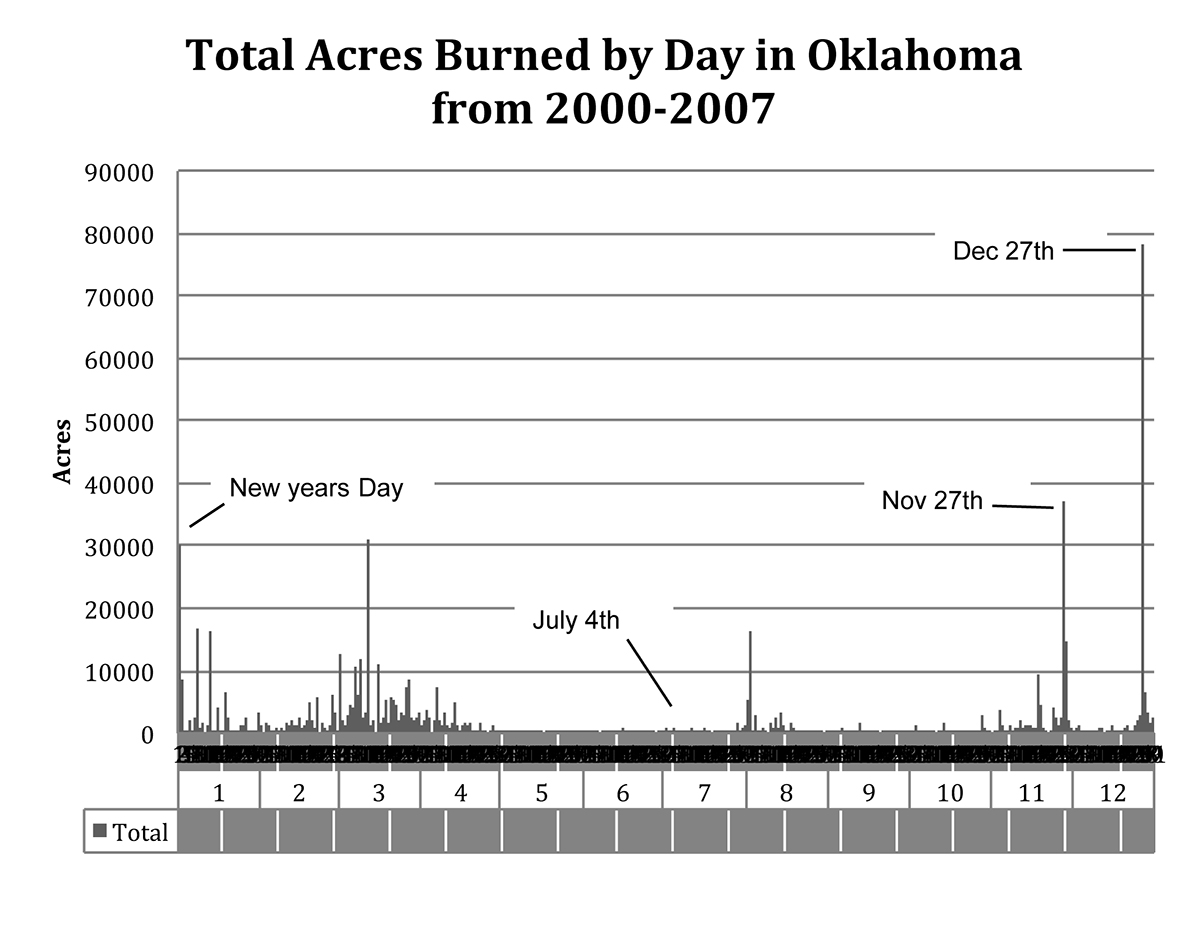
Figure 8. The total acres burned by day in Oklahoma from 2000-2007. Notice that July Fourth is not even visible on total acres burned. Three of the top four days with the most acreage burned are on or near other major holidays (New Years, Thanksgiving, and Christmas) and occur during the period when vegetation is dormant and more flammable.
There are specific days that most wildfires occur on in our state. By far the Fourth of July holiday had the highest number of wildfires reported from 1995 to 2007 (Figure 7), but an extremely low amount of acreage burned, due to time of year and green vegetation (Figure 8). It is also fascinating to find that from 1995 to 2007 some of the highest number of wildfires and acres burned per day occurred on or near a major holiday (New Years Day, Thanksgiving, and Christmas), probably due to more people being home and when dormant vegetation is more flammable.
Bibliography
1 Elmore, R.D., T.G. Bidwell, and J.R. Weir. 2009. Perceptions of Oklahoma residents to prescribed fire. Pages 000–000 in K.M.Robertson, K.E.M. Galley, and R.E. Masters (eds.). Proceedings of the 24th Tall Timbers Fire Ecology Conference: The Future of Prescribed Fire: Public Awareness, Health, and Safety. Tall Timbers Research Station, Tallahassee, Florida, USA.
2 National Interagency Fire Center. Undated. Available at: http://www.nifc.gov/index.html. Accessed 28 April 2009.
3 Oklahoma wildfire damage estimates increased to $30M. April 20, 2009. Available at http://www.insurancejournal.com/news/southcentral/2009/04/20/99765.htm
4 Strategic Issues Panel on Fire Suppression Costs. 2004. Large fire suppression costs: Strategies for cost management. Available at: http://www.forestsandrangelands.gov/reports/ documents/2004/costmanagement.pdf. Accessed 24 March 2009.
5Ingalsbee, T. 2010. Getting burned: A taxpayers guide to wildfire suppression costs. Fusee.org, Eugene, OR. 43 p.
6 Reid, A.M., S.D. Fuhlendorf, and J.R. Weir. 2010. Weather variables affecting Oklahoma wildfires. Rangeland Ecology and Management 63:599-603.
7 Arndt, Derek. 2005. Oklahoma Climatological Survey. Available at: http://climate.mesonet.org/ county_climate/Products/County%20Climate%20Information%20Homepage.html. Accessed 21 October 2009.
8 Whelan, R.J. 1995. The Ecology of Fire. Cambridge University Press, Cambridge, England.
9 Weir, J.R. 2011. Are weather and tradition reducing our ability to conduct prescribed burns? Rangelands 33:25-30.
John R. Weir
Research Associate, Natural Resource Ecology and Management
Angela M. Reid
Fire Ecology Specialist, Tall Timbers Research Station and Land Conservancy,Tallahassee, FL
Sam D. Fuhlendorf
Professor, Natural Resource Ecology and Management

