The Importance of Sampling Depth for Soil Health Assessment
Introduction
Most soil health indicators, such as organic matter content, microbial activity, aggregate stability and biodiversity are dynamic properties that are typically biologically controlled. Currently, there are many efforts underway to understand these variables and how they might be used to assess soil health in the context of crop performance, environmental impact of soil management and compliance with conservation management plans. Consequently, there is a need to understand how sample collection might impact these parameters and how these parameters change as a function of management practices.
It is imperative to know the impact of sampling depth on these parameters and its perceived changes. Normally, soil samples are collected to the tillage depth (typically 6 inches) for routine soil analysis of nutrients and pH. Furthermore, the soil test calibration and nutrient and lime recommendations for the management of these chemical/fertility characteristics have been based on samples collected from a 6-inch depth. However, recent efforts have provided improvements in recommendations for characteristics such as pH in no-till systems. Current efforts also are being made to better understand the stratification of nutrients such as phosphorus and how it impacts critical threshold concentrations and crop response to added phosphorus fertilizers. Despite the vertical variations, many still assume that a 6-inch sample is needed for soil health assessment. The 6-inch depth sampling approach may be okay if the goal is to simply compare to conventionally tilled systems. However, if evaluating changes in no-till systems based on time in no-till or crop rotation, a different sampling depth is warranted.
Field Study Description
In 2005, a study of cropping systems was initiated. Various alternative crop rotations were compared under tilled and no-till management. The tilled treatments were then converted to no-till in 2013. Therefore, the entire study area consists of plots with different ages of no-till history since 2013. The maintenance of these plots under continuous no-till allows comparison of soil characteristics and crop performance on soil that had been in no-till management for different amounts of time. In April 2015, soil samples were collected at 0 to 2 inches, 2 to 4 inches and 4 to 6 inches from plots in soybeans the prior year. Another set of samples were collected in August 2015 from a different set of plots where wheat was harvested in June 2015. These samples can not be used to compare cropping history effects on soil health indicators, but they provide an opportunity to evaluate the impact of time in no-till (three years versus 10 years) on soil health indicators.
Soil Stratification Data
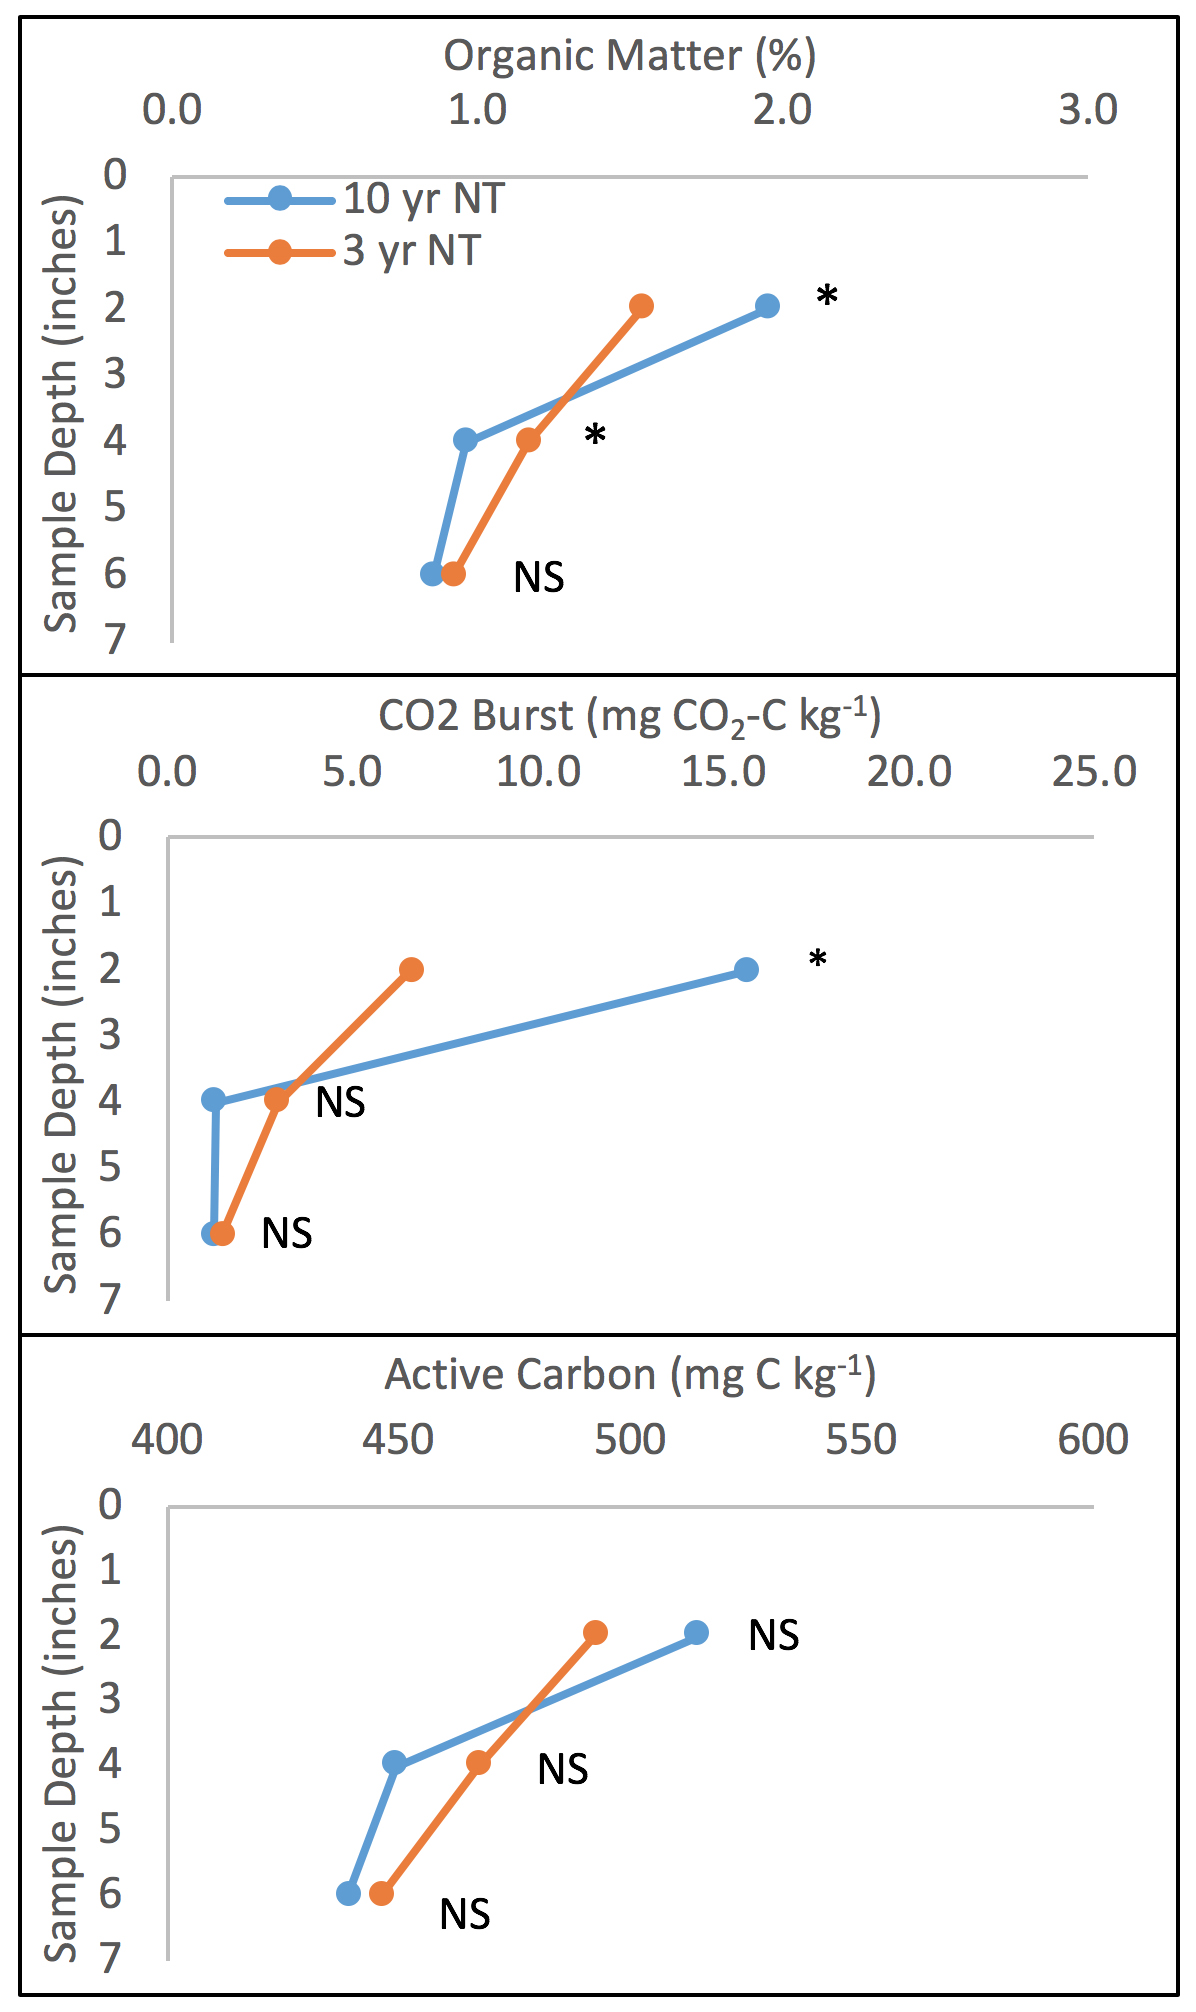
Samples collected in April 2015 were analyzed for organic matter as well as two less commonly used new analyses: CO2-burst and active carbon. The CO2-burst is a measurement of general microbial activity. The active carbon protocol used was meant to quantify the organic carbon that is easily available for use by microbes in the soil. The distributions of those parameters within soil depth are shown in Figure 1. The stratification of the organic matter, CO2-burst and active carbon is obvious. The variables in the 0 to 2-inch depth from the 10-year no-till plots were much higher than those in the 2- to 4-inch and 4- to 6-inch depths. The surface soil samples of the three-year no-till plots also showed higher amounts of the three analytes than those of subsurface soils, but the difference was not as high as the 10-year no-till plots. This suggests that the longer a soil is under no-till, the more stratified these soil health indicators become with organic matter and CO2-burst being significantly higher in the older no-till soil at the 0 to 2 inches surface.
Figure 1. The distributions of soil organic matter, CO2-burst and active carbon by sampling depth in soil samples collected in April 2015 from the 10-year-old and 3-year-old no-till plots located at Lake Carl Blackwell west of Stillwater.
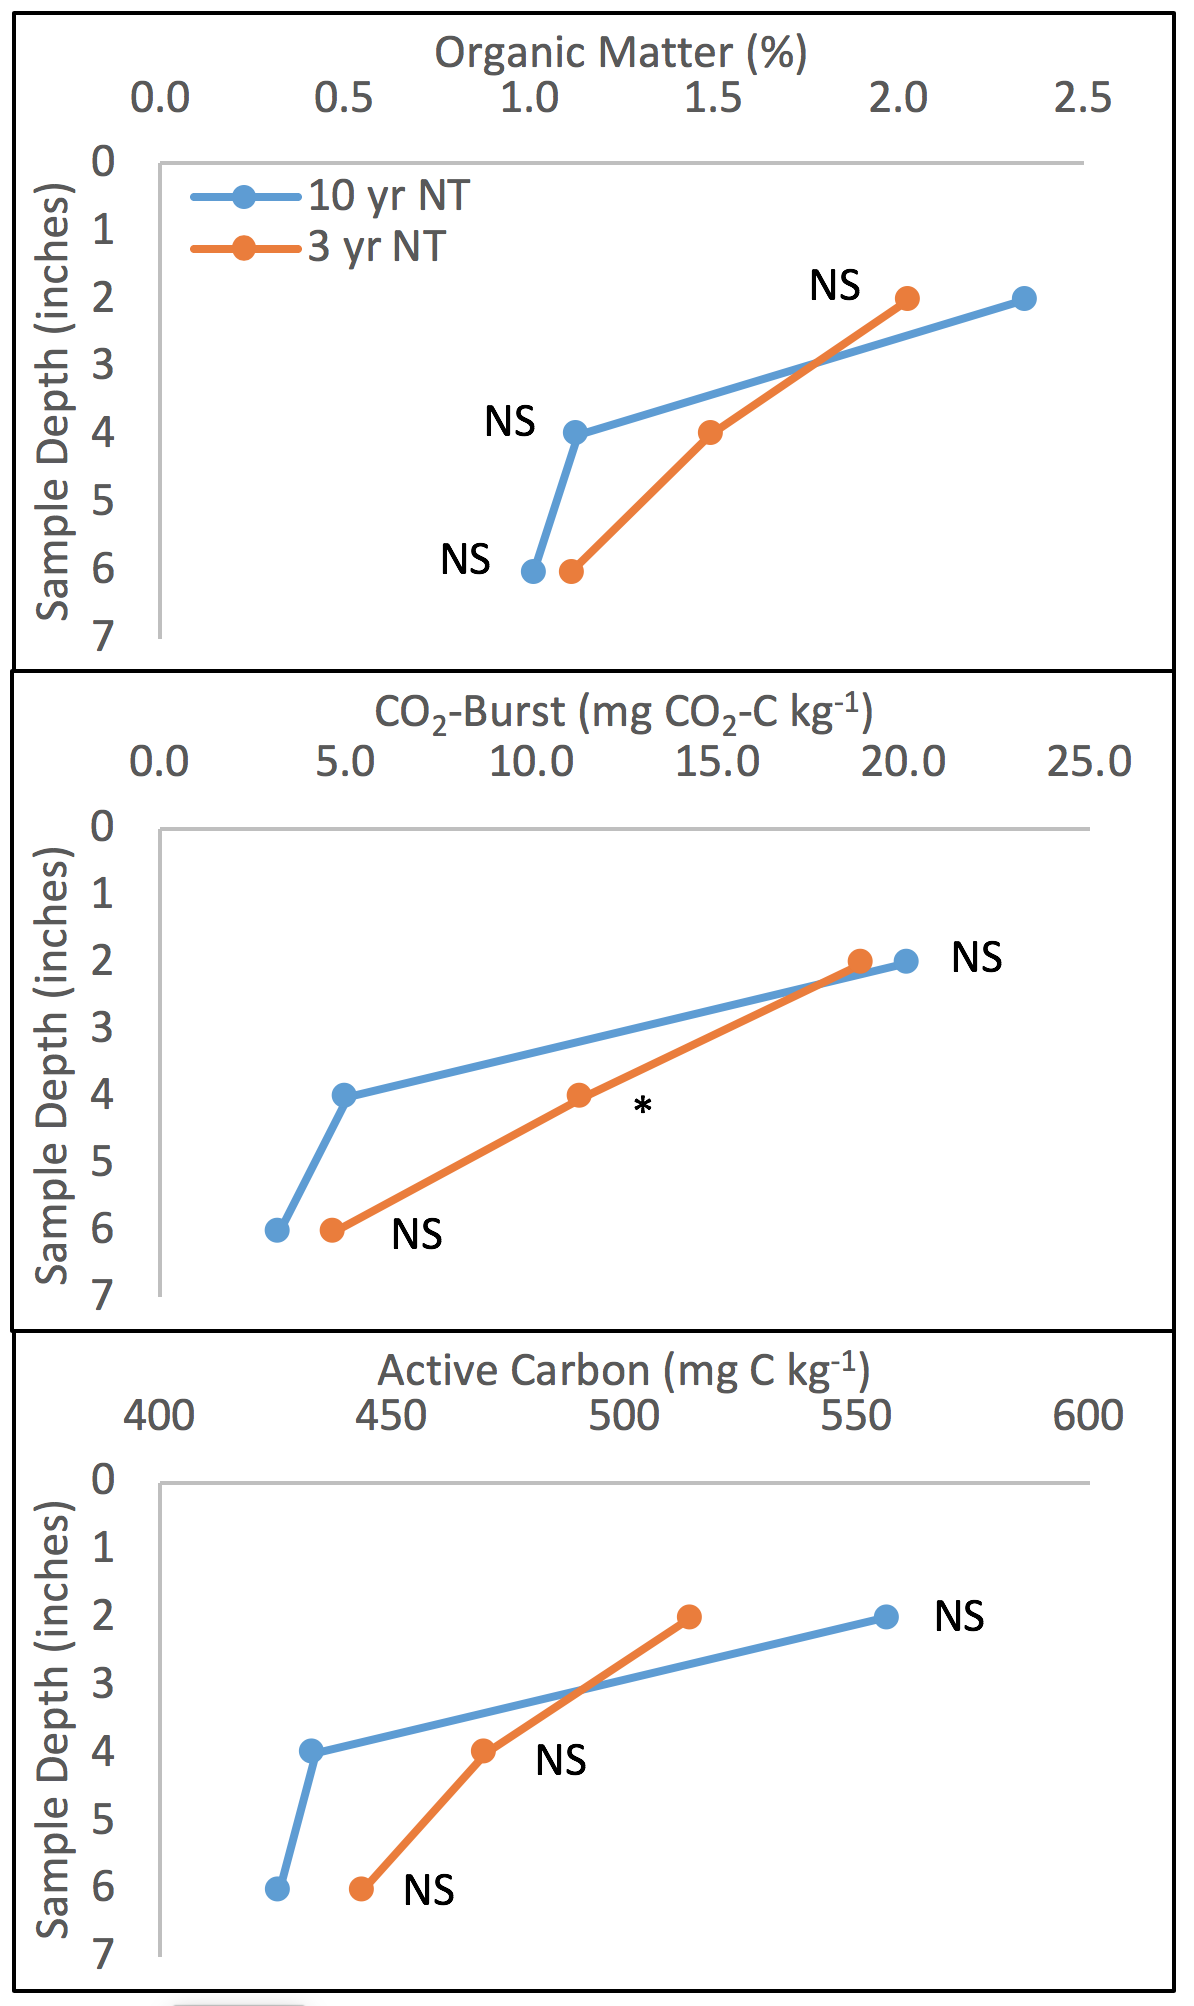
Figure 2 shows data from samples collected in August 2015 from wheat stubble. Again, the stratification of the organic matter, CO2-burst and active carbon are seen, but unlike the data from April, there are no sampling differences between the three-year no-till and 10-year no-till soils at 0 to 2 inches. In fact, the only significant difference observed is at the 2- to 4-inch sampling depth for CO2-burst.
Table 1 shows the concentrations of the analytes when averaged through the 0- to 6-inch sampling depth. There are no differences in organic matter when sampled to this standard depth. The only observable difference between the three- and 10-year no-till soils is CO2-burst in April, but even this difference is dramatically reduced by diluting the differences in the 0- to 2-inch depth seen in Figure 1 by the soil at 2 to 6 inches.
Table 1. The concentrations of organic matter, CO2-burst, and active carbon when averaged across 0 to 6 inches for samples collected from 10-year-old no-till and 3-year-old no-till plots in April 2015 from soybean stubble and in August 2015 from wheat stubble.
| OrganicMatter | CO2-Burst | Active Carbon | ||
|---|---|---|---|---|
| Concentration in 0 to 6 inches | ||||
| Apr. 2015 | --%-- | --mg kg-1-- | ||
| 10-year no-till | 1.3a | 6.1a | 467a | |
| 3-year no-till | 1.2a | 3.7b | 468a | |
| Aug. 2015 | ||||
| 10-year no-till | 1.5a | 9.5a | 472a | |
| 3-year no-till | 1.5a | 11.7a | 476a |
Figure 2. The distributions of soil organic matter, CO2-burst and active carbon by sampling
depth in soil samples collected in August 2015 from the 10-year-old and 3-year-old
no-till plots located at Lake Carl Blackwell west of Stillwater.
Discussions and Conclusion
The stratification observed in this study occurs because organic matter, which was previously buried by tillage, is decomposed at a rate faster than the addition of organic matter from roots at depths below 2 inches. In a no-till system, organic matter comes from both surface residues and roots (PSS-2267 Organic matter in no-till production systems). Without periodic inversion, the primary source of organic matter at depths below 2 inches is plant roots. The root mass is highest near the surface for all crops and declines with depth. This, combined with the fact that surface residue incorporation into no-till soil is limited, explains the observed reduction in organic matter and associated soil health indicators with depth in the older no-till soil.
Many research efforts have compared no-till to conventional tillage systems. Some
of these efforts have used 6-inch samples to compare the tilled layer of a conventional
system to the same depth of a no-till system and found success in observing elevated
concentrations of soil health indicators discussed above. However, the data presented
here show this will not be prudent when trying to best understand changes in soil
health as a function of time in no-till or perhaps differences in cropping systems.
It is important to assess soil health at shallow depths (0 to 2 inches) if interested
in assessing the progression of soil health. This 2-inch sampling approach is commonly
used by microbiologists who study the impacts of management on microbial activity
and also should be done in our on-farm assessment, because the surface 2 inches is
the most biologically active zone in no-till soils and most sensitive to management
changes. In fact, Franzluebbers (2002) suggested that instead of using the concentration
of organic matter as an indicator of soil health, the degree of stratification should
be used. He evaluated organic matter stratification in soils from Canada, Georgia
and Texas. His data suggested that in soils from the southern climates that typically
have lower inherent organic matter, using a stratification ratio (for example, the
organic matter in 0- to 2-inch depth/organic matter in 4- to 6-inch depths) was better
at separating differences between no-till systems, periodic tillage systems and conventionally
tilled systems. The data presented in Figures 1 and 2 have been used to calculate
the stratification ratios in Table 2. When the stratification ratio is used, significant
differences in the soil collected in August 2015 from the wheat stubble was found,
whereas evaluating each depth provided limited differences (Figure 2). In conclusion,
if detailed evaluations of soil health are required, it is best to collect segmented
samples as was done for this study, or simply just use 0- to 2-inch samples, because
0- to 6-inch samples are likely to yield limited results unless comparing dramatically
different systems. Soil pH and plant available nutrients also may be stratified in
a no-till system. A well-designed soil sampling strategy can show the differences
better than a one-depth sample.
Table 2. The Stratification ratio (concentrations in 0- to 2-inch depths/concentrations in 4- to 6-inch depths) for samples collected from 10-year-old no-till and 3-year-old no-till plots in April 2015 from soybean stubble and in August 2015 from wheat stubble.
| Organic Matter | CO2-Burst | Active Carbon | ||
|---|---|---|---|---|
| --Stratification ratio-- | ||||
| Apr. 2015 | ||||
| 10-year no-till | 2.3a | 12.8a | 1.2a | |
| 3-year no-till | 1.7b | 4.5b | 1.1a | |
| Aug. 2015 | ||||
| 10-year no-till | 2.3a | 6.3a | 1.3a | |
| 3-year no-till | 1.8b | 4.0b | 1.2a |
References
Franzluebbers, A.J. 2002. Soil organic matter stratification ratio as an indicator of soil quality. Soil and Tillage Research. V 66, 2 pp 95-106.
Warren, J.G. and B. Arnall. 2019. PSS-2267 Organic matter in no-till production systems. Oklahoma Cooperative Extension Service. Stillwater, OK.
Jason Warren
Soil and Water Conservation/Management Specialist
Hailin Zhang
Nutrient Management Specialist
Brian Arnall
Precision Nutrient Management Specialist


