How to Get a Good Soil Sample
Revised from a fact sheet prepared by Dr. Hailin Zhang
Soil tests provide a scientific basis for evaluating available plant nutrients in cropland, pastures, lawns and gardens. Analyses of soil samples can help farmers and homeowners fine-tune nutrient applications from fertilizers, biosolids and animal manure. Properly managing the amount of nutrients added to the soil can save money and protect the environment.
Soil nutrients vary by location, slope, soil depth, soil texture, organic matter content and past management practices, so getting a good soil sample stands out as a major factor affecting the accuracy and usefulness of soil testing. This fact sheet outlines some specific considerations, which should be taken into account to get the greatest benefit from soil testing.
Sample Soil at the Right Time
Fields used for production of cultivated crops may be sampled any time after harvest or before planting. Generally, two weeks should be allowed for mailing, analysis and reporting of results. Additional time may need to be allotted for ordering and application of fertilizers, manure or lime materials. Noncultivated fields should be sampled during the dormant season. In either case, do not sample immediately after lime, fertilizer or manure applications because those samples do not represent the true soil fertility.
Fields should be tested annually to measure the available nitrogen pool or as frequently as necessary to gain an understanding of how soil properties may be changing in relation to cultural practices and crop production.
Collect a Representative Sample
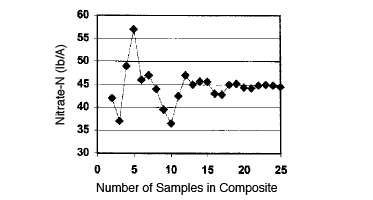
Getting a representative sample is simple, but not easy. Research at OSU and other universities has clearly shown that a minimum of 20 cores or small samples taken randomly from the field or area of interest are necessary to obtain a sample, which will represent an average of the soil in the field (Figure 1). These cores should be collected in a clean plastic bucket (to avoid metal contamination) and mixed thoroughly by hand. The sample bag should be filled from the mixture. A 1 pint (OSU soil sample bag full) sample is usually adequate for all tests, which might be required. If the sample is too wet to mix, it should be spread out to dry some and then mixed, or sampling should be delayed until the field is drier.
Figure 1. The minimum number of core samples needed to make a representative composite sample is about 20.
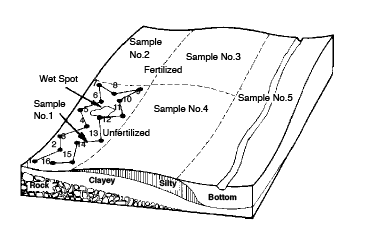
Figure 2. Divide field into uniform sampling areas and follow a random pattern when sampling. Avoid unusual spots and try to obtain a representative sample.
It is important to remember that the sample obtained by the above procedure will be an average of the area sampled. If the area sampled is extremely variable in the soil properties that are going to be tested, then it may be better to separate the field into smaller areas, and get a representative (20 cores) sample from each of these areas in order to determine how variable the field is (Figure 2). In this way, it may be possible to treat some areas of the field differently from others and remove variability so that the field can be sampled and treated as a unit in the future. Variability in a field can often be noted by differences in surface soil color and crop growth or yield.
Using only one sample for a large variable field can be very costly. Since the sample represents an average of the soil in that field, recommendations based on the soil test will likely cause the field to be overfertilized on some parts and underfertilized on other parts. Failure to obtain uniform response to treatments based on a soil test is frequently a result of one sample being used to represent a large variable field.
An example of field variability is shown in Table 1. The range of test values was obtained by testing 40 individual cores taken at random from an “apparently uniform” 80-acre field. The variation is great enough so that for some analyses the average is not a good representation of the field. Areas of the field with the lowest pH, phosphorus and potassium values will not receive adequate lime or fertilizer if recommendations are based on the average test values.
A single core sample, or spadeful, is extremely risky because it may test anywhere in the range shown for each of the analyses. For example, deficiencies for wheat could range from 0 to 37 pounds of P2O5 and 0 to 34 pounds of K2O. For alfalfa, which has much greater nutrient requirements, deficiencies could range from 0 to 94 pounds of P2O5 and 0 to 120 pounds of K2O. This would also affect the amount of nitrogen and lime required. Obviously, unless the 80 acres is divided into less variable units for testing, some areas of the field will receive either too much or too little fertilizer and lime.
In deciding how large an area can be represented by one composite sample (20 cores), the determining factor is not the number of acres involved, but rather, the variability of the area. Some large, uniform fields can be represented well by a single 20-core sample, while some highly variable fields need to be split into two or more smaller areas for testing. Regardless of the field size or main area being sampled, unusual spots in the field (salty or wet spots) should be avoided during the initial random sampling. When unusual spots make up a significant area, they should be sampled separately.
Sampling Where Nutrients are Banded
It is a challenge to sample fields where fertilizers have been band applied. Research has shown that soil test P values are not increased beyond 2 inches from the band of fertilizer placement. If a soil sample is collected from the banding zone, it has the risk to greatly skew the results of a soil test ultimately leading to under-fertilization and yield loss. Some soils though, have very high P fixing capabilities, and the amount of available P is very small a year after application. This is commonly seen in soils with very low or high soil pH.
In these conditions, where row spacing is less than 12 inches (e.g., winter wheat), it is not necessary to change sampling procedures discussed earlier.
Table 1. Variability of an 80-Acre Field Based on Soil Tests of 40 Individual Soil Cores.
| Soil Test Values | ||
|---|---|---|
| Analysis | Range | Average |
| pH | 4.9-6.3 | 5.6 |
| Buffer Index | 7.1-7.4 | 7.3 |
| Nitrogen | 1-34 | 11 |
| Phosphorus | 23-114 | 36 |
| Potassium | 149-770 |
306 |
The primary concern with banding fertilizer is with no-till production of row crops. There are three situations you may encounter: 1) planting over existing rows 2) knowing the location of rows but not planting over them and 3) previous rows are unknown. All three situations require a different sampling strategy. When you are planting over past rows, it is important to know the residual of past bandings, so it is recommended to sample in the area around the rows.
When sampling where band location is known, but new row placement is unknown, there is a sampling scheme that can be used to give a more accurate result. A minimum number of sub-samples are required from the area between two bands for every one sub-sample collected from the band. Table 2 shows how many sub-samples between bands need to be collected for one sub-sample from the band for different row spacing.
Table 2. The number of sub-samples to collect from between bands for each sub-sample within band.
| Band Spacing (in) | Sub-samples between bands |
|---|---|
| 15 | 10 |
| 24 | 16 |
| 30 | 20 |
| 40 | 27 |
When collecting soil samples from a field where previous bands are unknown, the common recommendation is that for every core taken, collect an extra sample half the distance of the row spacing away from the first core. For example, sampling a field that was previously in corn on 30-inch row spacing, when you collect one core sample, move over 15 inches and collect a second sample before moving on. Therefore, instead of 15 cores total, you need to collect 15 pairs or 30 cores to make a composite sample. This method has shown to improve the accuracy of the soil sample greatly. The most important thing to keep in mind is that the greatest error occurs when too few samples are taken. By increasing the number of soil samples collected per composite the accuracy of the soil test results improves.
Sample at Proper Depth
Cultivated Fields
For most soil tests, the sampling depth is the tillage depth. The reason for this is because most crops have their greatest root activity in the tillage depth. Obtaining a representative sample with regard to depth means that each of the 20 cores taken from an area should be from similar depth, tillage or 6 inches. Soil tests are generally calibrated on the basis of an acre furrow slice, approximately two million pounds of soil in the top 6 inches.
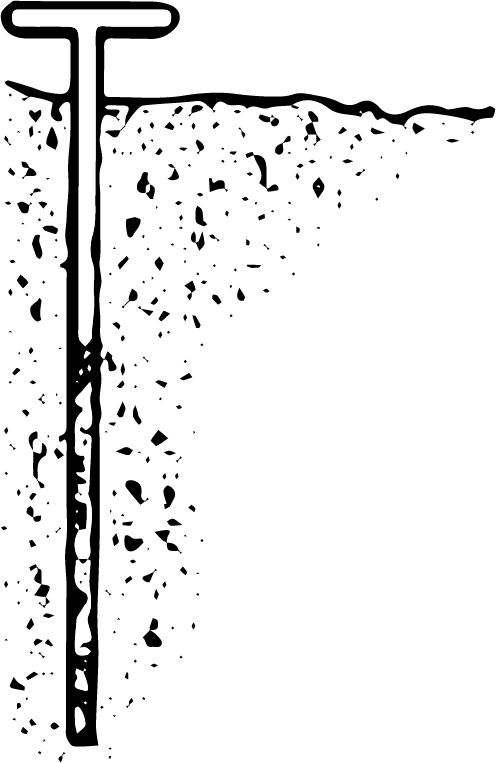
For deep-rooted non legumes such as wheat, bermudagrass, sorghum and cotton, a separate sample representative of the subsoil should be taken in addition to the tillage depth or 6-inch sample. This subsoil sample should represent the layer of soil from 6 to 18 inches below the surface. Because nitrate-nitrogen is mobile in the soil, a test of available nitrogen (and/or chloride and sulfate) in the subsoil sample will provide a more complete picture of available mobile nutrients for these crops (Figure 3) and can save fertilizer expenses.
No-till Fields
Noncultivated fields should be sampled to a depth of 6 inches, again because this is the effective depth of most treatments and the depth of most root activity. Nutrients from fertilizer, animal manure and lime can be accumulated on the surface if they are surface applied without incorporation. A set of samples from the top 2 inches will help identify stratification of nutrients and is especially important for pH determination for no-till fields. If nutrient loss in runoff is the main concern, the 2-inch sample is better than a6-inch sample because only the surface inch or 2 is indirect contact with surface runoff.
Salinity Diagnosis
When salt accumulation is suspected as a cause of poor stand establishment and the sample is being taken after planting, then the depth of sampling should approximate the seeding depth (1 to 3 inches). This is especially important when conditions have been favorable for soluble salts to move upward and accumulate near the surface after planting. Since excess salts are most harmful to germination and seedling vigor, it is this shallow depth that should be tested. At other times during the year, a sample of the entire tillage depth may be most useful to test for salt accumulation.
Send Samples for Analysis
Soil sample bags are available at local county Extension offices. Extension offices will mail your samples to the OSU Soil, Water and Forage Analytical Laboratory and assist with interpreting test results.
Figure 3. A soil probe is a good tool for obtaining soil samples. Push the tube to the six-inch depth and remove the core. Then take the 6- to 18-inch core through the same hole for the subsoil test.


