Short-and Long-term Impacts of Application of Water-base Drilling Mud (WBM) on Crop Yields and Soil Properties
Water-base Mud Production and Disposal
Recent booms in oil and gas exploration have resulted in the increased production of water-base mud (WBM), a by-product from drilling. A common method of disposal for this material is application to agricultural and range land. This has resulted in many opportunities for landowners to receive WBM application to their land in exchange for payment. However, this payment is intended to compensate the landowner for an expected temporary decrease in production, usually a single growing season, which may or may not occur. The most common type of drilling mud in Oklahoma is WBM. Land application companies typically pay the landowner based on the total volume of WBM they are willing to receive. A common rate is $0.50 per barrel. The main components of concern in WBM are dissolved solids (i.e. salts), primarily sodium and chloride. There is a small amount of non-dissolved solids that includes drill cuttings (i.e. rock and soil) and also added bentonite, which is a naturally occurring soil mineral with a large cation exchange capacity. A general introduction on drilling mud can be found in Extension Fact Sheet WREC-102, An Introduction to the Land Application of Drilling Mud.
Since the land application program began in 1987 until 2014, approximately 22,907
sites had received WBM and 4,231 sites had received oil-base mud. For WBM, the greatest
risk is causing saline (electrical conductivity (EC) greater than 4 mS/cm) and/or
sodic soils (exchangeable sodium percentage (ESP) greater than 15 percent), which
can reduce germination and water uptake and increase erosion by decreasing soil structure.
Sodium adsorption ratio (SAR) may also be used in place of ESP; an SAR value of 13
is roughly equivalent to an ESP of 15 percent. A sodic soil is a more serious problem
than a saline soil, since the soil structure becomes dispersed and can inhibit drainage.
A long-term research-demonstration project was established during the 2012-2013 wheat growing season at the Lahoma Research Station for the following purposes:
- To determine the impact of WBM application rate and timing on soil EC and SAR after application to a wheat crop and hay field.
- To monitor changes in soil EC and SAR with time after WBM application.
- To determine the impact of WBM application rate and timing on wheat grain yield during the growing season in which WBM was applied and monitor wheat yield for several years after the WBM was applied.
Winter Wheat and Annual Crops
Impacts During the Season of Application
A study was initiated in October, 2012, where WBM was surface applied at different rates onto winter wheat. Soil impacts and results from the first wheat harvest after WBM application is reported in CR-2272 (“Application of water-base drilling mud to winter wheat: impact of application timing on yield and soil properties”). In summary, the first year of that study showed that while the WBM applications increased soil salt and sodium concentrations, salts were leached out of the root zone resulting in non-toxic concentrations after several months (EC < 4 mS/cm and SAR < 13). As a result, there was no significant impact of WBM on wheat grain yield harvest in June of 2013, except when WBM was applied at wheat growth stage Feekes 7 (Figure 1).
Figure 1. Wheat grain yield harvested on June 20, 2013. WBM was applied during the 2012-2013 growing season. Each date indicates when the water-base mud (WBM) was applied. Note: October 16 was pre-plant and control received no WBM. Rainfall was 11.3 inches during the growing season.
Risk for Crops
However, even if soil salt levels return to non-toxic levels, it does not mean there is no longer a risk to the following crops. Figure 2 illustrates how irrigation/rainfall and drought can impact soil salts on soils previously amended with WBM. Salts in WBM are extremely soluble and mobile, since the dominant anion is chloride. As a result, the salts tend to move wherever the water moves. With adequate rainfall, the salts from the WBM leach out of the rooting zone (0-6 inches) quickly, as was observed in the 2012-2013 growing season. However, with prolonged periods of low precipitation, the subsoil water tends to move upward toward the surface, carrying salts with it. As that water is lost through evapotranspiration, the salts accumulate closer to the surface. The more clayey the soil is, the greater potential for salt seepage toward the surface. The test plots in Lahoma were located on clay loam soils.
Figure 2. Salts can either leach downward or seep upward, depending on conditions.
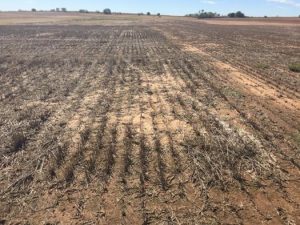
As a result, there is a possibility that even though reduced yields may not occur during the growing season in which WBM is applied, reduced precipitation leading up to or during the second growing season may allow salt seepage upward and inhibit seed germination, establishment or growth. Figure 3 illustrates this phenomenon in the next growing season after WBM application. This carry-over from WBM application occurred due to low rainfall amounts received (5.25 inches) during the first growing season after initial WBM application, which resulted in poor germination (Figures 4 and 5). This was exacerbated by no-tillage, since tillage would act to dilute the salts into soil layers with lower salt concentrations.
Figure 3. Wheat grain yield in 2014 for the first growing season after WBM was initially applied during the 2012-2013 growing season. Treatments with different letters indicate statistically significant differences. Only 5.25 inches rainfall occurred during the 2013-2014 growing season.

Figure 4. Spring 2014 aerial imagery of the Lahoma wheat plots during the first growing season after WBM was initially applied during the 2012-2013 growing season. Blue, black, and red borders indicate plots that received no WBM (control); 4,000; and 6,000 pounds total salt per acre, respectively.


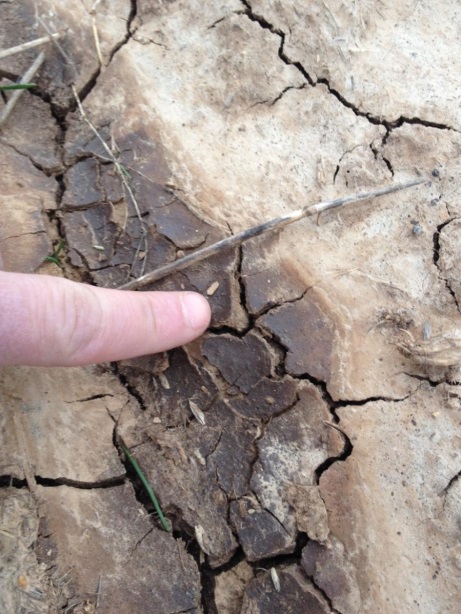
Figure 5. Left: wheat plot at Lahoma after wheat harvest in 2014, which is the first growing season after WBM was initially applied during the 2012-2013 growing season. Right: close up picture of the soil surface showing evidence of soil dispersion via clay films and salt crusting.
Although salts naturally disseminate throughout the soil, they are in a state of flux upward and downward as a function of the amount of water movement downward and evapotranspiration of water upward. Eventually, with enough precipitation, the salts will leach far enough below the root zone and further disseminate to the point it is unlikely to return to the surface. However, the time required for this to occur will vary with climate, crop rotation, initial salt concentration, drainage and soil texture. As a further example, the following growing season (i.e. third) showed fewer bare spots where poor germination occurred (Figure 6) than the previous season due to much higher rainfall during the 2014-2015 growing season (23.2 inches). This acted to leach salts deeper into the soil and prevent upward seepage, ultimately resulting in grain yield that was not different between plots previously receiving WBM and those that did not (Figure 7). Soil samples taken in the upper 2 inches, where germination and establishment are most sensitive, revealed that the few remaining bare spots had elevated TDS and SAR, compared to the non-bare spots during that growing season. The non-bare spots showed acceptable levels of TDS, SAR and dispersion, although the plots that previously received WBM had higher SAR, compared to the control plots not receiving WBM (SAR of 7 vs. 1).

Figure 6. Wheat plots at Lahoma during the 2014-2015 growing season, which is the second growing season after WBM was initially applied during the 2012-2013 growing season.
Figure 7. Wheat grain yield 2015 – the second growing season after WBM was initially applied during the 2012-2013 growing season. Treatments with different letters indicate statistically significant differences. Rainfall was 23.2 inches during the 2014-2015 growing season.
Grasses and Perennials
Many landowners will choose to apply WBM on pastures, hay fields and rangeland consisting
of perennial plants. Similar to annual crops such as wheat, the timing and rate of
the application is critical. While plants will vary in their tolerance to soil salinity,
there is always less risk with a lower application rate of total salts/acre. This
was observed in a study of grass plots (mostly Old World Bluestem) at Lahoma, where
plots received three rates on established grass: 9,000; 6,000; and 4,000 pounds per
acre TDS. This represented 1.5; 1; and 0.66 times the legal allowable limit for TDS
application, according to the Oklahoma Corporation Commission (OCC). The timing of
WBM application was also tested: December, January, February, March, April, May and
June.
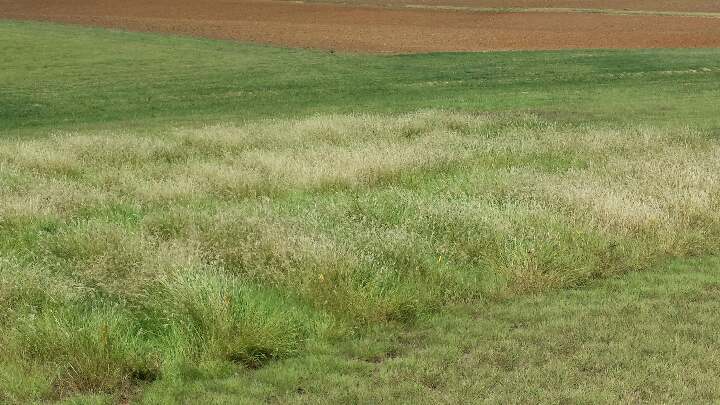
The timing of WBM application can have a strong visual impact and stunt forage growth. Specifically, a growing forage plant is more sensitive to direct damage when WBM is applied during spring green-up. At this stage, the high salt concentration applied to the plant surface can easily damage plant tissue cells. There is less risk of direct plant damage when the application is made in winter while the forage is dormant (Figure 8). Although a “burning” of plant tissue was observed when WBM was applied during green-up vs. other application dates, the timing of application did not affect yield.

Figure 8. Mixed grass hay plots (mostly Old World Bluestem) that received WBM applications. Upper photo shows plots during spring green-up: plots A and B received WBM during green-up and plot C received WBM prior to green-up and while the grass was still dormant in winter. Lower photo shows all plots immediately prior to second harvest in September 2014.
On the other hand, while WBM timing had little impact on total biomass harvesting at the first cutting, the application rate had a significant impact on total biomass (Figure 9). Reduced rates of WBM application at 0.66 times the maximum allowable salt application rate did not significantly decrease total biomass at the first cutting, compared to the non-amended control. However, the maximum salt application rate of 6,000 pounds salt per acre and higher (1.5 times) resulted in significant reductions in biomass production.
Figure 9. Grass biomass harvested at the first cutting after WBM was applied at 0.66, 1 and 1.5 times the maximum allowable salt application rate (6,000 pounds salt per acre). Results are averaged across application timing and compared to a control that received no WBM. Bars with the same letter indicate no significant difference between salt application rates.
Visual observation of the plots during the following growing seasons as well as aerial imagery showed that all plots recovered and did not result in any bare spots, as was observed in the annual wheat crop that was sowed in the following seasons.
Risks of WBM Applications to Annual vs. Perennial Crops
There are two main ways salt from WBM can reduce yields: direct impact by damaging tissue when the salt water is sprayed onto the plant, and indirect impact from the applied salt water on soil chemical and physical properties, which then have a negative impact on the plant. Application of WBM to perennial plants, such as forages, presents less long-term risks, not only because the plants are already established, but because the subsequent growing season is not dependent on new seed germination. The greater risk to annual crops is due to the need to sow a seed every single growing season. While a 6-inch soil sample may indicate a soil is non-saline or non-sodic, such a soil depth is not representative of the growing environment for a seedling. In other words, while a 6-inch soil sample may indicate no problems, the chemical and physical properties of the first 2 inches of soil might be detrimental to a germinating seed, since this is the environment immediately affecting the seedling. In that case, a 6-inch sample could dilute the high concentrations of salinity and sodium occurring in the 2-inch layer and make it appear as if conditions were fine. This consideration is especially important in no-till agriculture where the top 2 inches will not be mixed with the 4- to 6-inch soil depth. While an established plant may be quite tolerant to salinity and sodicity, a seed will have problems germinating in the upper 2 inches if the soil is saline. If the top 2 inches of soil is somewhat sodic, then a physical crust may form, which will physically inhibit emergence of the germinating seed. Direct damage to plant tissue from applied WBM is immediate and not a long-term problem; in some cases, the plant may recover and produce normal yield for that growing season. Damage to the soil will have much less of an impact on perennial plants compared to annual plants that require sowing every season.
Conclusions and Recommendations
Regardless of cropping system, the risk of long-term damage from WBM increases with
increasing application rate of total salts per acre. Thus, always provide more land
than necessary for receiving WBM to reduce the total salt load per acre. The OCC currently
allows a maximum of 6,000 pounds total salt per acre to be applied, regardless of
crop, climate or soil type. However, a maximum of 4,000 pounds total salt per acre
is recommended to minimize potential damage to crops and soils.
In general, there is less risk in applying WBM on perennial plants than annual crops, when a seed must be sown every year. When WBM is applied to a perennial plant, it is best for the WBM to be applied in winter while the plant is dormant or during a fallow period.
While some producers will experience no reductions in yield, always expect a reduction in yield for at least one growing season, which may not occur during the growing season in which the WBM was applied. The time required for recovery from the salt application with WBM will vary depending on soil texture, rainfall, total salt applied per acre and plant species.
Chad Penn
Professor of Soil and Environmental Chemistry
Jason Warren
Associate Professor of Soil and Water Conservation


