Oklahoma Agricultural Soil Test Summary 2018-2022
Soil fertility information for an individual county or a whole state is necessary for estimating nutrient needs,tracking changes in soil pH and nutrient levels, and serving as a guideline for fertilizer and manure application. The Oklahoma Extension Service’s Soil, Water and Forage Analytical Laboratory analyzes soil samples and archives testing results for all 77 Oklahoma counties. A statewide and county summary of all agricultural soil samples is made every four to five years. The summary from 2018 to 2022 consists of about 51,000 samples and is presented below in Tables 1 and 2. Similar summaries from 1994 to 1999, 2000 to 2003, 2004 to 2008, 2009 to 2013 and 2014 to 2017 were made and published in CR-2247, CR-2253, CR-2259,CR-2074 and CR-2283.All the identifiable lawn, garden and research samples were excluded in the summary since most of them do not represent the real condition in production agricultural fields. Soil samples were analyzed for pH, buffer index (BI) pH less than 6.3 for lime recommendations, nitrate-nitrogen (NO3-N, lbs/acre), soil test phosphorus (STP) index and soil test potassium (STK) index. The recommended soil sampling depth in Oklahoma is 6 inches,and STP and STK indexes are equivalent to lbs/acre (lbs/ acre = 2xppm). Medians are given along with the average because most of the data do not have normal distributions and sometimes averages give a false impression on where the center of the distribution lies for non-normal distributions. Some unusually high values were also removed from the database (NO3-N>1000, STP>1000, and STK>2000) because most of those samples were mislabeled compost or manure samples.
This summary may provide a valuable assessment of the soil fertility status of Oklahoma farmland, but soil samples need to be collected and analyzed for an individual field to better manage soil fertility and to correct soil acidity problems. Both spatial and temporal variabilities exist in all fields. Similar summaries for each county are also available. To request a copy for a specific county, please contact the authors at (405) 744-6630, or soiltesting@okstate.edu.
| Total | |||||
|---|---|---|---|---|---|
| pH | <5.5 | 5.5~6.5 | 6.6~7.5 | >7.5 | |
| Count | 8630 | 24200 | 11312 | 6391 | 50533 |
| Percent | 17.1% | 47.9% | 22.4% | 12.7% | |
| NO3-N | <10 | 10~20 | 20~40 | >40 | |
| Count | 27780 | 11700 | 6735 | 4641 | 50856 |
| Percent | 54.6% | 23.0% | 13.2% | 9.13% | |
| STP index | <40 | 40~65 | 65~120 | >120 | |
| Count | 29151 | 9063 | 5066 | 7255 | 50535 |
| Percent | 57.7% | 17.9% | 10.0% | 14.4% | |
| STK index | <120 | 120~250 | 250~350 | >350 | |
| Count | 8589 | 18796 | 9567 | 13583 | 50535 |
| Percent | 17.0% | 37.2% | 18.9% | 26.9% |
Table 1. Distributions of soil pH, NO -N (lb/ac), Soil Test P Index and Soil Test K Index analyzed from 2018—2022.
| pH | NO-N (lbs/a) | STP Index | STK Index | |
|---|---|---|---|---|
| Median | 6.2 | 8 | 32 | 233 |
| Average | 6.3 | 17 | 63 | 288 |
| Minimum | 2.8 | 0 | 0 | 0 |
| Maximum | 12.5 | 999 | 999 | 1999 |
Table 2. Median, average and ranges of routine soil test results for all agricultural samples tested between 2018—2022.
Soil pH and Lime Requirement
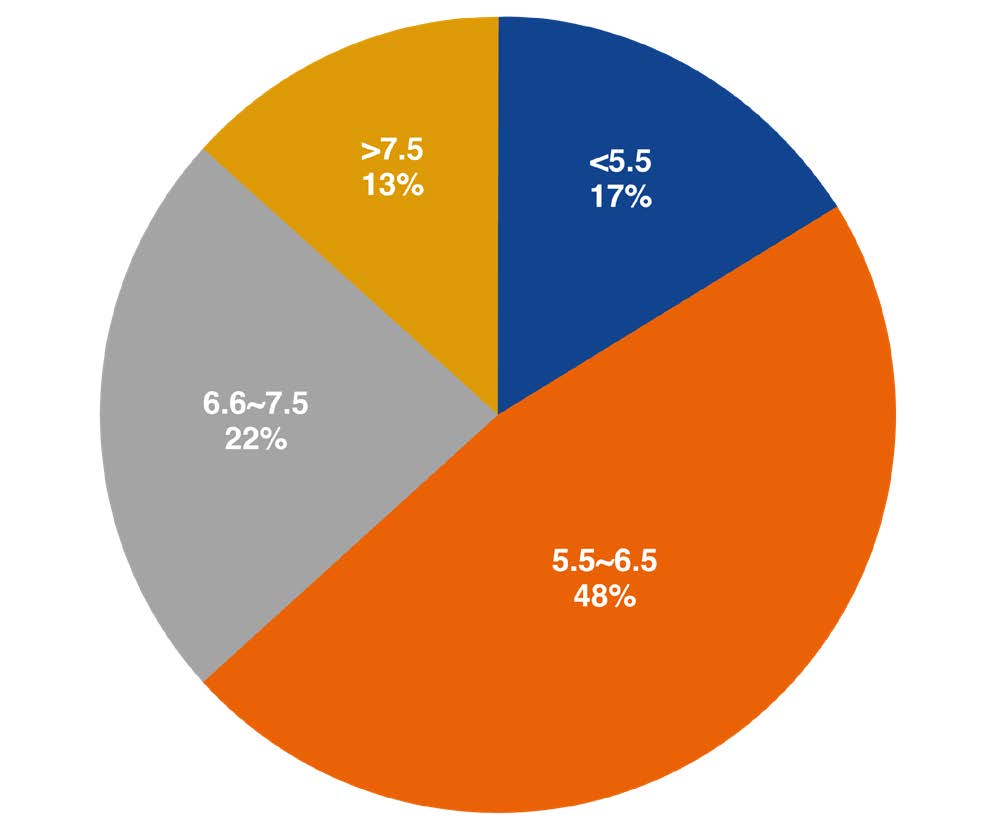
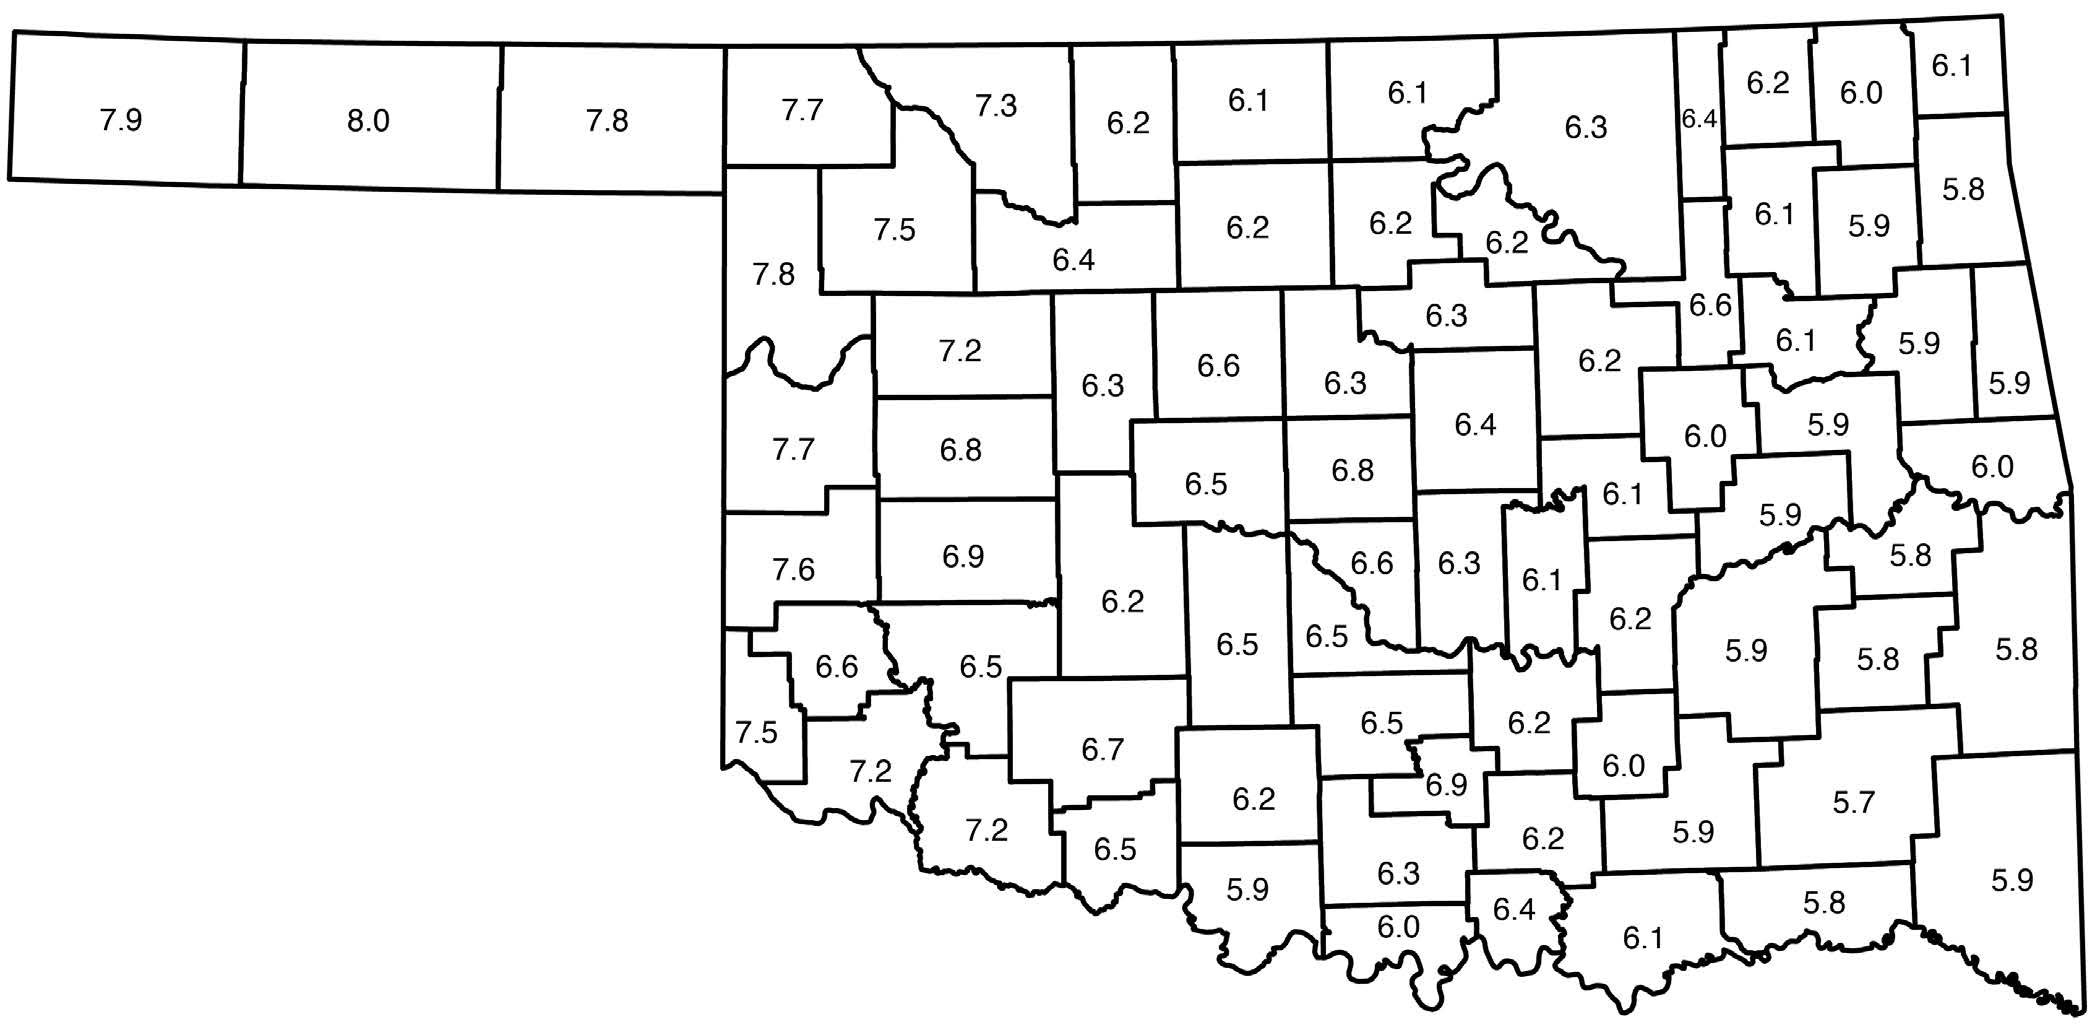
The median pH of Oklahoma soils was 6.2, which is 0.1 unit lower than that of the previous four years. That means 50% of the fields tested had a pH less than 6.2. Soil pH of all samples is divided into four groups and shown in Figure 1. Nearly 17% of the 51,000 samples had a pH less than 5.5 and indicated a potential production loss due to soil acidity. Low soil pH has become a crop production problem of increasing concern in many parts of Oklahoma. This is especially true in some counties in the central wheat growing region where as high as 30% of the fields had a pH less than 5.5. Strong soil acidity not only lowers the availability of phosphorus but also increases the level of toxic elements present, such as aluminum and manganese. Banding phosphate fertilizer and using aluminum tolerant wheat varieties have shown some benefits on acid soils, but eventually, lime must be used to neutralize the acidity and to sustain crop production, especially when winter wheat is rotated with other less acid tolerant crops.
Soil Nitrate-Nitrogen (NO3-N)
The distribution of NO3-N in all the surface soils is shown in Table 1. The majority of the surface soil samples had less than 20 lbs. residual NO3-N per acre (median 8 lbs/acre). Only 9.1% of the fields sampled had NO3-N greater than 40 lbs/acre. This indicates that most farmers would need to apply N fertilizer for the production of most crops based on surface soil tests alone. However, subsoil samples (6 to 18 inches deep) could contain significant amounts of nitrate-nitrogen. Deep-rooted crops, such as winter wheat, cotton and bermudagrass, can penetrate and use the nitrate-nitrogen from the subsoil during growth. Since very few farmers submitted subsoil samples, subsoil nitrate results were not included in the summary.
Soil Test P Index
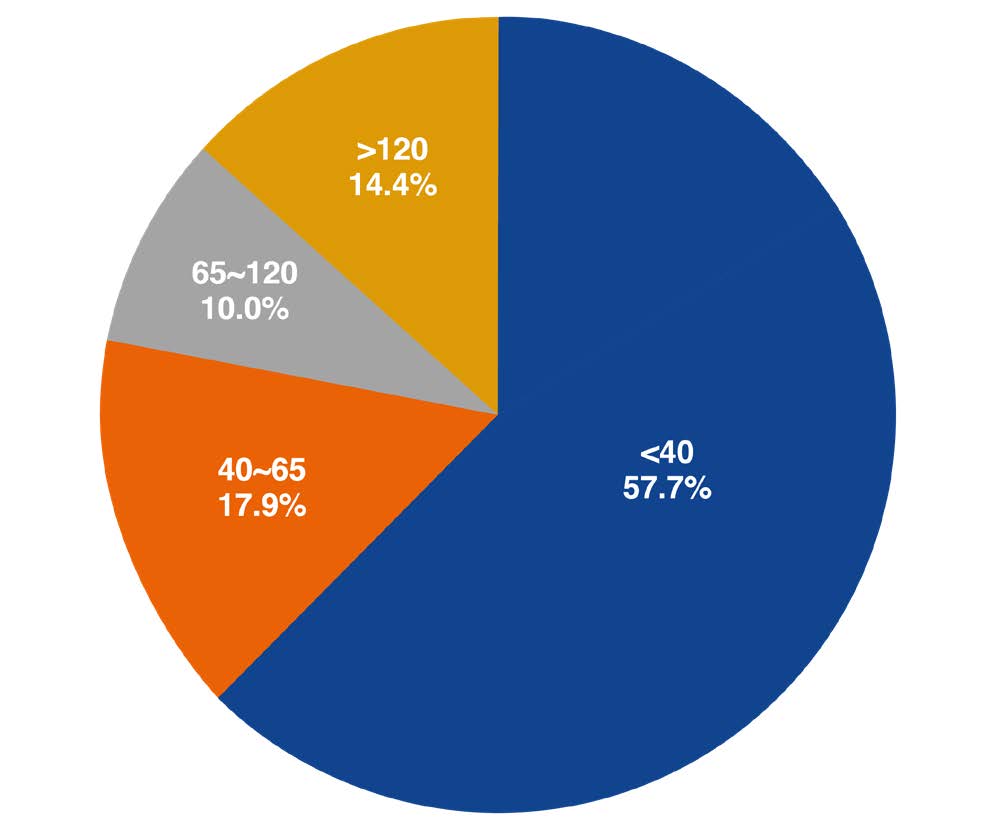
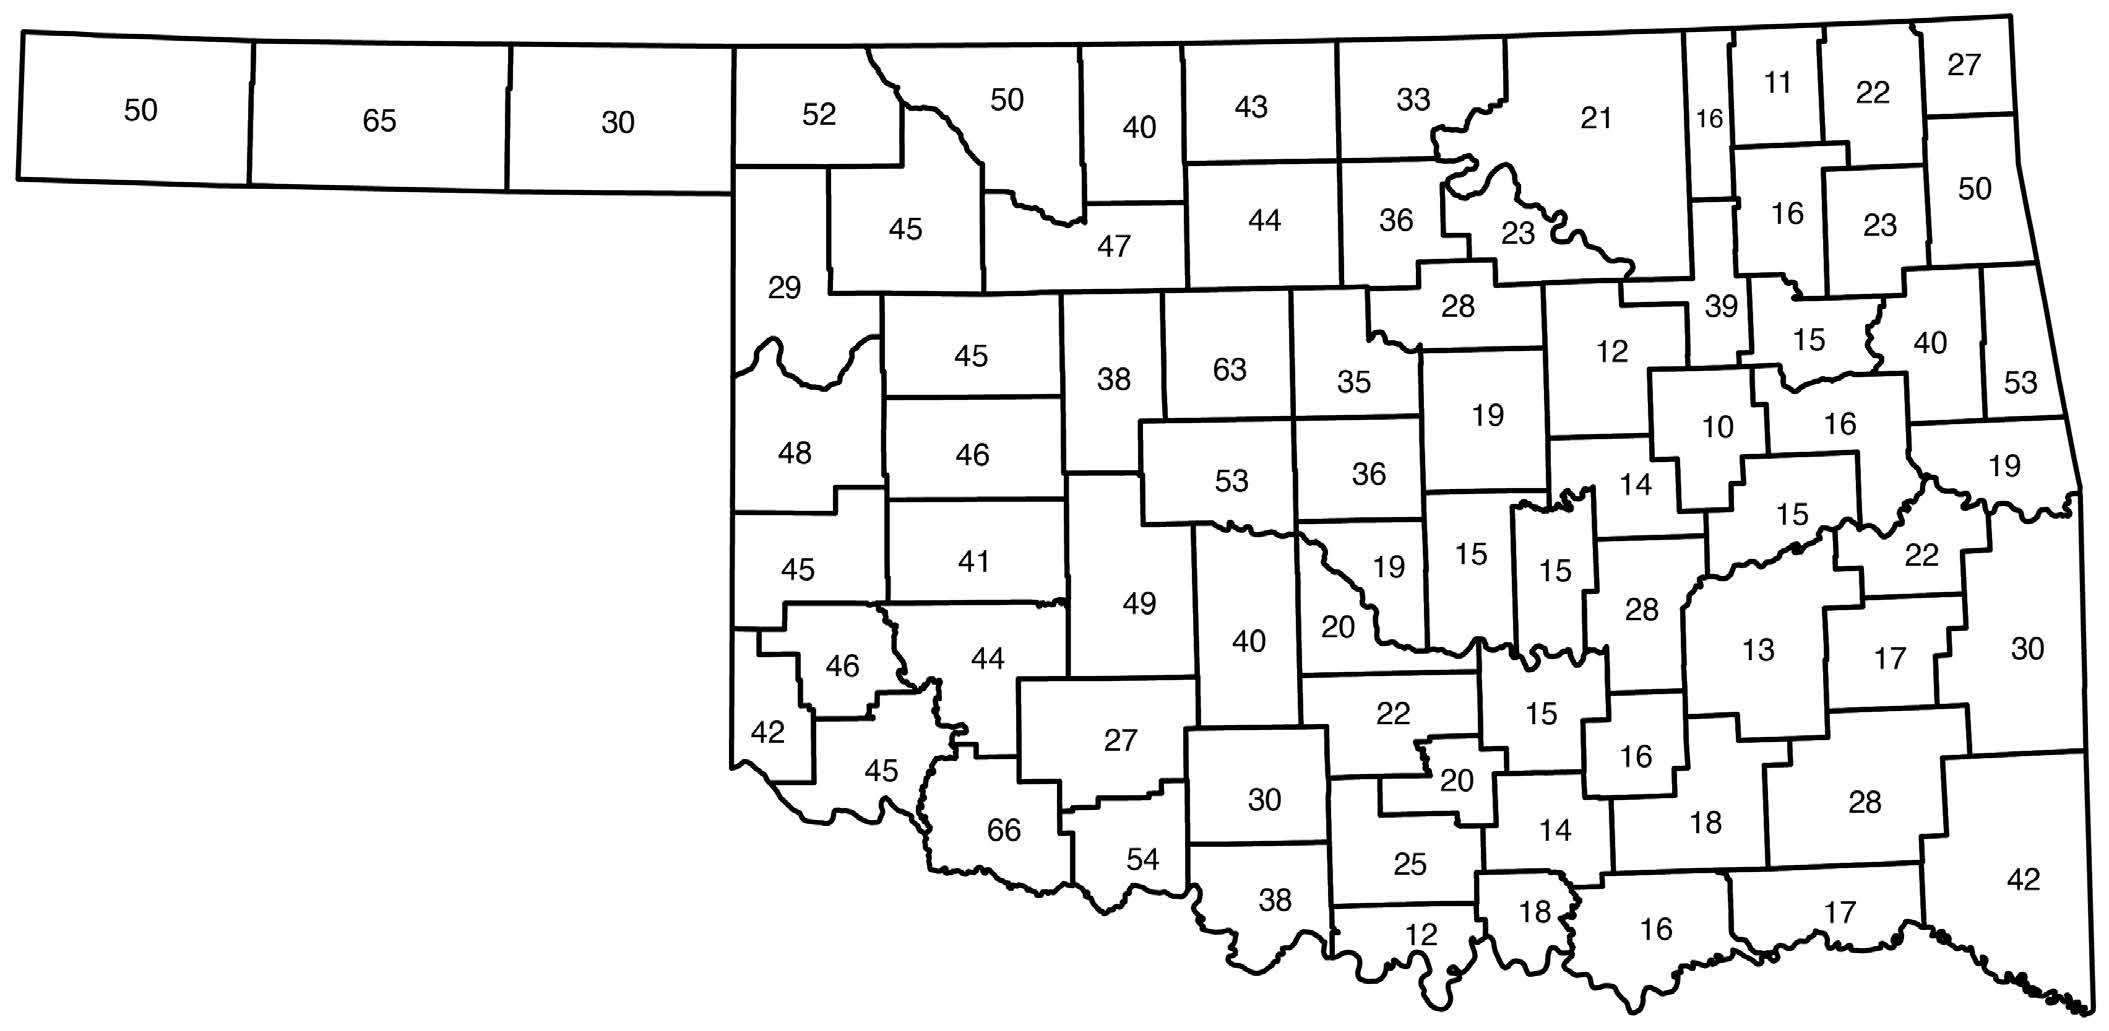
The phosphorus soil test estimates the availability of soil phosphorus during the whole growing season. The Mehlich 3 extraction method has been used in Oklahoma since the 1980s for plant available P and K analysis. The estimated availability is reported as an index and percent sufficiency in the soil (See fact sheet PSS-2225 for more details). Phosphorus fertilizer needs to be added if the soil test P index is less than 65 (100% sufficient level). The available P status is graphed in Figure 2. About 58% of the soil samples are considered low in P availability (STP index <40), and 18% were in the medium category (STP 40-65). Therefore, those fields need various amounts of commercial Por animal manure to achieve the potential crop yields. Ten percent of the samples had a STP index between 65 and 120. In this range, some crops may benefit from additional P fertilizer, but it may not be cost effective. About 14% of the fields had STP over 120, although some parts of the state had much higher percentages due to repeated application of animal manure. Knowing areas in which P is deficient will assist with manure utilization efforts, which re-distributes nutrients, thereby reducing the impact on water quality.
Figure 1. Soil pH distribution of Oklahoma agricultural soil samples tested between 2018—2022.
Figure 2. Distribution of soil test P index in Oklahoma agricultural soils tested 2018—2022. STP of 65 or higher is considered adequate for all crops.
Soil Test K Index
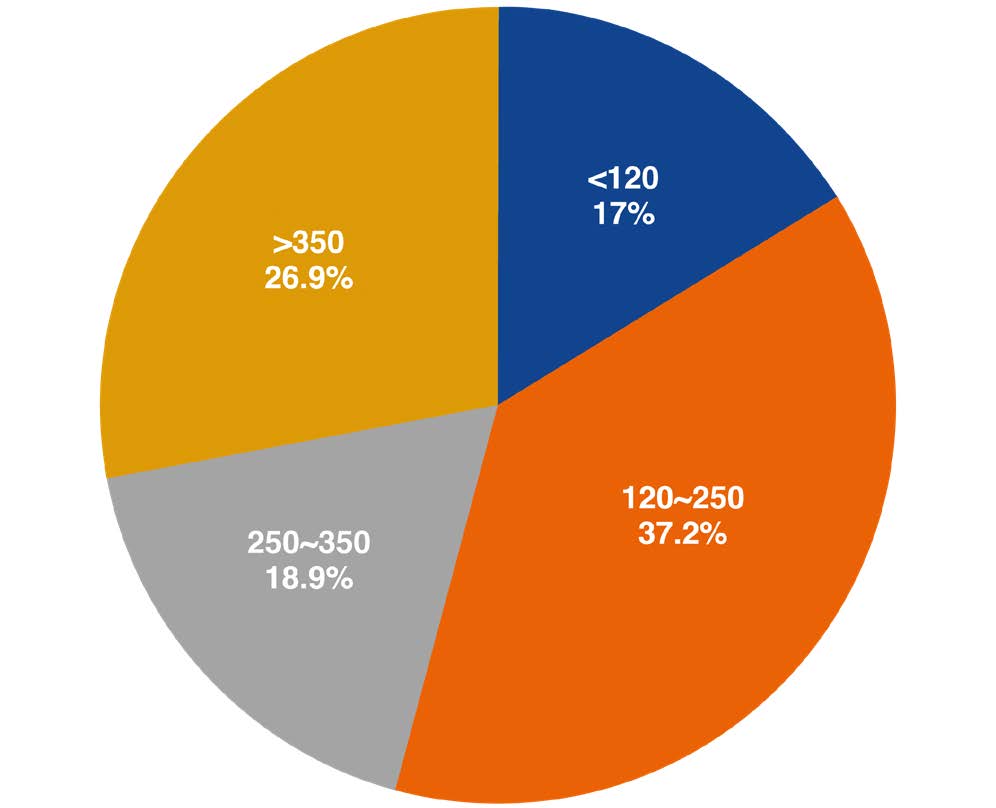
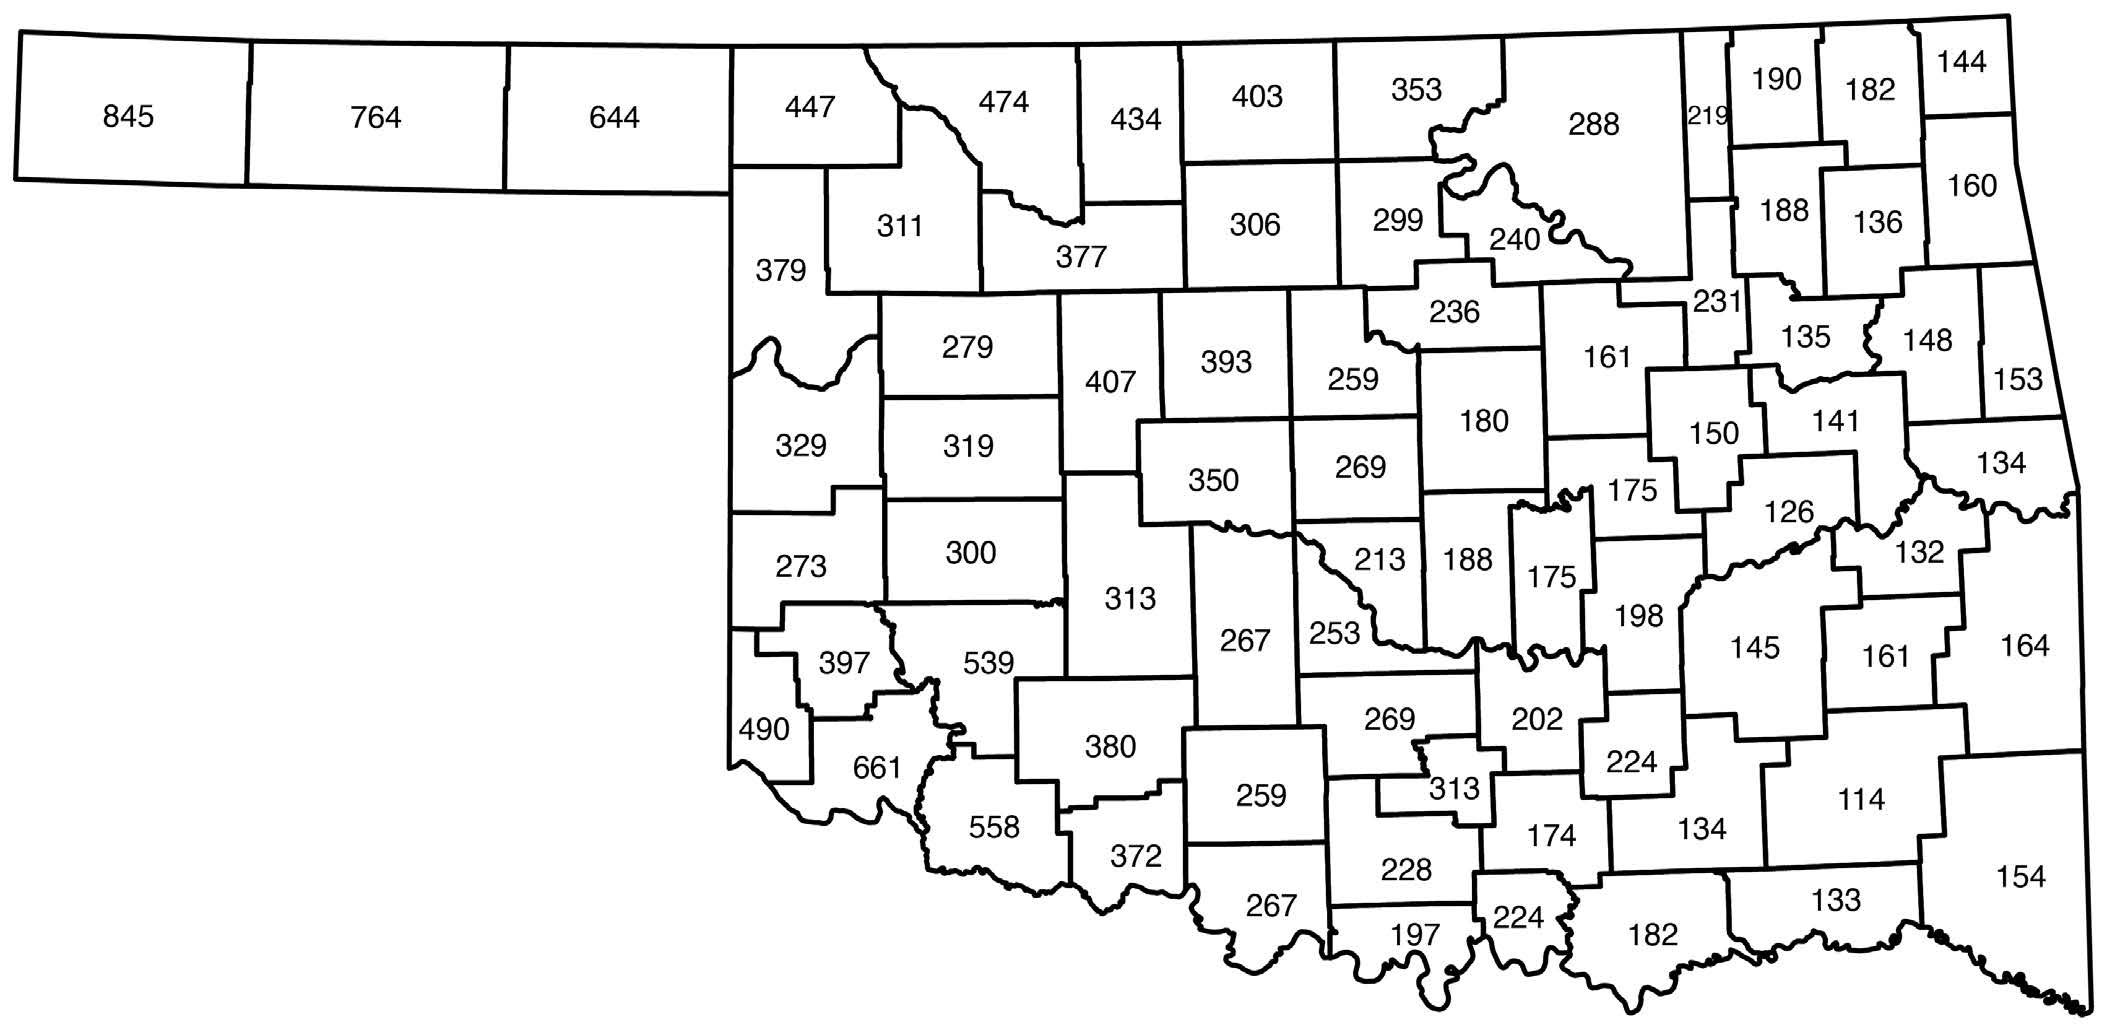
Most Oklahoma soils are high in potassium. This can probably be attributed to the parent materials and low rainfall conditions under which our soils are developed. Data in Figure 3 confirms this tendency. About 54% of the fields had a STK index less than 250 (sufficiently less than 100%) for all crops except alfalfa, which would need additional K to meet crop requirements. The 100% sufficiency STK for alfalfa is 350. In general, the STK levels decreased from western to eastern Oklahoma along the precipitation gradient as shown in Figure 4.
Median STK, STP and Soil pH Values by Counties
The median soil test K and P index and soil pH are presented on the following Oklahoma county maps (Figures 4, 5 and 6). In general, soil pH values are neutral to calcareous in the western and southwestern parts of the state but acidic in the eastern and north central portions. There is no obvious pattern of STP distribution, but STK decreases from the west to east.
Figure 3. Distribution of soil test K index in Oklahoma agricultural soils tested 2018—2022. The sufficiency level of STK is 250 for all crops except alfalfa, and the STK sufficiency level for alfalfa is 350.
Figure 4. Median Soil Test K index values of soil samples tested between 2014—2017 for Oklahoma counties.
Figure 5. Median Soil Test P index values of soil samples tested between 2018—2022 for Oklahoma counties.
Figure 6. Median Soil pH values of soil samples tested between 2018—2022 for Oklahoma counties.

