Application of Water-base Drilling Mud to Winter Wheat: Impact of Application Timing on Yield and Soil Properties
The recent increase in oil and gas exploration has resulted in the production of more water-base mud, (WBM), a by-product from the drilling process. The most common method of disposal for this material is land application to agricultural and grazing lands. Land application companies typically compensate landowners based on the total volume of WBM they are willing to receive. A common rate is $0.50 per barrel. Even though water is the most common component, the water-base mud also contains dissolved solids (i.e. salts) and sodium. There is a small amount of non-dissolved solids that includes drill cuttings (i.e. rock and soil) and also added bentonite, which is a naturally occurring soil mineral with a large cation exchange capacity. A basic introduction on drilling mud can be found in WREC-102 (“An introduction to the land application of drilling mud”). Figure 1 shows a picture of WBM in both an agitated state and after being allowed to settle for several minutes. Notice the thin layer of solids after settling.
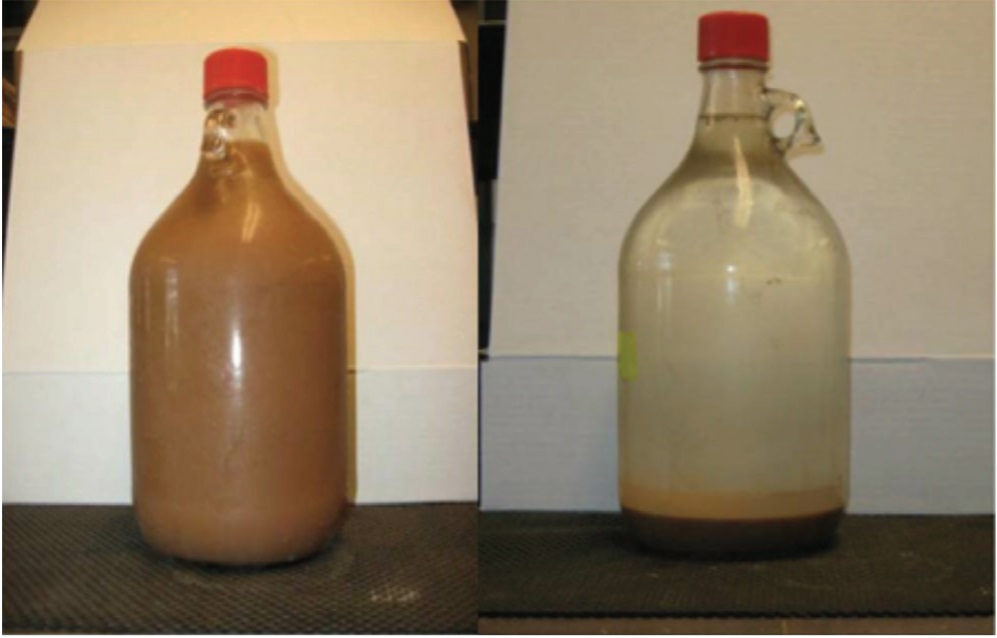
Figure 1. Example of water-base mud (WBM) pictured with (left) and without agitation.
The primary risk associated with over-application of WBM is that it can result in a soil becoming saline or sodic. Oklahoma State University defines a “saline” soil as one that has an electrical conductivity (EC) greater than 4 mS/cm, or 2600 ppm soluble salts (PSS-2226). Depending on the degree of salinity and plant tolerance, excessive salinity can decrease the ability of a plant to uptake water due to increased osmotic potential. If conditions become excessively saline for a particular plant, the plant will display drought-like symptoms even if there is plenty of water applied. Some plants are more tolerant of salinity; for example, wheat can tolerate around 7,800 ppm soluble salts, while Bermudagrass can handle 11,700 ppm. Similarly, it is generally accepted that a soil with an exchangeable sodium percentage (ESP) greater than 15 percent and an EC less than 4 mS/cm will be “sodic” (PSS-2226). Note that a sodium adsorption ratio (SAR) of 13 is roughly equivalent to an ESP of 15 percent. A sodic soil is a more serious problem than a saline soil since the soil structure becomes dispersed and can inhibit drainage through it.
There is currently no information regarding the impact of WBM application timing on grain production in wheat. For example, wheat may be more sensitive to WBM applications at certain growth stages. The purpose of this study was to:
- Determine the impact of WBM application rate and timing on soil EC and SAR after application to a wheat crop.
- Monitor changes in soil EC and SAR with time after WBM application.
- Determine the impact of WBM application rate and timing on wheat grain yield.
Approach
A simulated WBM was applied to a growing wheat crop located at Lahoma, OK, on the Oklahoma State University wheat research station. Chemical characteristics of the WBM included an electrical conductivity (EC) of 233 mS/cm and sodium concentration of about 60,000 mg/L.
Two application rates were tested: 6,000 and 4,000 lbs/acre of total dissolved solids (TDS). Background soil samples were taken to determine native soil TDS, which was then subtracted from the target application rates. Note that 6,000 lbs TDS/acre is the highest loading rate for TDS allowed by the Oklahoma Corporation Commission (OCC). In addition, a control plot which received no amendment was included for comparison. The TDS and cation concentrations were measured using the saturated paste method.
Five different WBM application timings were examined separately: Pre-plant (October 16, 2012) and post-establishment on December 6, 2012; January 14, 2013; February 15, 2013; and March 20, 2013. Wheat was planted on October 18, 2012, and harvested on June 20, 2013. Immediately after application, soil samples were taken at the 0-inch to 3-inch depths and 3-inch to 6-inch depths. Samples were also taken at 30, 60 and 90 days after application in order to monitor salt movement from the root zone. Final soil samples were taken several months after wheat harvest on August 28, 2013.
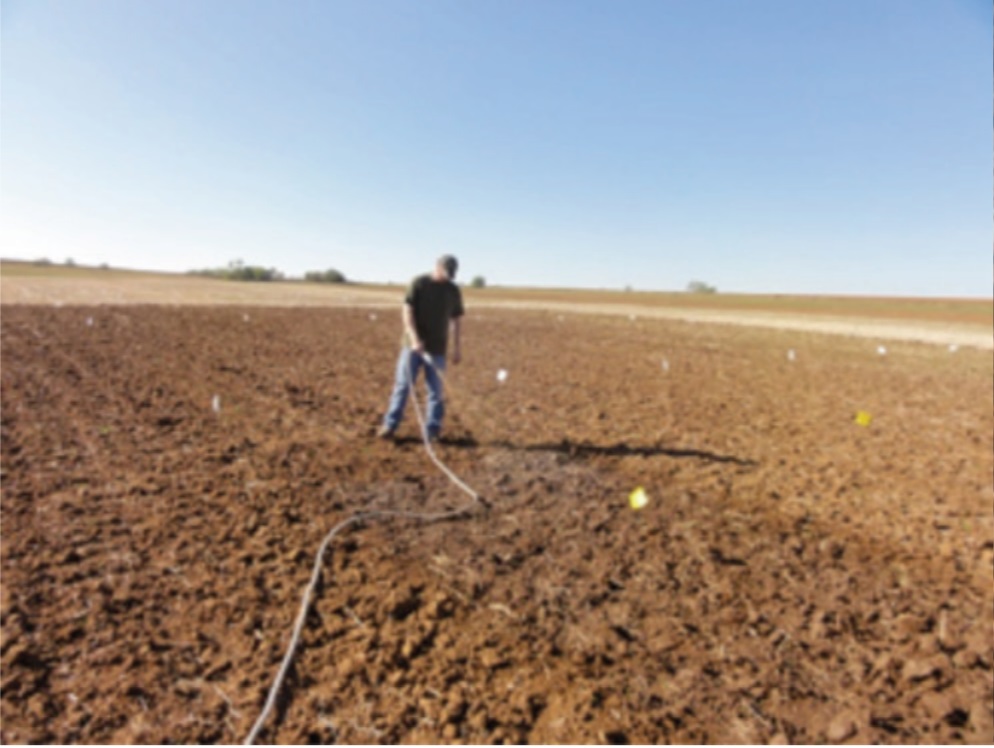
Figure 2a. Application of the simulated water-base mud (WBM) prior to planting.
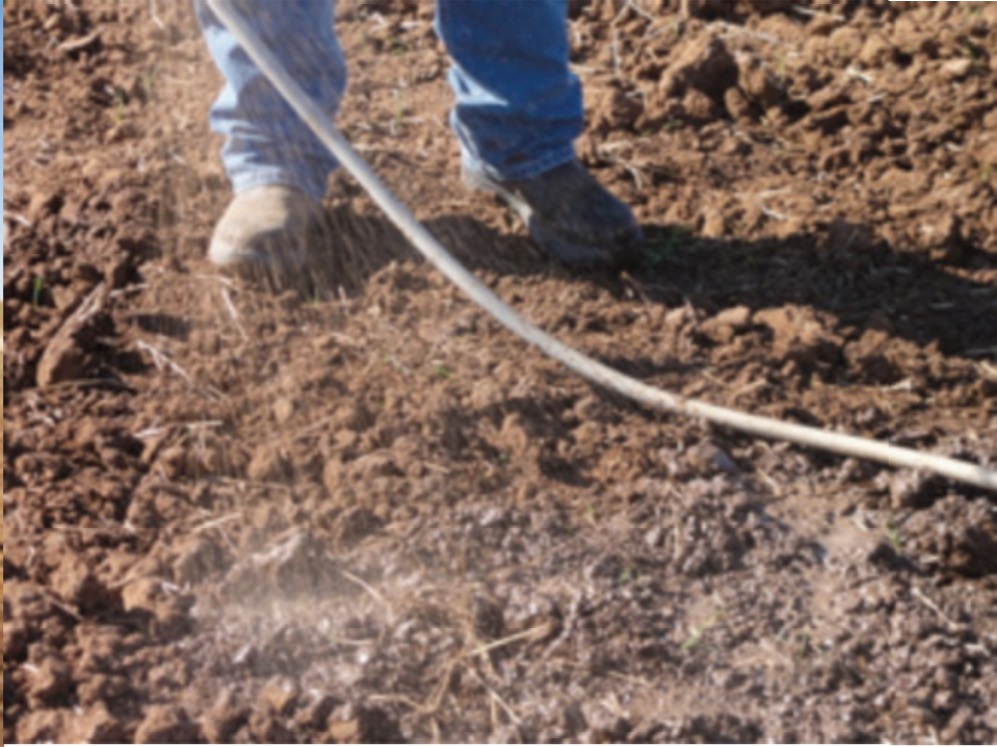
Figure 2b. Close-up: Application of the simulated water-base mud.
Time to recovery and salt leaching
Immediately after application, soil EC levels in the 0-inch to 3-inch layer were extremely high, while the 3-inch to 6-inch layer remained the same as the control soil (Figure 3). On average, the 0 to 6-inch layer had an EC level of about 9 mS/cm, which is detrimental to most plants. Similarly, Figure 4 shows that soil SAR levels were often near the threshold value of 13 at the 0-inch to 3-inch layer immediately after application of WBM. However, when averaged over the 0-inch to 6-inch layer, the SAR was only eight to nine. While this elevated SAR at the immediate surface (about 15) is unlikely to negatively impact growing plants, it could possibly impede germination, depending on soil texture and other properties.
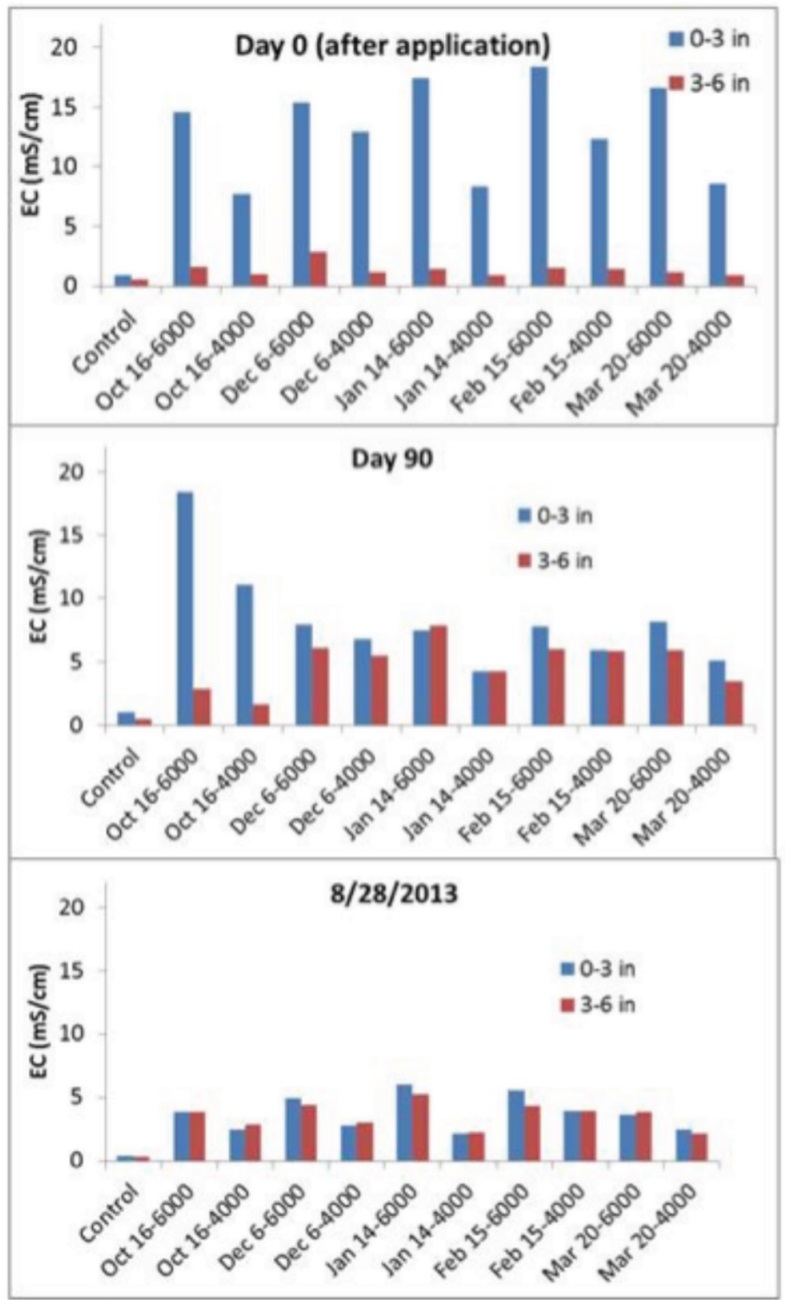
Although application of WBM initially increased soil salt content (EC) and SAR in the surface (0 inch to 3 inches), Figures 3 and 4 show that appreciable rainfall received over the next 90 days (Table 1) led to a quick recovery. Although the average 0-inch to 6-inch EC was greater than 4 mS/cm in most of the plots at day 90, most treatments were less than 6 mS/cm, which is considered to be a more specific threshold for wheat. In general, higher amounts of rainfall received during the 90 day period after WBM application (Table 1) generally resulted in a greater reduction in soil EC and SAR. Note that after 90 days, the 0-inch to 3-inch layer greatly decreased in soil EC while the 3- to 6- inch layer increased as indicated by the red and blue bars coming closer together; this is because the salts in the 0-inch to 3-inch layer leached down to the 3- to 6-inch depth. This was less dramatic for soil SAR (Figure 4). By August 2013 (5 to 10 months after application), nearly all plots were less than the 4 mS/cm threshold (Figure 3). Even the 3-inch to 6-inch depth decreased in EC from Day 90 to August 2013, indicating that salts were leaching downward out of the root zone.
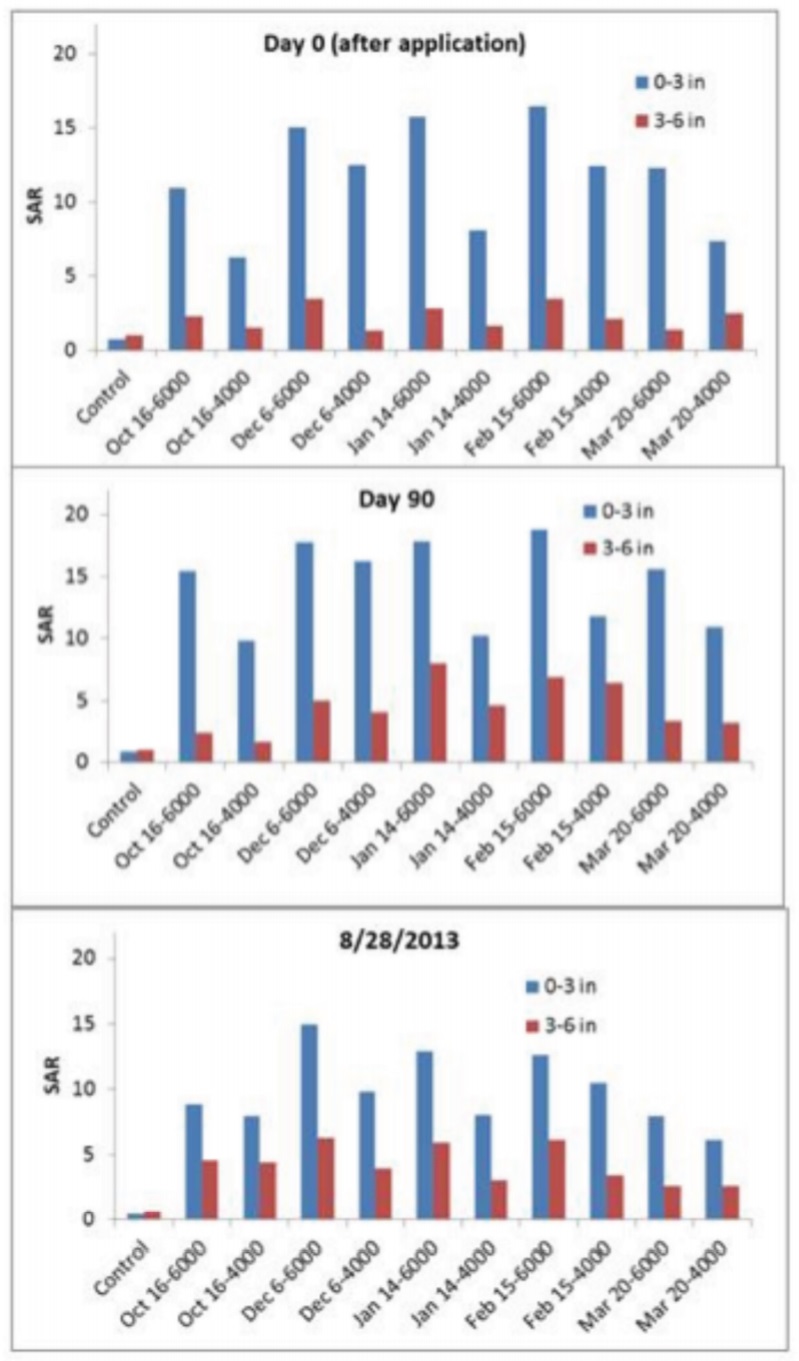
Table 1. Application dates of water-based mud (WBM) to Lahoma wheat plots and the corresponding depth of rainfall received 90 days after application.
|
WBM application date |
90-day precipitation since application (inches) |
|---|---|
|
October 16, 2012 |
0.52 |
|
December 6, 2012 |
4.38 |
|
January 14, 2012 |
6.81 |
|
February 15, 2012 |
8.75 |
|
March 20, 2013 |
9.45 |
The importance of rainfall for soil recovery is clearly evident by observing the application on October 16; after 90 days, there was little change in soil EC and SAR compared to day 0. This is because only 0.5 inches of rain had fallen during that time period. Contrast that to the applications made in January and thereafter; soil EC decreased dramatically within 90 days due to an amount of rainfall exceeding 6 inches.
Impact of application rate on recovery
As expected, plots that received the 4,000 lbs TDS/acre always had lower soil EC and SAR compared to the 6,000 lbs/acre rate (Figures 5 and 6). Although the governing body (Oklahoma Corporation Commission) allows application of up to 6,000 lbs TDS/acre, it will always be better to apply a lower rate of salts by spraying the WBM over a larger acreage.
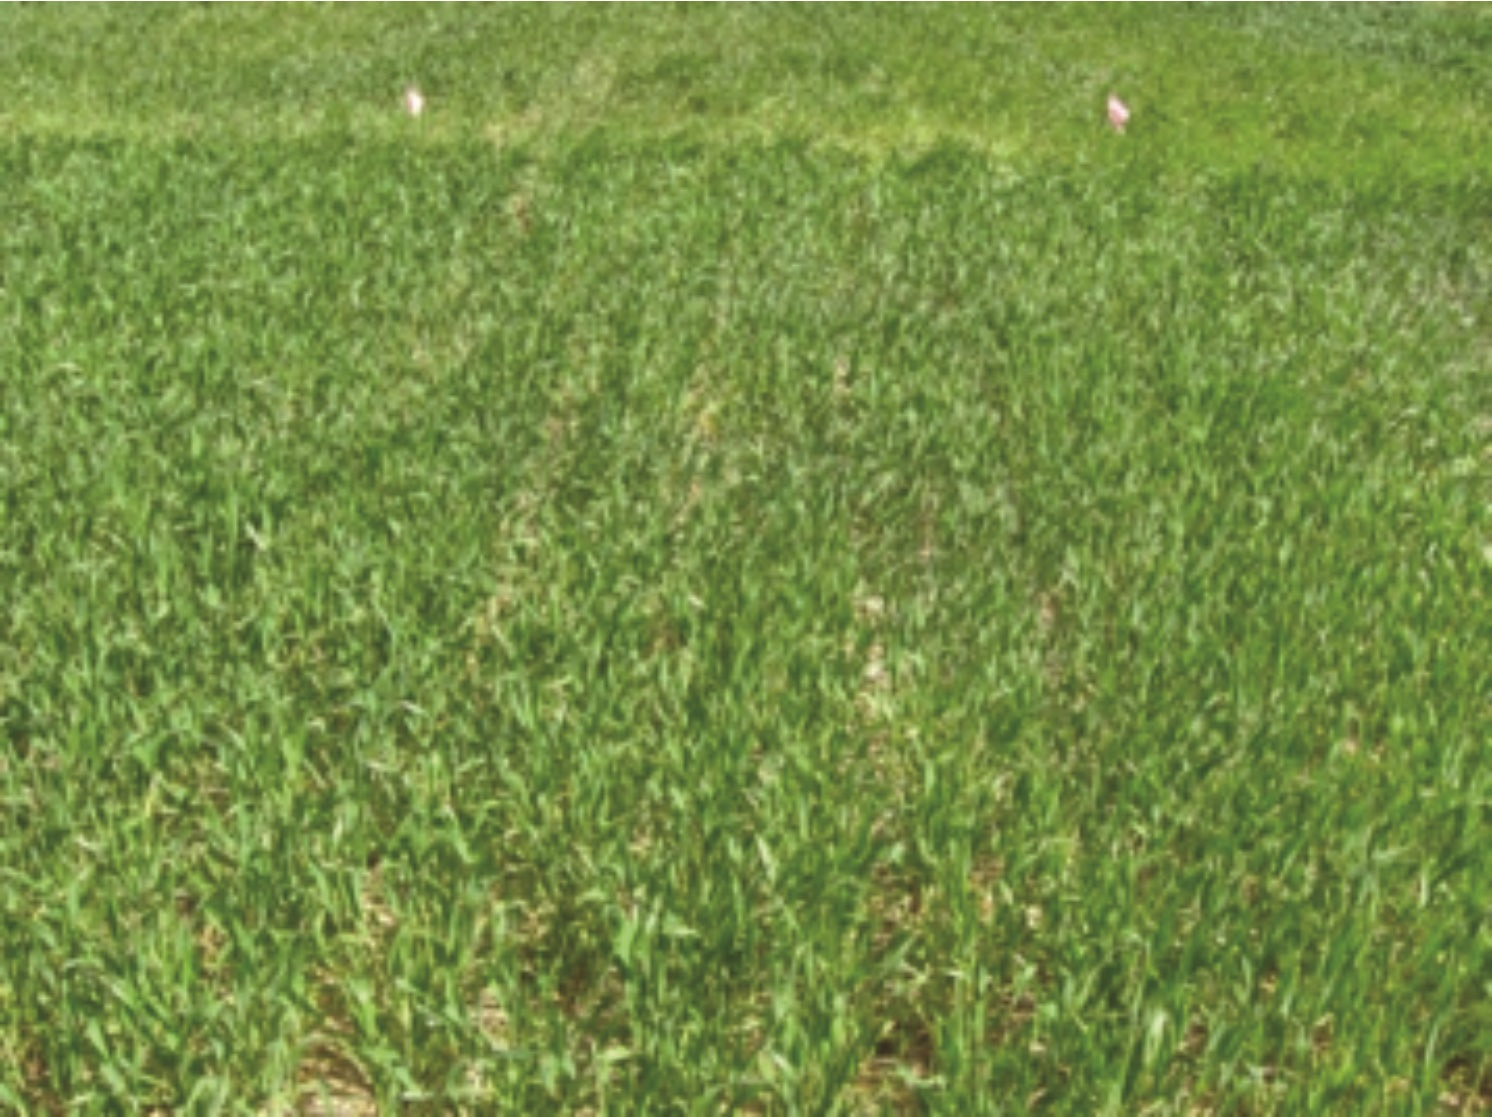
Figure 5. Wheat pictured on April 19, 2013. This plot received water-base mud (WBM) at pre-plant (October 16, 2012).
Impact on final grain yield
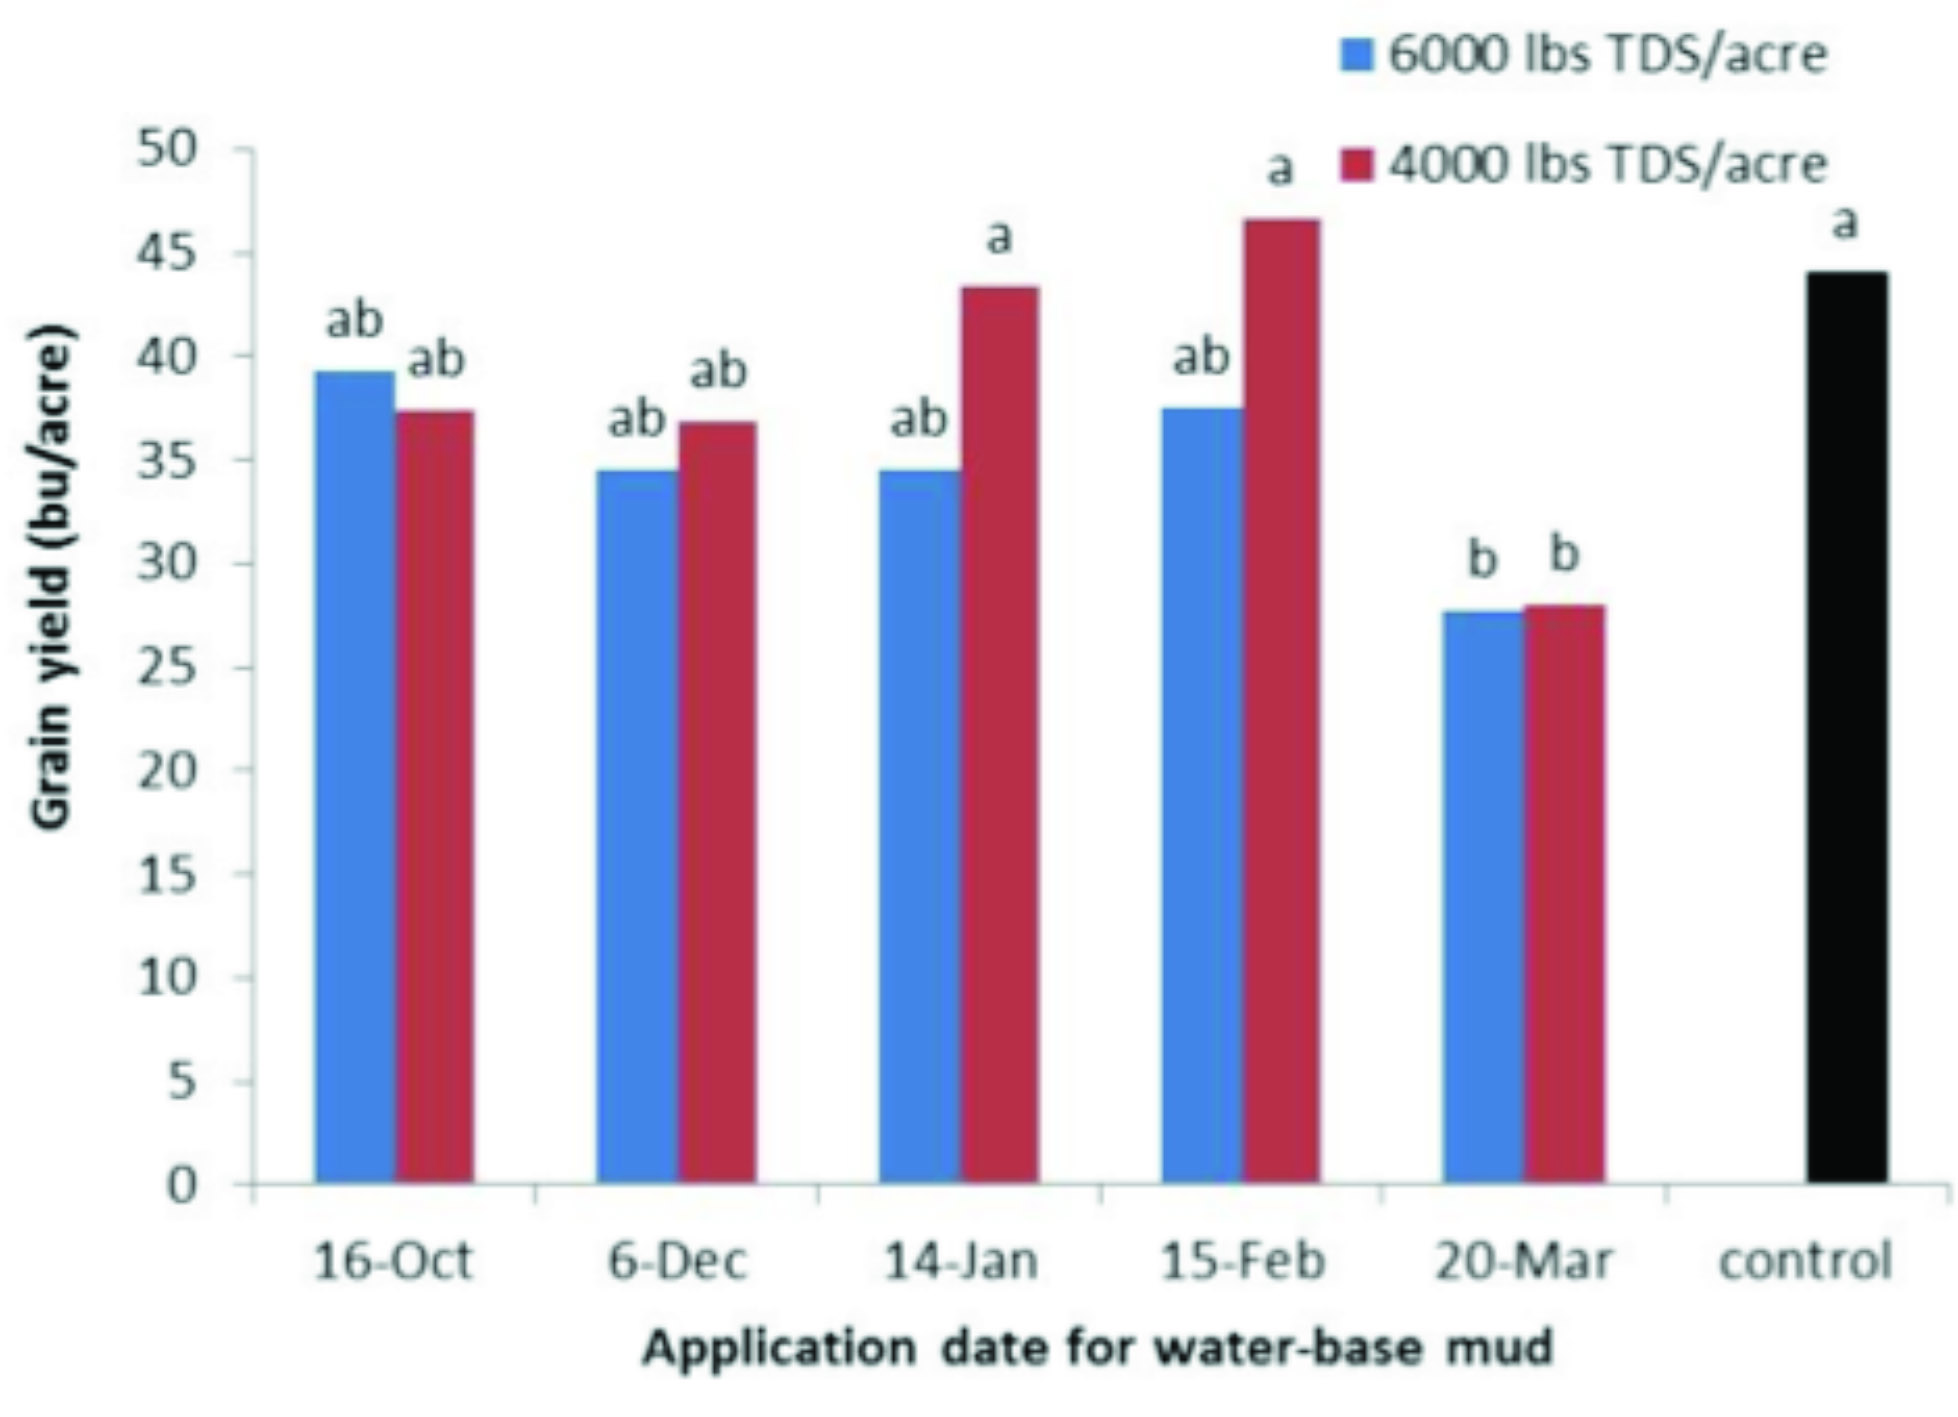
Wheat grain yield was largely unaffected by the application of WBM. Figure 6 shows the resulting grain yield harvested on June 20. Note that treatments which share the same letter are not significantly different from each other. The only significant differences were the following: control (no application) was greater than WBM (both rates) applied on March 20. Also, the 4000 lbs TDS acre-1 applied on January 14 and February 15 were greater than that applied on March 20.
Apparently, the wheat was most sensitive to WBM applications on March 20. At this time the wheat displayed more than two nodes above the surface (approximately Feekes growth stage #7).
Summary
Application of the highest allowable amount of salt (according to the OCC) to a clay loam soil only temporarily increased soil salt levels (EC) in the topsoil beyond general threshold levels. Averaged over 0 inch to 6 inches, soil SAR never exceeded the threshold value of 13, even immediately after application. Rainfall is critical for the recovery of the soil after application of WBM. This allows the salts to leach from the root zone. Soil salt levels were mostly acceptable within 90 days after application of WBM, except in the case when there was very little rainfall. Without rainfall (or irrigation), there can be no recovery. Regardless, the application of WBM had little to no impact on wheat grain yield, except when applied at Feekes growth stage #7. Therefore, it is recommended no WBM application be made to wheat beyond February 15 (approximately Feekes #4), which is prior to the first hollow stem. Application beyond this growth stage is likely to result in a decrease in grain yield. It is important to note that this experiment only tested the chemical impact of WBM applications on wheat. Specifically, landowners should be aware that appreciable wheel traffic from WBM applications may also have a negative effect on wheat growth.
Although the application of 6,000 lbs TDS/acre generally had no negative impact on wheat yield, it is always better to apply WBM at the lowest rates possible. In other words, when a landowner is approached with a proposition to receive a certain volume of WBM, it is in the best interest of the landowner to provide as much area as possible in order to prevent potential problems. Only work with land application companies that have a good reputation among landowners.
Current OCC regulations do not consider the application rate of sodium to the soil through WBM rates; instead, only the background level (pre-application) of sodium is considered via a SAR test. However, depending on the soil texture and WBM salt (EC) and sodium concentrations, application rates of 6,000 lbs TDS/acre could result in exceeding the SAR threshold of 13 in the 0-inch to 6-inch layer. In this context, soil texture is a “double-edged sword.” Specifically, a heavy textured soil (such as the clay loam in the experiment at Lahoma) is generally able to receive a greater amount of sodium without exceeding the threshold SAR level of 13, compared to a light texture soil. On the other hand, if a light texture soil is amended to SAR levels beyond 13, it can recover much faster and display less physical problems compared to a heavy texture soil at an equivalent SAR level.
Chad Penn
Associate Professor, Plant and Soil Sciences
Assistant Professor, Plant and Soil Sciences
