Oklahoma Crabgrass Variety Performance Tests: 2018-2019 Forage Years
Selecting an appropriate variety is important when establishing crabgrass pastures. Crabgrass will re-seed itself year after year; therefore, the selected variety will dictate the potential forage yield and quality for many years to come. Site-specific adaptations, growth morphology (prostate vs. upright growth types) and forage quality are all traits that must be considered when deciding which crabgrass variety to plant.
The purpose of this current report is to quantify the genetic differences in forage yield and quality among commercially available crabgrass varieties grown in Oklahoma. This information can give producers an indication of forage production potential of these various varieties. However, the forage yields reported here are the results derived from a complex interaction of genetic potential, management factors such as planting date, seeding rate, soil fertility and environmental factors, such as temperature and rainfall amount and distribution. These factors vary significantly from location to location and among Oklahoma’s geographic regions, so final forage yield and quality achieved by the farmer will likely be different from what’s reported here.
Site Description and Methods
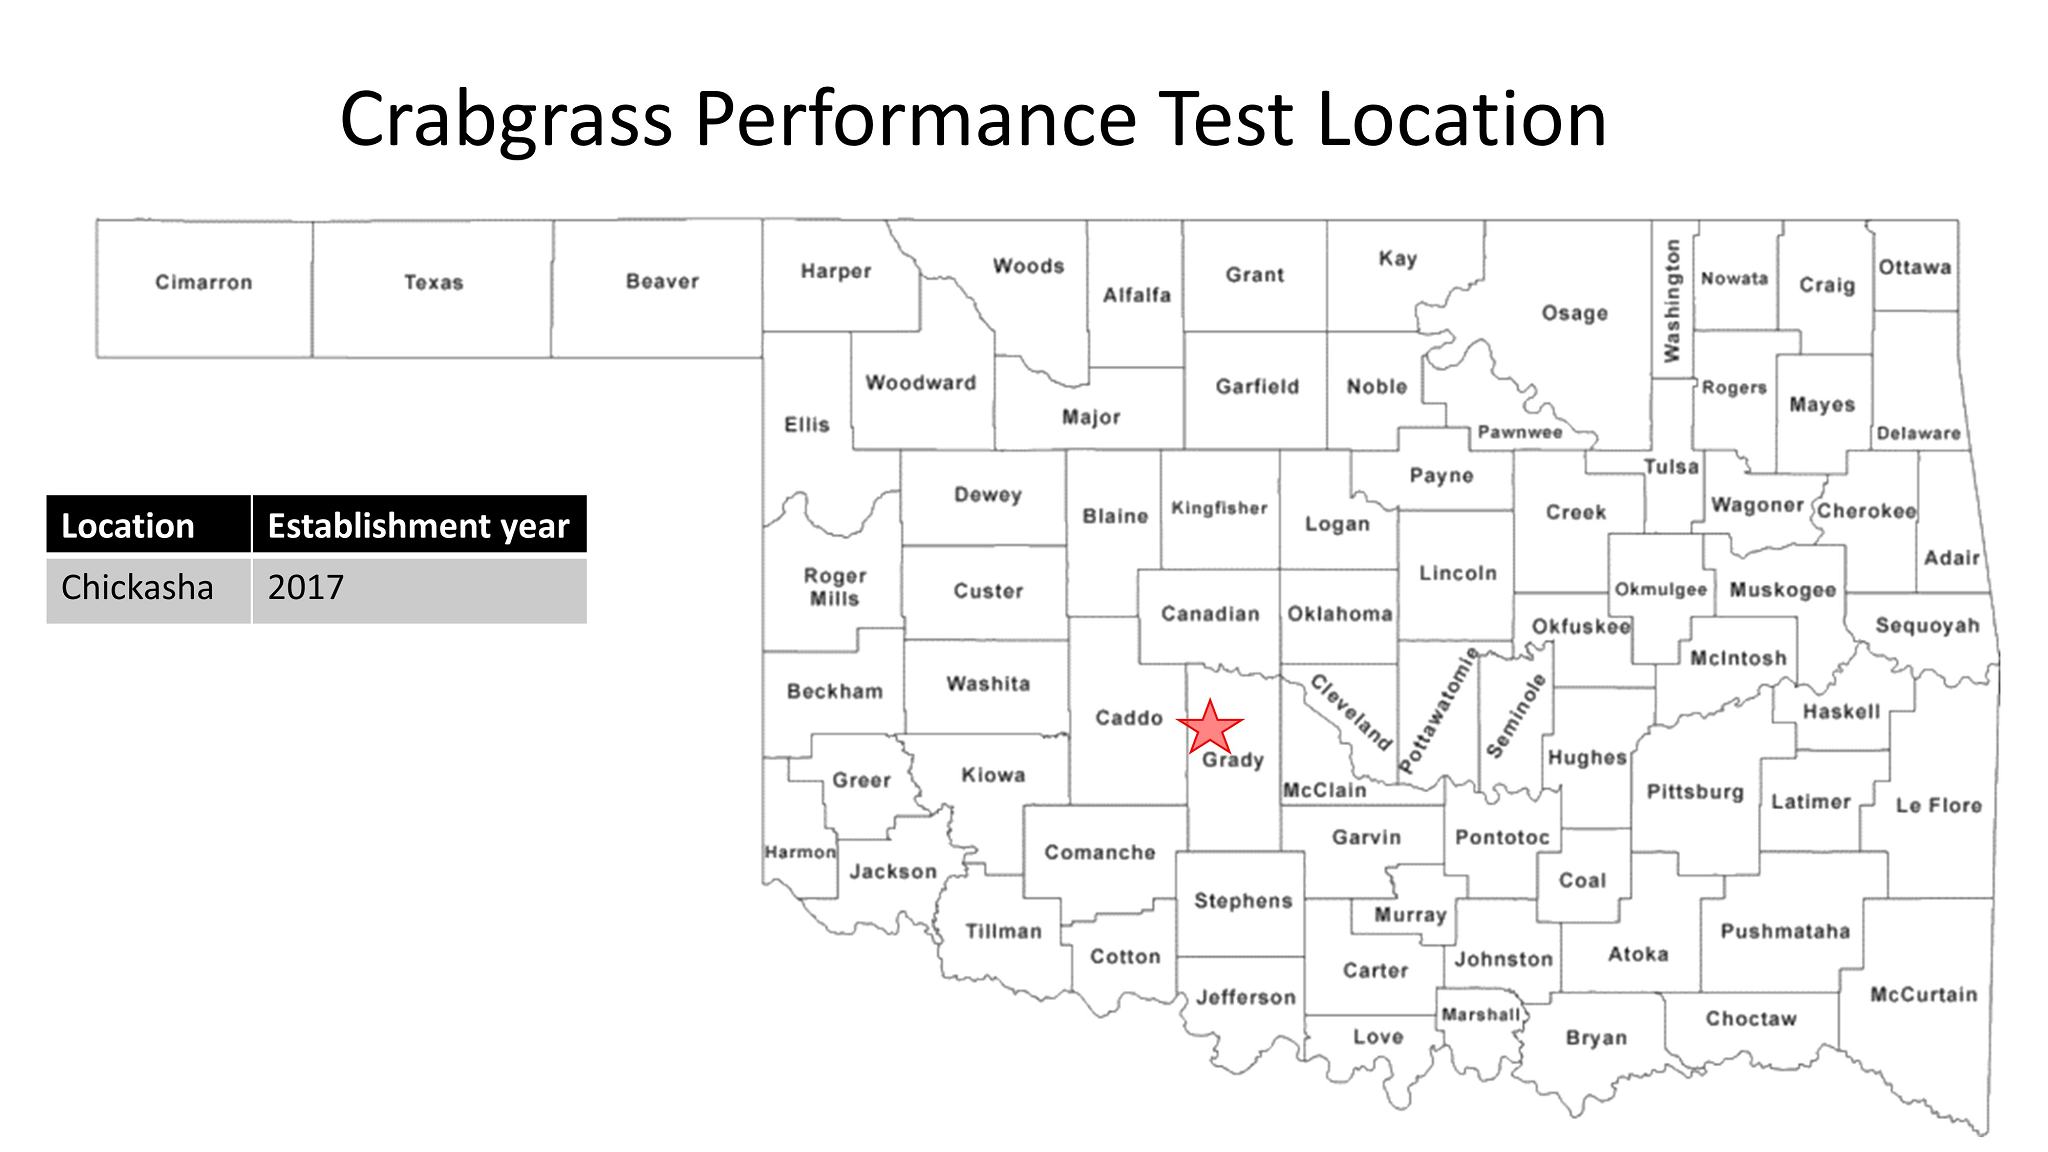
Crabgrass variety performance test was established at the South Central Research Station, near Chickasha in 2018 (Figure 1). Forage yields will be measured in the same plots for at least three successive years. The experimental design was a randomized complete block with four replications. Plots were established in a conventionally tilled, firm seedbed. Soil test results indicated that pH, P and K were sufficient (Table 1). Plots were seeded at 5 pounds of pure live seed per acre, which corresponds to the highest recommended seeding rate among tested cultivars. One-hundred pounds of nitrogen (N) was broadcast as 217 pounds of urea per acre when plants were 3 inches high.
Plots were hand-weeded during the establishment phase to avoid potential herbicide injury. Crabgrass grows aggressively during early spring; therefore, early-season weeds (after crabgrass emergence) were few and controlled by hand weeding.
Forage yield was measured by hand clipping three 1-square-foot quadrats per plot, 1-inch above the soil surface. Plots were mowed and cleaned to simulate hay harvest immediately after sample collection. Samples were oven-dried until constant weight to determine total dry forage yields. Subsamples were sent to the Soil, Water and Forage Analytical Laboratory in Stillwater for crude protein (CP) and total digestible nutrient (TDN) analysis. Forage sampling (cut) every six weeks occurred, which generally results in two cuttings; however, weather conditions such as severe drought and excessive rain postponed some cuts to later dates.
Field Observations and Findings
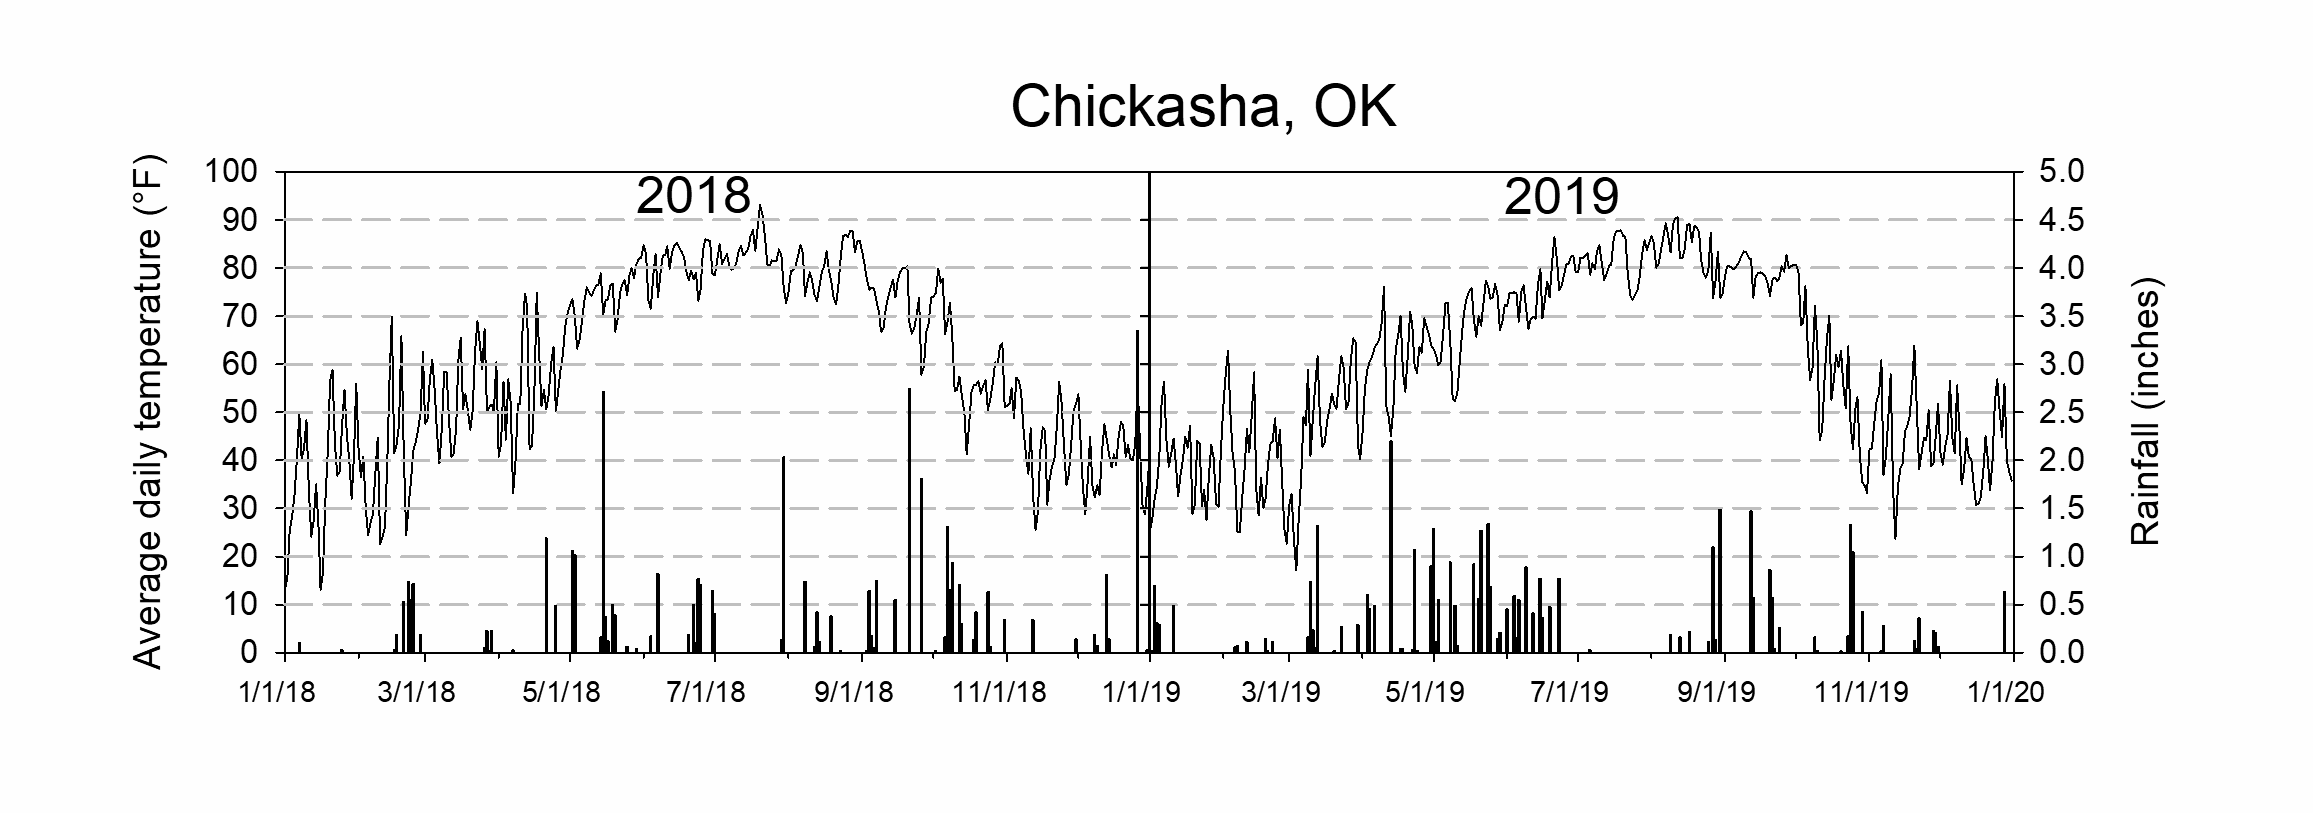
In 2018, appropriate rainfall and temperature after seeding (May 8) resulted in fast seedling emergence. A total precipitation of 7.5 inches allowed excellent crabgrass growing conditions from emergence to seed formation, which took approximately six weeks (May 15 to June 27). Then, an average forage production, CP, and TDN of 2.10 tons per acre, 15.8% and 64.1% were reported for the first cut (June 29). The cultivars Quick-N-Big spreader and Quick-N-Big were the top high-yielding cultivars at the first cut, followed by Dal’s Big River and Red River. However, forage quality analysis based on a single composite forage sample for each variety suggested that the “Quick” cultivars had lower CP and TDN values than the “River” cultivars. As their names imply, the “Quick” cultivars produced taller and higher tonnage forage and achieved maturity seven to eight days quicker than the “River” varieties. Achieving plant maturity at earlier dates might be the leading cause of their reduced CP and TDN values.
After the first cutting, no precipitation and very low soil moisture at 5-centimeter soil depth (www.mesonet.org) were observed for a month (June 30 to July 28) in 2018. This dry soil condition, combined with high temperatures, resulted in the death of the recently cut crabgrass plants. However, 2 inches of rainfall in early August allowed new crabgrass seedling emergence, then an additional 10 inches total precipitation for the next five weeks allowed crabgrass growth during late summer and seed formation in early fall. Finally, a second cut was performed in late October, where all cultivars had similar forage yield, averaging 1.15 tons per acre.
The seeds produced by all crabgrass cultivars in early fall 2018 emerged in late April 2019, alleviating extra costs associated with replanting. Total precipitation of 12 inches in the next six weeks after emergence (May 1 to June 15) allowed excellent growing conditions for crabgrass. However, an additional 2.5 inches of rainfall scattered in the last two weeks of May delayed the first cut to July 2 (eight weeks after emergence). All cultivars had a similar performance at the first cut in 2019. Forage yields averaged 2.1 tons per acre. Crude Protein ranged from 9.6% to 7.2% and TDN values ranged from 59.7% to 56.4%.
As observed in 2018, no rainfall fell for an entire month after the first cutting in 2019; however, soil moisture at the 5-centimeter soil depth (www.mesonet.org) was appropriate for the recent cut crabgrass plants to regrow. After seven weeks of regrowth, all crabgrass cultivars produced seeds and were harvested on Aug. 27. All cultivars had similar yields, averaging 1.08 tons per acre. After the second cutting, plants regrew to a height of 3 inches and ceased growth in October.
Final Considerations
Crabgrass forage yields were similar in both tested years. According to the results, with proper establishment and management, producers can expect about 3.0 to 3.5 tons per acre of forage production annually in south-central Oklahoma if similar weather conditions occur in the future. Cutting crabgrass at six weeks after emergence seems to be a good option because plants are at their peak yield, still hold very good to excellent forage quality and re-seed the pasture. Although postponing crabgrass cutting to eight weeks after emergence did not reduce forage yields, it drastically reduced forage quality. Finally, based on visual observations, harvesting the “Quick” varieties at five weeks after emergence (right after seed formation) rather than at six weeks after emergence might not affect forage yields, but it may increase forage quality.
Acknowledgments
Thanks to Oklahoma Agricultural Experiment Station (OAES) superintendent Michael Pettijohn for assisting field operations such as soil bed preparation, weed/pest control and alley maintenance. The contribution from undergraduate students interns Regina Campbell and Evandro Oliveira is appreciated. Special thanks to R.L. Dalrymple for providing the seeds used in the trial.
Table (a): Crabgrass Performance test – Chickasha, OK
(South Central Research Station, Grady County )
| Entry | Tons Dry Matter/Acre 29-Jun |
Tons Dry Matter/Acre 27-Oct |
Total | CP* | TDN* % |
|---|---|---|---|---|---|
| Dal’s Big River | 1.9 | 1.1 | 2.9 | 16.8 | 64.5 |
| Quick-N-Big | 2.2 | 1.1 | 3.4 | 13.3 | 62.1 |
| Quick-N-Big Spreader | 2.5 | 1.3 | 3.8 | 15.5 | 63.5 |
| Red River | 1.8 | 1.1 | 2.9 | 17.5 | 64.1 |
| Mean | 2.1 | 1.2 | 3.2 | 15.8 | 63.6 |
| 5% LSD | 0.4 | NS | 0.6 | - | - |
Table (b): Crabgrass Performance test – Chickasha, OK
(South Central Research Station, Grady County )
| Entry | Tons Dry Matter/Acre 2-Jul |
Tons Dry Matter/Acre 25-Aug |
Total | CP | TDN % |
|---|---|---|---|---|---|
| Dal’s Big River | 2 | 1.1 | 3.1 | 8.4 | 58 |
| Quick-N-Big | 2.1 | 1.1 | 3.2 | 7.2 | 58 |
| Quick-N-Big Spreader | 2.3 | 1 | 3.3 | 8 | 56.4 |
| Red River | 2 | 1.1 | 3.1 | 9.6 | 59.7 |
| Mean | 2.1 | 1.1 | 3.2 | 8.3 | 58 |
| 5% LSD | NS | NS | NS | - | - |
Design: Randomized Complete Block plot size: 60 x 60 feet harvested
No. of Reps: 4
NS= not significant at p = 0.05
*Crude Protein and Total Digestible values refer to composite samples from first cut in both years.
These data provided by the Plant & Soil Sciences Department of the Division of Agricultural Sciences and Natural Resources of Oklahoma State University. For additional information, contact Alex Rocateli at alex.rocateli@okstate.edu.
Figure 2. Average daily temperature (line graph) and rainfall (bar graph) from Apr. 15 to Oct. 15 in each respective location and year. Weather data courtesy of the Oklahoma Mesonet.
Alex Rocateli
Forage Systems Extension Specialist
Lucas Freires Abreu
Graduate Research Assistant, Forage Systems


