How Are Rural Residents Informed of Community Events?
Introduction
Many organizations including businesses, nonprofits, clubs or social networks are interested in informing community members about upcoming events. However, confusion exists about the best way to reach these constituents. Newspaper? E-mail? Social Media? Website? Many organizations, including the Oklahoma Cooperative Extension Service, have limited marketing funds. Therefore, for budget and time reasons, it is vital to identify the source reaching the largest share of the targeted audience. The question remains, “Which outlet do I choose?”
During the past decade, there has been a notable increase in online media, while offline media such as newspapers experienced sizable declines – especially after 2006 (Bergemann and Bonatti, 2011). However, previous research found that paid advertisement of Extension programs through outlets such as television, radio and newspaper ads were more beneficial in attracting community members when compared to free advertising such as word of mouth, flyers, brochures, community bulletin boards and Extension newsletters (Lockard et al., 2010). Thus, those in Extension and working in rural communities are left grappling with how to best inform the local community about future events and programs.
To answer these questions, a survey distributed as part of the Community Health Needs Assessment (CHNA) program in Oklahoma was a resource. CHNAs allow communities to gather valuable information about their community and needs of their residents. The CHNA is a new requirement for non-profit 501(c)(3) hospitals that submit IRS Schedule H Form 990 – implying that all non-profit hospitals must complete the process every three years. Most of the participating facilities are critical access hospitals, who by definition, are small facilities located in rural communities.
The CHNA process is led by Oklahoma Cooperative Extension Service personnel in collaboration with the Oklahoma Office of Rural Health. The process consists of four community meetings and six deliverables. One particularly important deliverable is the distribution of a community survey. The survey gauges current healthcare usage, potential gaps in service and identifies possible additional health services to offer. In addition, included questions help determine how community members are currently informed of community events, and how they prefer to be informed. The 21 question survey is offered in two formats: hard-copy and online. Each community is given four weeks to gather as many survey responses as they can. Communities are encouraged to gather a comprehensive cross section of responses that represent the community both economically and demographically.
Survey Methodology
Surveys were completed in 12 rural communities in Oklahoma (Figure 1) from March 2013 to June 2014. Hard-copy surveys were distributed at the first community meeting in each community. A total of 100 hard-copy surveys were delivered in each community, and attendees were urged to take extra copies with them to distribute. The survey link for the online version was also made available at the first meeting. Community members who signed in to the meeting received an e-mail following the meeting with a copy of the link to distribute through their local contact lists. A total of 1,863 surveys were collected across the 12 communities for an average of 155 per community. Of those responses, 52.8 percent were derived from the electronic survey offering, and 47.2 percent were collected from the hard-copy paper survey.
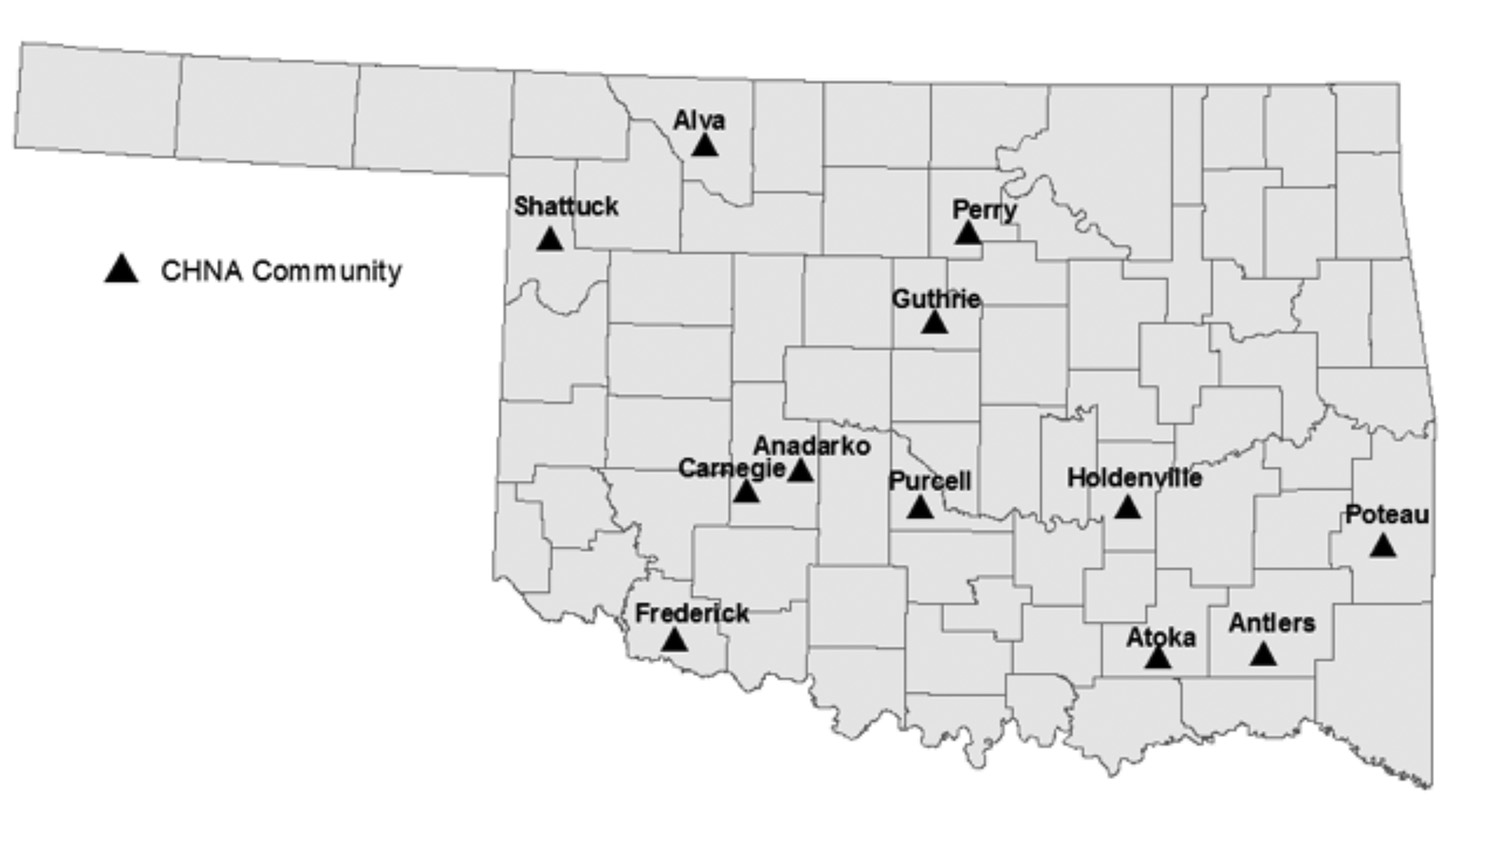
Figure 1. Community Survey Locations.
Tables 1 and 2 display demographic and racial statistics for the 12 communities participating in the CHNA process. Due to space limitations on the survey instrument, questions were not included to gauge demographic or income characteristics of the survey takers. Therefore, demographic and income data are derived from the Census and Bureau of Economic Analysis, respectively. Table 1 also includes population statistics that are an aggregate of the zip codes comprising the medical service area of the hospital facility. Every community had a higher percentage of 65 and older population than the state average, and in some areas, this population accounted for as much as 20 percent of the service area (compared to the 13.5 percent seen statewide). Of the 12 communities surveyed, only two had higher county–level per capita income than the state average. When examining racial trends (Table 2), half of the communities included had a Native American population larger than the state average (8.2 percent). In particular, 35.3 percent of the residents in the Anadarko service area were categorized as Native American. Three communities had a larger Hispanic Origin population than the state rate of 8.9 percent. Specifically, 23.8 percent of the residents of the Frederick service area were of Hispanic origin.
While the primary focus of the survey was on health care in the local community, survey questions were included to determine (1) how community members are currently informed of community events, and (2) how they prefer to be informed. Survey respondents had checkbox options to select all current modes of information that they used (newspaper, social media, website and e-mail); many selected multiple options (average of 1.7 responses per survey).
Table 1. CHNA Community Summary Statistics.
| Location | Place Population1 | County Population1 | Medical Service Area Population1 | 65+ Service Area1 |
|---|---|---|---|---|
| Antlers | 2,453 | 11,572 | 8,516 | 20.2% |
| Perry | 5,126 | 11,561 | 7,854 | 18.8% |
| Guthrie | 10,191 | 41,848 | 26,073 | 14.3% |
| Purcell | 5,884 | 34,506 | 27,497 | 13.7% |
| Anadarko | 6,762 | 29,600 | 16,150 | 14.5% |
| Shattuck | 1,356 | 4,151 | 7,116 | 18.9% |
| Poteau | 8,520 | 50,384 | 27,416 | 14.3% |
| Asoka | 3,107 | 14,182 | 13,250 | 15.8% |
| Alva | 4,945 | 8,878 | 9,836 | 17.7% |
| Frederick | 3,940 | 7,992 | 5,426 | 17.0% |
| Holdenville | 5,771 | 14,003 | 16,907 | 16.5% |
| Carnegie | 1,723 | 29,600 | 6,305 | 19.7% |
| State of Oklahoma | 3,751,351 | - | - | 13.5% |
| Location | County Per Capita Income2 | Total Number of Surveys Collected | Percentage of Surveys via Online Submission |
|---|---|---|---|
| Antlers | $27,781 | 122 | 25.4% |
| Perry | $28,983 | 199 | 67.3% |
| Guthrie | $35,291 | 66 | 78.8% |
| Purcell | $40,117 | 43 | 72.1% |
| Anadarko | $27,018 | 135 | 93.3% |
| Shattuck | $36,756 | 162 | 13.0% |
| Poteau | $26,794 | 260 | 68.8% |
| Asoka | $26,615 | 55 | 0.0% |
| Alva | $31,138 | 85 | 65.9% |
| Frederick | $28,311 | 388 | 42.8% |
| Holdenville | $26,002 | 100 | 42.0% |
| Carnegie | $27,018 | 248 | 58.5% |
| State of Oklahoma | $35,926 |
1 U.S. Census Bureau, 2010 Decennial Census data.
2 Bureau of Economic Analysis, Regional Data, Local Area Personal Income (2010).
Table 2. Primary Medical Service Area Population by Race and Hispanic Origin.
| Location | White | Black | Native American |
|---|---|---|---|
| Antlers | 77.4% | 0.5% | 15.7% |
| Perry | 87.8% | 2.4% | 4.2% |
| Guthrie | 78.5% | 12.1% | 3.2% |
| Purcell | 80.3% | 3.3% | 7.4% |
| Anadarko | 52.9% | 2.4% | 35.3% |
| Shattuck | 91.5% | 0.2% | 1.2% |
| Poteau | 74.0% | 0.7% | 11.9% |
| Atoka | 73.3% | 4.0% | 13.8% |
| Alva | 89.6% | 3.1% | 2.3% |
| Frederick | 73.3% | 8.7% | 3.4% |
| Holdenville | 66.0% | 8.1% | 17.9% |
| Carnegie | 69.3% | 0.8% | 21.9% |
| State of Oklahoma | 68.7% | 7.3% | 8.2% |
| Location | Other | Two or more |
Hispanic Origin |
|---|---|---|---|
| Antlers | 1.2% | 5.2% | 2.7% |
| Perry | 1.6% | 4.0% | 2.6% |
| Guthrie | 1.8% | 4.4% | 4.2% |
| Purcell | 3.6% | 5.3% | 7.4% |
| Anadarko | 2.3% | 7.2% | 8.3% |
| Shattuck | 5.2% | 1.9% | 10.7% |
| Poteau | 7.4% | 6.0% | 10.4% |
| Atoka | 1.6% | 7.3% | 3.1% |
| Alva | 2.7% | 2.3% | 4.3% |
| Frederick | 11.7% | 3.7% | 23.8% |
| Holdenville | 1.8% | 6.2% | 3.6% |
| Carnegie | 2.6% | 5.3% | 7.5% |
| State of Oklahoma | 1.9% | 5.1% | 8.9% |
Source: U.S. Census Bureau, 2010 Decennial Census data.
Survey Results: Current Source of Information on Community Events
Survey results (Figure 2) indicate the local newspaper is the most widely selected medium for respondents’ current source of information (42 percent), more than double the next most selected option, social media (20 percent). While newspaper readership has been in decline, a 2010 survey for the National Newspaper Association still showed that 73 percent of respondents read a local newspaper every week (Fleming and Steffens, 2011). This popularity is particularly true for small communities throughout the U.S. Research by Fleming and Schwartz (2014) revealed that in areas where the circulation size of the local newspaper was 15,000 or less, more than two-thirds of residents read their local newspaper. Forty-two percent of respondents from these small communities said their primary source of information was the “newspaper” and “newspaper’s website,” which is identical to CHNA respondents from the 12 communities surveyed across Oklahoma.
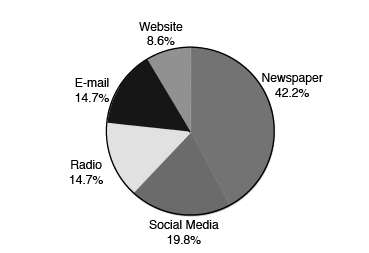
Figure 2. Current Source of Information.
The high rate of newspaper readership among CHNA respondents may be due in part to the “small town” atmosphere that rural communities cultivate. The local newspaper is often viewed as the source to learn about local issues such as deaths, births and how the high school football team’s season is progressing. Local newspaper writers have the ability to report in ways that illustrate they are also a part of the community, which may contribute to the sense of trust in the local newspaper (Fleming and Schwartz, 2014).
Figure 3 analyzes respondents’ current source of information in relation to their method of submitting their survey (either paper [hard-copy], or electronic [web survey]). Regardless of survey submission method, survey respondents overwhelmingly indicated that their dominant source of information on community events is the local newspaper. Even among those who submitted the survey electronically (and may have a preference for online information), the preference for the newspaper was nearly two to one.
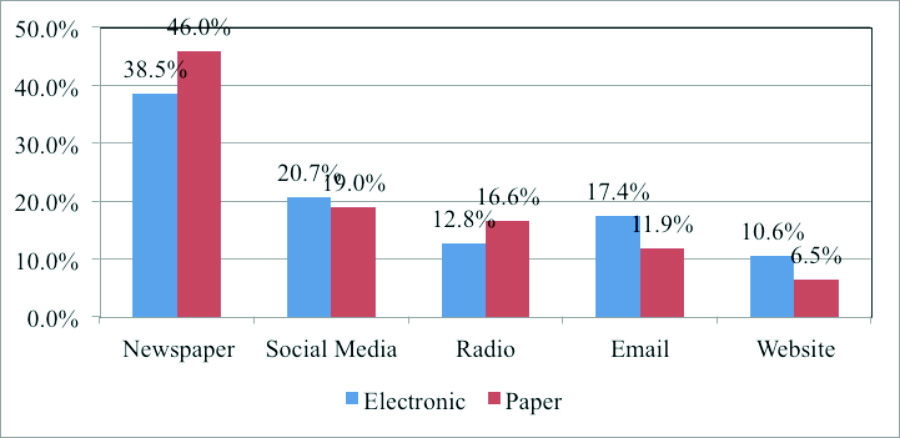
Figure 3. Current Source of Information in Relation to Submission Method.
Figure 3 demonstrates that respondents who submitted paper surveys were more likely to gain information from traditional outlets, such as the newspaper (46 percent vs. 38.5 percent) or radio, comparted to those who chose to submit online. Similarly, respondents who submitted their surveys online were more likely to select options such as e-mail (17.4 percent vs. 11.9 percent), social media (20.7 percent vs. 19.0 percent), or websites (10.6 percent vs. 6.5 percent) compared to those who submitted paper copies.
The CHNA survey did not distinguish between traditional, hard-copy newspapers and more recent online versions of those newspapers. However, some research has suggested that online versions, while not dominant, are still utilized by a minority of community residents. Survey results of the small communities from Fleming and Schwartz (2014) showed 49 percent of online users chose the local newspaper’s website for local information. Of the 12 communities presented with the CHNA survey, only four (Anadarko, Shattuck, Frederick, and Carnegie) do not provide online offerings of their local newspaper. Of the eight communities with online offerings, two communities provide free online newspaper viewing and six communities charge a subscription to access online content. Fleming and Schwartz (2014) note that 14 percent of users paid to view online newspaper content, which rose from 6 percent in 2012. This suggests local communities still find value in the newspaper despite many implementing paid-content formats. Additionally, electronic survey respondents may be more likely to access their local news online.
Survey Results: Preferred Source of Community Event Information
As previously noted, survey respondents were also asked how they prefer to be informed of community events. Survey respondents ranked (1=most favorable; 5=least favorable) their preferences of newspaper, radio, e-mail, website and social media. Survey respondents’ number one choices were aggregated to determine the preferred source of information (Figure 4).
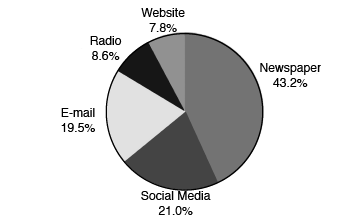
Figure 4. Preferred Source of Information.
Similar to the results of current sources of information, survey respondents indicated their preferred source of information was the newspaper (43 percent). Social media (21 percent) and e-mail (19 percent) were the next most commonly selected preferences. Radio and website were the least selected options, accounting for 9 percent and 8 percent, respectively. The 43 percent of the respondents who preferred the newspaper as their source of information closely mirrors the national study by Fleming and Schwartz (2014) that found 47 percent prefer their paper.
The vast preference for the newspaper may be due in part to demographic factors, such as age. As previously noted, the communities that completed CHNA surveys have a large 65 and older population, when compared to the state. The Newspaper Association of America has reported that adults 55 and older have the highest audience readership percentages among age categories, including weekly newspapers that are often characteristic of small communities (Scarborough Research, 2013). In fact, more than 72 percent of adults 55 and older read the weekly paper, compared to only 49 percent of adults between the ages of 18 and 34 (Scarborough Research, 2013). The three most important areas of content for this age group are community information, obituaries and information about ordinary people (Fleming and Schwartz, 2014).
Figure 5 analyzes respondents’ preferred source of information in relation to their method of survey submission. Similar to the survey results for current sources (Figure 3), survey respondents overwhelmingly indicated they prefer to receive information about community events via the newspaper regardless of survey submission method (48 percent of paper submissions; 41 percent of electronic submissions). Social media was the next most commonly selected preference for both paper and electronic submissions, with 18 percent and 25 percent, respectively. E-mail accounted for the third highest preference with 17 percent of paper submissions and 19 percent of electronic submissions. Radio and website were the least selected options, accounting for 10 percent or less each.
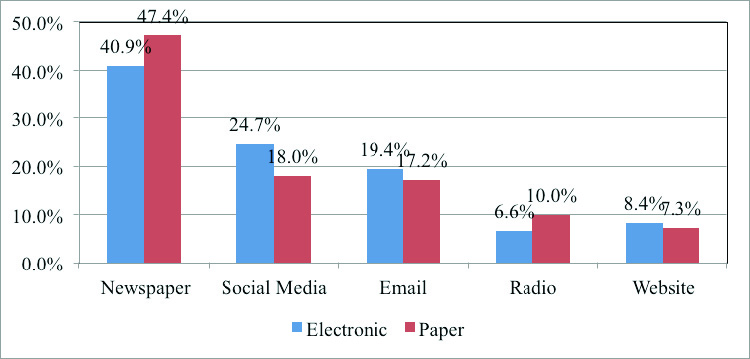
Figure 5. Preferred Source of Information in Relation to Submission Method.
Again, individuals who completed their survey via hard copy showed a preference for newspapers or radio, while those completing online surveys were more likely to select social media, e-mail or website.
Conclusions
Rural community members in Oklahoma value the information they obtain through their local newspapers. Even when provided the opportunity to select preferences, the local newspaper is still the most preferred source. This information is valuable in terms of marketing and promoting community events, including those offered by the Oklahoma Cooperative Extension Service. Utilizing the availability and scope of the local newspaper seems to be the most effective way to reach rural audiences to make them aware of events in their community. It should be noted, however, that social media was the second most preferred source of information by both electronic and paper respondents, with e-mail communication a close third. Thus, a marketing plan including both traditional and electronic media may be the most effective way to distribute information regarding local events to rural communities.
References
Bergemann, D. and A. Bonatti. 2011. Targeting in Advertising Markets: Implications for Offline Versus Online Media. The RAND Journal of Economics. 42(3): 417-443.
Fleming, K. and B. Steffens. 2011. Annual report of readership: Small-town residents read, trust and pay for their local newspapers. Reynolds Journalism Institute University of Missouri. February 27, 2014.
Fleming, K. and S. Schwartz. 2014. National Newspaper Association Survey: Small town residents depend on their community paper. Reynolds Journalism Institute, University of Missouri. February 27, 2014.
Lockard, M., B. Petty, J. Peutz, M. Spencer, R. Lanting, and H. Shaklee. 2010. Working Smart: Increasing the Reach of Extension Programming Through Media Advertising. Journal of Extension. 48(1).
Scarborough Research. 2013. Newspaper media audience 2012 by gender & age group. Newspaper Association of America. March 2013.
Lara Brooks
Extension Associate
Grant Irby
Graduate Student, Health Promotions
Brian Whitacre
Associate Professor and Extension Economist
Corie Kaiser
Director, Oklahoma Office of Rural Health
