The Evolution of Reference Strips in Oklahoma
- Jump To:
- Introduction
- The History of Reference Strips in Oklahoma
- The N-Rich Strips (NRS)
- The Calibration Stamp Technology (CST)
- The First Ramp Calibration Strip
- The Ramp Calibration Strip second generation
- Producers Ramp Calibration Strip (PRCS)
- Initial Situation and Recent Status of the N Rich Strips in Oklahoma
- References
Introduction
Under- or over-application of nitrogen (N) fertilizer is a common practice throughout the world and it is difficult to detect the economic and environmental impacts without an on-site calibration system during the growing season. This misapplication may result in low yields and loss of profit or high fertilizer expense with no increase in yield. Over-application can also result in contamination of the water that we and our animals drink. Reference strips have become an integral part of correctly determining the appropriate amount of N needed by the crop mid-season. The use of sensors to determine N rates would be impossible without the use of reference strips. Reference strips provide us with the ability to determine if crop response was due to nitrogen in that field for that season.
The History of Reference Strips in Oklahoma
There have been a few versions of reference strips since the introduction of the GreenSeeker™ sensor (developed at OSU in 2001) in Oklahoma. These are; the N-Rich Strip (NRS), Calibration Stamp Technology (CST), the first and second generation Ramp Calibration Strip (RCS), and Producer Ramp Calibration Strip (PRCS). These reference strips are presented in the order of their introduction. Each change or adaption was preformed as a solution for minor or major usage problems faced by farmers. The goal of Oklahoma State University in developing different versions of strips was to ease application, allow visual evaluation, and improve the Sensor Based Nitrogen Rate Calculator (SBNRC). The goal of using SBNRC is to increase yield, optimize input, preserve environmental health, and to increase economic return.
The N-Rich Strips (NRS)
The N-Rich Strip concept was first introduced in 1990 by Dr James Schepers at the University of Nebraska, Lincoln. The strip consists of one rate of N fertilizer applied over the top of the farmer preplant practice across the length of the field. The vegetative difference between the NRS and farmer standard practice (FP) provides a key to determine if topdress N is necessary to reach maximum yield. However the actual amount of topdress N required to achieve maximum yield is unknown. A better solution is to use the hand held Green-Seeker™ sensor in combination with a reference strip for the prediction of yield and N status. Work by Stone et al. (1996) documented the benefits of this approach, but using passive sensors (which rely on external light), not the active sensors (which provide their own light source) employed today. The N-Rich Strip technology is now widely used in Oklahoma, across the U.S., and has been extended in many countries around the world. The NRS is the first reference strip introduced to producers and is still the most widely used. The reason likely goes back to the simplicity and ease of the approach.
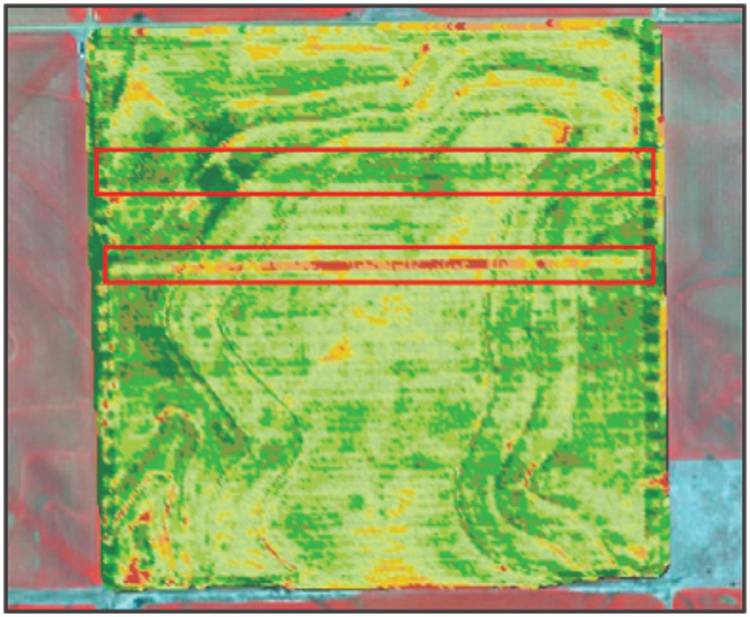
This IKONS NDVI image is of a field with a Nitrogen Rich Strip and a strip that received zero phosphorous. The strips are placed in the field to measure response to fertilizer.
The Calibration Stamp Technology (CST)
The Calibration Stamp Technology was the first multiple N rate reference strips developed. The Stamp had five rates of N placed in a checker board pattern that had nine squares with all four corners getting zero N. Each square was 3.2 ft by 3.2 ft so the total size of the stamp was 9.6 ft by 9.6 ft. The fertilizer was applied by using an automated sprayer that used compressed air for the delivery system and was mounted on an ATV (Raun et al; 2005). For mid-season topdressing of N fertilizer, the square with the greenest, tallest forage was where the least amount of N had been applied, and was the recommended rate for the rest of the field. This method was never adopted by farmers. They expressed concerns that the stamp was too small to evaluate the difference between the rates. The producers requested bigger areas of different N rates which helped them to detect differences either visually or by using the GreenSeeker TM sensor.
The First Ramp Calibration Strip
The First Ramp Calibration Strip was developed to make the visual evaluation of crop response at different N rates simpler than CST. This strip is composed of multiple rates of N fertilizer, applied in a long strip where the N rate changes every 10 feet from the lowest rate at the center (0 lbs N/ac) to the highest rate in opposite ends with a constantly increasing rate between (Raun et al; 2005). The Ramp Calibration Strip had a total length of 320 ft. Starting at 0 pounds of applied N and walking out to the greenest plot was the method to find the best rate of N applied and the remaining in-season N needs. This RCS was used to determine the N fertilizer required across fields by having two similar rates at different points in the field. By having multiple high N reference points in the field, a more reliable recommendation could be made versus a single sample (Edmonds et al; 2008). This also helped account for the variability of the crop in the field. However, this type of strip was criticized for being too large. As a result a second ramp calibration strip was introduced.
The Ramp Calibration Strip second generation
The primary difference between the second generation RCS is the area it covers. The second RCS is 150 ft shorter and it is recommended that at least two strips should be placed in each field. The rate of N applied is from the highest to the lowest rate (0 rate) on one side and that maximum rate is again repeated immediately on the side of the initial benchmark of the lowest (0) rate. Ramp Calibration Strips are very popular and are an excellent education tool. However in fields with highly variable soils, the RCS have proven to be less reliable than the NRS. The RCS is still the choice of many producers and many have had great success using the approach. In fact, there are several homemade calibration ramp apparatuses currently in use.
Producers Ramp Calibration Strip (PRCS)
The idea for this RCS came from a farmer during a field day at Lahoma, OK in 2006. He asked “Can I nozzle my spray boom to run three to four rates across the boom?” The idea was immediately supported and implemented in farmer fields. This strip is different from the previous two ramps in the alignment (orientation) and position of rates applied. The strips of each rate run parallel to the driving direction. The lowest rate is on one side of the boom/strip with increasing N rates every three to four nozzles so the highest rate is on the opposite side. The evaluation of RCS for the optimum N rate is similar to the other ramps except for the physical arrangement of the treatments (strips) in the field. In addition, the high rate is also equivalent to an NRS, and can be treated as one in the SBNRC.
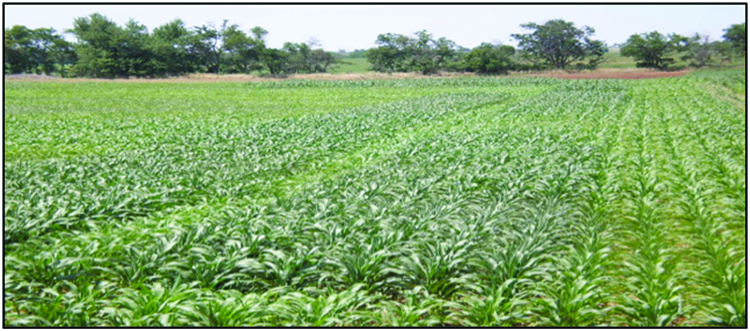 Ramp Calibration Strip applied preplant in corn V 8. Rates ranged from 0 to 170 pounds
N Ac–1 in 10 lb increments, and where rates started with 15×, dropped off to 0×, then
increased every 10 feet back up to 15×.
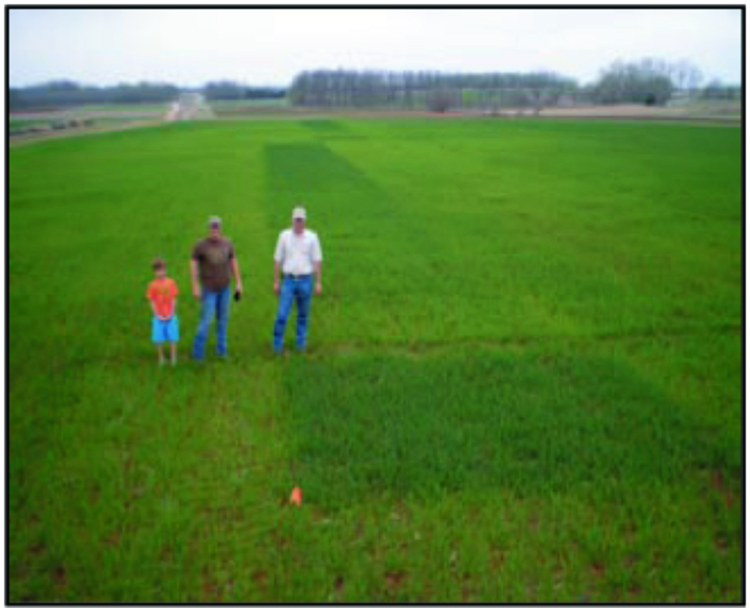
Wheat N-ramps at Stillwater, Oklahoma. High N rate (approx 200 pounds N/acre) in the foreground followed by 0 N rate, ramping back up to the high N rate in the background (Edmonds et al; 2008).
Rate design of the first generation ramp with and a zero N check in the middle.
A sprayer nozzled to deliver multiple N rates, from a low to a high rate (N-Rich Strip). This technique combines the idea of the Calibration Ramp Strip and N-Rich Strip.
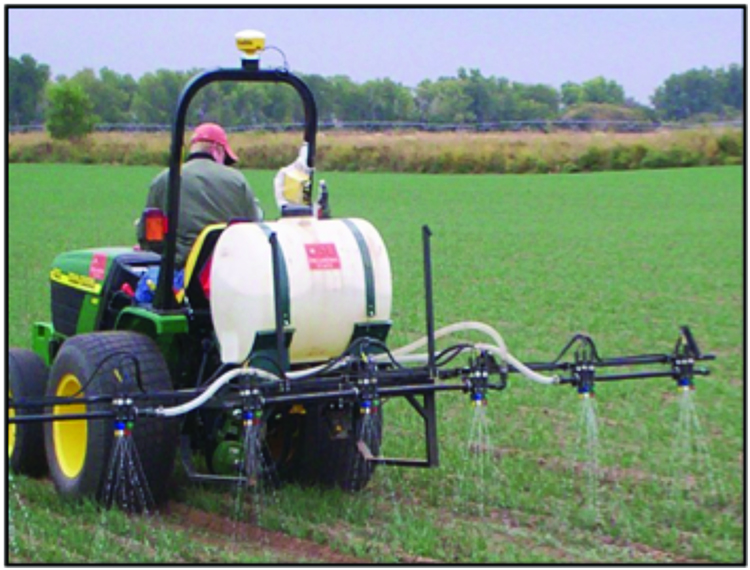
The applicator used by OSU to apply both first and second generation ramps in producer fields.
Rate design of the second generation ramp with both ends receiving maximum N, but where the ramp was one sided.
Initial Situation and Recent Status of the N Rich Strips in Oklahoma
Many producers failed to embrace reference strips early on because of lack of exposure to, and awareness of the technology and, of course, apprehension. In fact, the RCS and the sensor based technology of managing N are by far better than what many producers are currently practicing (Dr. Randy Taylor-http://nue.okstate.edu/Index_RI.htm ). Now, following extensive OSU efforts with producers, the acceptance of this technology has dramatically increased. Furthermore, producers have responded positively because of the documented economic benefits between using strips and their previous practices where N response was not monitored each year.
From 1998 to 2003, strips were placed in 62 locations across Oklahoma in an effort to test and extend the concept. Since then, the number of strips on-farm in Oklahoma has dramatically increased as farmers realized its economic benefit. In 2004, the number of N-Rich Strips in farmer fields increased to more than 300. In 2005, the number of N Rich Strips supported by the Sensor Based Nitrogen Rate Calculator (SBNRC) radically increased to more than 1,000. In 2006, there were 568 ramps applied by OSU in farmer fields and 1,500 N rich strips put out by one fertilizer dealer alone. Approximately 230,000 acres of land in Oklahoma were under N Rich Strip management due to the efforts of OSU in collaboration with Extension specialists and others to extend the technology and show the public the potential benefits.
Throughout 2006 and 2007 the ramp/strip program was implemented in about 25 Oklahoma counties. Since 2008 the number of reference strips applied by OSU has been reduced, while fertilizer dealer and farmer participation increased. The reduction in OSU’s activity was primarily due to the increasing involvement of farmers. Nitrogen rich strips in farmer fields grew to 4,000 in 2008-2009 through the joint efforts of OSU, Extension, industry, and farmers. At this point the exact number of acres in Oklahoma on which this approach is utilized is not known, since so many producers are using the practice with little or no assistance from OSU.
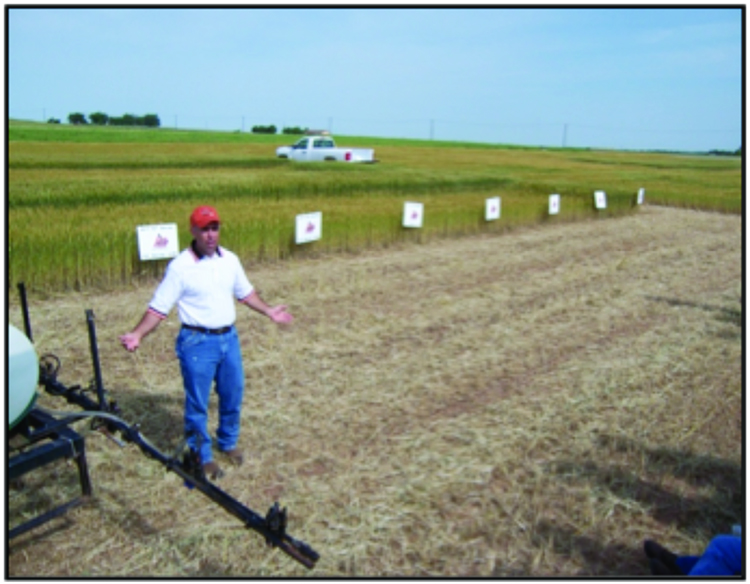
Dr. Randy Taylor asks producers, “Is it better than what you are doing today?” Many producers embraced this approach, given the prices of fertilizer N, and the reality most have not changed their fertilizer N practices in more than 30 years.
For more information on Reference Strips please consult:
Websites:
www.nue.okstate.edu
www.npk.okstate.edu
CR-2255 Reference Strip Series: Applying your Nitrogen-Rich and Ramp Calibration Strips. 2008. Oklahoma Cooperative Extension Service, Oklahoma State University, Stillwater, OK.
PT 2005-3 Get Your Nitrogen-Rich Strips Out Early.
January 2005, Vol.17, No. 3, Departments of Plant & Soil Sciences and Biosystems
and Agricultural Engineering, Division of Agricultural Sciences & Natural Resources.
PT 2003-12 2 LB. Nitrogen per Bushel of Wheat May Be Wrong.
July 2003, Vol.15, No.12, Department of Plant & Soil Sciences, Division of Agricultural
Sciences & Natural Resources.
PT 2003-7 Developing and Using Nitrogen-Rich Strips.
April 2003, Vol.15, No.7, Departments of Plant & Soil Sciences and Biosystems and
Agricultural Engineering, Division of Agricultural Sciences & Natural Resources.
PT 2002-19 A New Fertilizer Management Strategy: Nitrogen Rich Field Strips and Variable
Rate Application.
July 2002, Vol.14, No.19, Departments of Plant & Soil Sciences and Biosystems and
Agricultural Engineering, Division of Agricultural Sciences & Natural Resources.
PT 2002-21 Managing Nitrogen Fertilizer Using a Nitrogen Rich Strip Projected Profitability. July 2002, Vol.14, No. 21, Departments of Plant & Soil Sciences and Biosystems and Agricultural Engineering, Division of Agricultural Sciences & Natural Resources.
PT 2001-18 Using a Response Index to Improve Nitrogen Management for Winter Wheat. July 2001, Vol. 13, No. 18, Department of Plant & Soil Sciences, Division of Agricultural Sciences & Natural Resources.
References
Edmonds, D. E., M. C. Daft, W. R. Raun, J. B. Solie, and R. K. Taylor. 2008. Determining MId-Season Nitrogen Rates with Ramp Calibration Strip Technology. Better Crops. 92:16-17.
Raun ,W. R., J. B. Solie, R. K. Taylor, D. B. Arnall, C. J. Mack, and D. E. Edmonds.2008. Ramp Calibration Strip Technology for Determining Mid-season Nitrogen Rates in Corn and Wheat. Agron. J. 1000:1088-1093.
Stone, M. L., J. B. Solie, R. W. Whitney, B. R. Raun and A. L. Less.Use of Spectral Radiance for Correcting in Season N Deficiencies in Winter Wheat. TRANSECTIONS of the ASAE, 39(5):1623-1631. ASAE, St.Joseph,MI.
Birehane Desta
Graduate Research Assistant
Brian Arnall
Assistant Professor
Bill Raun
Regents Professor, Soil Fertility


