Stocking Rate Determination on Native Rangeland
Introduction
No other single management practice other than fire affects livestock production or wildlife habitat more than livestock stocking rate. A proper stocking rate is defined as balancing the needs of the plants with the needs of the animals. However, it is important to remember that stocking rate is mainly driven by the amount and distribution of precipitation received each year, which is also the driving factor in forage production. Because of this variability, stocking rate is a moving target from year to year, and must be adjusted regularly. Regardless of variability in forage production, the proper stocking rate for your ranch depends on your objectives and your management focus (e.g. cattle production, wildlife habitat). For some wildlife species, you cannot optimize cattle production and wildlife habitat at the same time. Native forages provide year-round grazing because they are made up of a diversity of grasses, forbs, legumes, and woody plants that grow both in the winter and summer. This publication addresses stocking rates on native forages only.
Stocking Rate Effects on Livestock Production
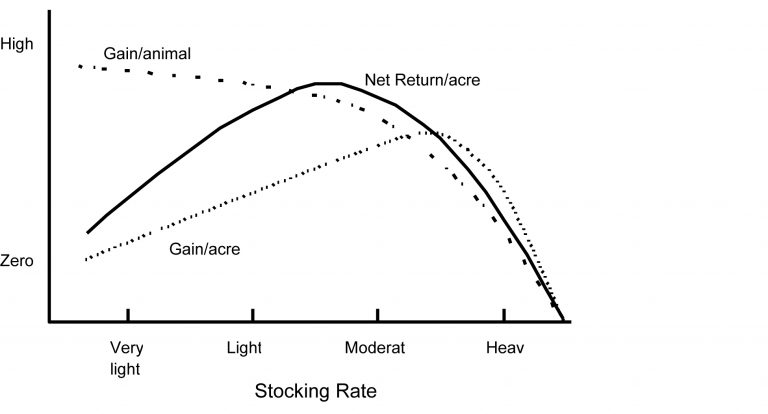
Stocking rate can influence several factors: plant composition, forage production, erosion, and livestock production. Stocking rate also has a major impact on animal performance and overall profitability of the livestock production system. Figure 1 indicates that maximum individual animal performance occurs at light stocking rates because there is little competition for the best forage plants. As stocking rate is increased beyond moderate levels (optimum), animal performance is reduced because of increased competition among livestock. The opportunity for diet selection afforded by low to moderate stocking rates ensures that individual animal performance is maximized. Figure 1 also indicates that as stocking rate increases, the amount of weight gain produced per acre is increased up to the optimum threshold and then declines sharply. Ranchers who continually use heavy stocking rates in an attempt to improve net profitability should realize that they have already passed the point at which maximum net return will be realized because of increased costs (such as herbicide, protein supplements, and hay) that are not offset by production increases.

Figure 1. Effects of stocking rate on livestock performance and profitability.
An additional problem with long-term overstocking of native forages is the overuse of palatable species that results in an increase of less palatable or unpalatable plants and a reduction of fine fuel, which will eliminate the ability to use prescribed fire. Without fire, woody plants will increase rapidly. As the incidence of these undesirable plants increases at the expense of the more desirable forage species, animal performance will decline and the number of cattle that the ranch will support will decline. This situation is called overgrazing because of a change in forage species as the result of the improper use. The results for the rancher are decreased profitability from livestock, the increased likelihood of having to feed hay, and often results in the perceived need of herbicide applications to remove undesirable species, a consequence of mismanagement.
What Does Proper Stocking Look Like on Native Rangeland?
The same stocking rate will look different depending on the type of grazing system used. The type of grazing system used will impact livestock production and wildlife habitat, and some grazing systems may not be compatible with some objectives. Table 1 includes a list of common grazing systems and their effect on livestock production and wildlife habitat. The more diverse the habitat structure and composition is, the better the grazing system is for wildlife in general. Also a more diverse plant composition would generally be better for livestock for forage diversity. Remember, on tallgrass prairie, two-thirds of the production occurs during the first half of the growing season (by July 10).
Table 1. Ranking and comparison of other grazing systems to continuous grazing for livestock production and wildlife habitat.
| Rank | Grazing System | Livestock Response ($) | Wildlife Habitat Response |
|---|---|---|---|
| 1 | Patch burn Patch graze |
good | excellent |
| 2 | Continuous | good | good |
| 2 | 4 pasture 3 herd | good | good |
| 3 | High intensity low frequency |
fair | poor |
| 3 | Multi paddock mob | fair | poor |
Forage Production and Standing Crop
Stocking rates are based on the amount of forage available for livestock. There are several methods ranchers can use to obtain this value: some rely on guesswork from previous managers, others obtain information from Natural Resource Conservation Service Ecological Site Descriptions (e.g., Soil Surveys). Research has shown that these Site Guides are accurate enough to provide a starting point for a change in management or a new ranching operation. An ecological site, previously known as a range site, is an area of land with a combination of soil, climatic, topographic, and natural vegetation features that set it apart significantly from adjacent areas. Ecological sites are expressed in terms of soil depth, topography, slope, plant production, and species composition. Vegetation on a particular site will vary in composition and production from one region of the state to another and from year-to-year because of changes in precipitation.
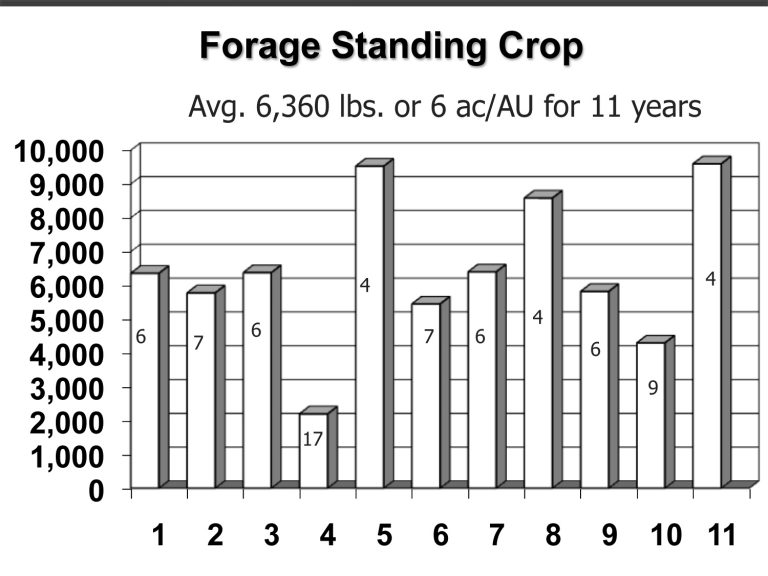
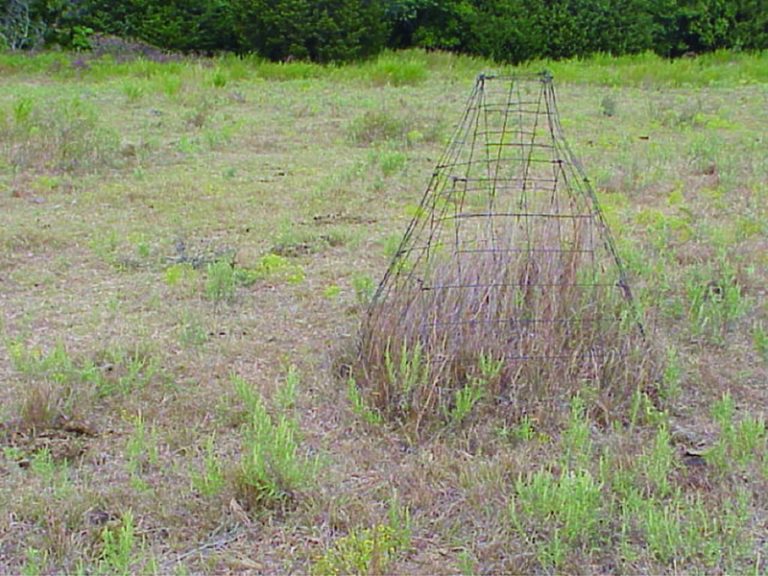
A very useful forage production value comes from estimating the end-of-season standing crop (this is not total forage production) that is standing at the end of the growing season in September through October (Figure 2). Standing crop should be measured in an area that has not been grazed since spring (green-up). This measurement is made by clipping and weighing sample inside the grazing exclosures (Figure 3).
The exclosure should be moved each year during the winter. The more years of standing crop information that can be assembled, the better the decision will be made on stocking rates.

Figure 2. Forage standing crop at the end of the growing season during an 11-year period in tallgrass prairie with acres per animal unit year (AUY) on each bar.

Figure 3. A grazing exclosure at the end of the growing season.
Stocking Rates and Harvest Efficiency
After estimating the annual forage standing crop, it is necessary to adjust the amount of forage to be consumed by the livestock. The recommended stocking rates for rangelands are based on moderate utilization (economic long-term optimum) of the annual forage standing crop and assume uniform grazing distribution. It is also assumed that 50 percent of the annual peak standing crop can be removed from the ecological site without negatively affecting the plant community relative to species abundance or for livestock production. This is the origin of the “take half and leave half” rule-of-thumb that is often used and often misunderstood. Of the 50 percent of rangeland forage (grasses, forbs, legumes) that is assumed to be removed, the assumption is also made that one-half (25 percent of the total) is actually consumed by livestock and the other one-half (25 percent of the total) is trampled, laid on, consumed by insects or other animals, or disappears because of decomposition. These assumptions lead to a harvest efficiency of 25 percent. Another way to look at this is to assume that 25 percent of the total forage is actually consumed by the grazing animal. Plant physiological requirements regarding remaining residue and waste by grazing animals set these limits. Plants that are overused will be weak and less productive the next growing season and will require rest.
Setting Stocking Rates on Native Vegetation
Forage production varies from year to year because of changes in precipitation. Stocking rate should be based on average long-term end-of-season standing crop values for an operation to remain productive and sustainable. Ranchers that have been in business for a longtime tend to stock conservatively (light). This is particularly important in arid rangelands. They know that years of low rainfall and low forage production (unfavorable years) are the years that will put them out of business. These ranchers also adjust their stocking rate calculation to account for the presence of bulls, replacement heifers, or other grazing animals including wildlife that are also consuming forage.
Technical Terms
Stocking rate is defined as the number of animals on a certain amount of land (acres) over a certain period of time (grazing period). A term that is used to help understand and estimate forage requirements is the animal unit (AU) concept. An animal unit is defined as a 1,000 lb. dry cow (Table 2). Thus, stocking rate is generally expressed as animal units (AU) per unit of land area.
Table 2. Carrying capacity in terms of the animal unit (AU) concept. These numbers are constants based on metabolic body weight explained below.
| Term | Abbreviation | Definition |
|---|---|---|
| Animal unit | AU | 1,000 lb. dry cow |
| Animal unit day | AUD | 26 lbs. of dry forage |
| Animal unit month | AUM | 780 lbs. of dry forage |
| Animal unit year | AUY | 9,360 lbs. of dry forage |
Because cattle and other grazing animals are not the same size, it is necessary to convert to animal unit equivalents. These calculations are based on metabolic body weight defined by the following equation:
Animal body weight converted to kilograms taken to the 0.75 power = kg0.75
To convert to kilograms (kg) multiply pounds x 0.4536. For example, a 1,000 lb. cow’s metabolic body weight (MBW) would be (1,000) (0.4536) = (453.60)0.75 = 98.29.
See MBW column (Table 3) for comparison of different weight animals and generates
the animal unit equivalent concept (AUE). The term animal unit equivalent is a useful
and practical way to estimate forage demand for different species, kinds, or classes
of animals or for cattle that weigh more or less than 1,000 lbs. Animal unit equivalent
is based upon a percentage (plus or minus) of the standard AU that takes into account
physiological differences (metabolic body weight).
Assuming forage dry matter demand (DM) of 26 lbs. per day, the 1,000 lb. cow is used
as the base animal unit to which other livestock are compared. The AUE for cattle
weighing 900 lbs. or less is calculated as:
AUE = (BODY WEIGHT + 100) ÷ 1,000
or, for animals of 1,100 lbs. or more,
AUE = (BODY WEIGHT-100) ÷ 1,000
Table 3. illustrates several different kinds and classes of animals, their various AUEs, and estimated daily forage demand.
Calculating Stocking Rates
Now that we have the basic calculations for AUE and DM, we are able to calculate the actual stocking rates. Below are 2 examples to illustrate this calculation.
Example 1: Calculating stocking rate:
For the first example assume 100 head of cows that average 1,000 lbs. with calves on a 1,000 acres native rangeland. The grazing system for this herd is continuous stocking for 12 months. The stocking rate would be calculated using information contained in Table 2 and Figure 1.
For a 1,000 lb. cow, AUE = 1.0 (26 lbs. per day) from Table 2.
(Total Land Area) x (Average End of Season Standing Crop) x (Forage Utilization) ÷ (AU Forage Demand per AU per Day) x (Number of Days Grazed)
(1,000 acres) x (6,360 lbs. per acre) x (25%) ÷ (26 lbs. per day) (1 AUE) x (365 days) = 168 cows (average 1,000 lbs.)
In this example this pasture could run 168 cows year-long but this does not take into account bulls, replacement heifers, or calves. Thus, as a general rule you should assign a cow an AUE of 1.4 and recalculate the stocking rate. Using an AUE of 1.4 for a 1,000 lb. cow takes into account bulls, replacement heifers, or calves. Unfortunately some ranchers have tended to run larger cows (usually inefficient and not profitable) over the years and have not taken into account the increase forage demand per animal which results in overgrazing. Thus, accurate animal weights are critical in determining proper stocking rate.
Example 2: Calculation of stocking rate on a grazing period of less than one year and cattle smaller than the standard AU.
A slight twist on the calculation would be to use livestock smaller than the standard AU, the 1,000 lb. cow. An example would be stocker calves managed for season-long (150 days) grazing entering (May 1) the grazing season weighing 600 lbs. and leaving (October 1) weighing 800 lbs. We will use an average weight for the grazing season of 700 lb. which gives an AUE of 0.8 from Table 1.
(1,000 acres) X (6,360 lbs. per acre) x (25%) ÷ (26 lbs. per day) x (0.8 AUE) x (150 days) = 509 stockers
In this example this pasture could run 509 stockers for 150 days.
Table 3. Animal weight, metabolic body weight (MBW), rounded animal unit equivalent (AUE), and estimated daily forage dry matter (DM) demand as a percentage of demand for a 1,000 lb. animal. Various classes and species of animals are listed to demonstrate this concept. Average weights for your animal should be used.
| Animal Type or Class (lbs) | MBW | AUE | DM demand (lbs. per day) | |
|---|---|---|---|---|
| Sheep | ||||
| Ewe 175 | 26.6 | 0.27 | 7.0 | |
| Ram 250 | 34.8 | 0.34 | 8.8 | |
| Goat | ||||
| Nanny 120 | 20 | 0.2 | 5.2 | |
| Billy 175 | 26.6 | 0.27 | 7.0 | |
| Deer | ||||
| Doe-IM 60 | 11.92 | 0.12 | 3.1 | |
| Doe-M 100 | 17.48 | 0.17 | 4.4 | |
| Buck-IM 75 | 14.09 | 0.14 | 3.6 | |
| Buck-M 150 | 23.69 | 0.24 | 6.2 | |
| Cattle | ||||
| Calf 300 | 39.84 | 0.4 | 10.4 | |
| 400 | 49.35 | 0.5 | 13.0 | |
| 500 | 58.44 | 0.6 | 15.6 | |
| 600 | 67.01 | 0.7 | 18.2 | |
| 700 | 75.22 | 0.8 | 20.8 | |
| 800 | 83.14 | 0.8 | 20.8 | |
| Cow 900 | 90.82 | 0.9 | 23.4 | |
| 1000 | 98.29 | 1.0 | 26.0 | |
| 1100 | 105.57 | 1.1 | 28.6 | |
| 1200 | 105.57 | 1.1 | 28.6 | |
| 1300 | 119.66 | 1.2 | 31.2 | |
| 1400 | 126.5 | 1.3 | 33.8 | |
| Bull 1,500 | 133.22 | 1.3 | 33.8 | |
| 1600 | 139.83 | 1.4 | 36.4 | |
| 1700 | 146.33 | 1.5 | 39.0 | |
| 1800 | 152.74 | 1.5 | 39.0 | |
| 1900 | 159.06 | 1.6 | 41.6 | |
| 2000 | 165.3 | 1.7 | 44.2 | |
| 2100 | 171.46 | 1.7 | 44.2 | |
| 2200 | 177.55 | 1.8 | 46.8 | |
| 2300 | 183.57 | 1.8 | 46.8 | |
| 2400 | 189.52 | 1.9 | 49.4 | |
| 2500 | 195.42 | 2.0 | 52.0 | |
| Horse | ||||
| 700 | 75.22 | 0.8 | 20.8 | |
| 800 | 83.14 | 0.8 | 20.8 | |
| 900 | 90.82 | 0.9 | 23.4 | |
| 1000 | 98.29 | 1.0 | 26.0 | |
| 1100 | 105.57 | 1.1 | 28.6 | |
| 1200 | 105.57 | 1.1 | 28.6 | |
| 1300 | 119.66 | 1.2 | 31.2 | |
| 1400 | 126.5 | 1.3 | 33.8 | |
| 1500 | 133.22 | 1.3 | 33.8 |
Summary
A wide variety of terms are used when discussing stocking rate—many of which can be confusing. To calculate stocking rate, it is not necessary to use these terms, ranchers only need to use the following steps:
- Estimate forage production and adjust for loss to trampling, wildlife, decomposition.
- 4,500 lbs/acre standing crop X 25% harvest efficiency = 1,125 lbs/ac available for consumption by the animal of choice
- Other factors to consider:
- Distance from water
- Slope
- Calculate how much forage your livestock will demand for the grazing period.
- Ranchers should keep detailed records on livestock stocking rates, livestock performance, forage standing crop, and wildlife response/harvest over time. Having long-term records is necessary to run a ranch as a business.
Terry Bidwell
Extension Rangeland Specialist and Professor
Dwayne Elmore
Extension Wildlife Specialist and Assistant Professor
Karen Hickman
Professor
