Price Comparison of Alternative Marketing Arrangements for Fed Cattle, 2001-2013
This fact sheet compares prices received and paid for fed cattle by AMAs over the twelve-year period since implementing mandatory price reporting. The primary question addressed in this fact sheet is: Are there significant differences in prices paid for fed cattle in the cash market compared with other procurement methods? A companion fact sheet provides a similar comparison of hog prices by AMAs, AGEC-617 “Price Comparison of Alternative Marketing Arrangements for Hogs, 2001-2013.”
Another companion fact sheet, AGEC-615 “Extent of Alternative Marketing Arrangements for Fed Cattle and Hogs, 2001-2013” reports the volume of purchases by alternative marketing arrangements in these two markets. These fact sheets report on data which became available following passage of the Livestock Mandatory Reporting Act. Mandatory price reporting (MPR) began in April 2001 and since then the phrase, “alternative marketing arrangements (AMAs),” has become common usage, replacing the phrase “captive supplies.”
Data summarized here are taken from selected mandatory price reports at the Agricultural Marketing Service (AMS) Market News site for livestock reports (http://www.ams.usda.gov/AMSv1.0/LPSMarketNewsPage ). Prior to implementation of mandatory price reporting, information in this and the two companion fact sheets was not possible.
Pricing Data from Mandatory Price Reports
Allowing for a brief startup period in the new reporting system, weekly data for this fact sheet begins in May 2001 and extends through April 2013. For convenience, years are identified by their end point, thus the year beginning in May 2001 and ending in April 2002 is referred to as 2002; the year ending April 2003 is referred to as 2003; and similarly for the remaining years of 2004 through 2013.
Alternative marketing/procurement arrangements discussed here fall into four categories for fed cattle: negotiated cash trades, forward contracts (mostly basis contracts), formula arrangements (mostly marketing/purchasing agreements with price tied to the cash market), and negotiated grid trades. A comparison of prices for packer-owned transfers of fed cattle from feedlot to slaughter plant was not possible since packers are not required to report these transfer prices under mandatory price reporting.
Fed Cattle Price Comparisons
Mandatory price reporting data are discussed from two aspects in this section. The first considers annual averages of weekly prices by AMAs from which we can identify general trends. The second shows the week-to-week dynamics, which are found among AMAs.
Annual Averages
Table 1 provides summary statistics for AMAs for the entire twelve-year period since implementing mandatory price reporting. All price comparisons are for steers and are expressed on a dressed weight basis. Negotiated cash prices are a five-state, weighted average price including all grades of fed cattle which is reported by AMS. States represented include the major cattle feeding areas of Texas-Oklahoma, Kansas, Nebraska, Colorado, and Iowa-So. Minnesota. It could be argued that the five-state, weighted average price is the most comprehensive reported price and is most representative of market conditions in the cash market, both for live weight and dressed weight trades. Here, negotiated cash prices are used as the base or standard for comparing prices reported by other AMAs.
Table 1. Annual fed cattle price summary by AMA (May to April by year).
| Year | Weekly Mean (price) | Min | Max | |
|---|---|---|---|---|
| Negotiated Cash | 2002 | 110.42 | 99.82 | 123.03 |
| 2003 | 111.41 | 97.64 | 129.82 | |
| 2004 | 136.98 | 117.11 | 177.97 | |
| 2005 | 138.07 | 127.78 | 151.55 | |
| 2006 | 137.04 | 123.04 | 154.59 | |
| 2007 | 139.27 | 125.05 | 159.75 | |
| 2008 | 144.93 | 133.4 | 154.44 | |
| 2009 | 131.79 | 124.01 | 142.44 | |
| 2010 | 147.35 | 135.21 | 161.39 | |
| 2011 | 162.95 | 145.58 | 199.03 | |
| 2012 | 190.2 | 170.22 | 205.24 | |
| 2013 | 194.96 | 178.46 | 205.02 | |
| 2002-13 | 145.45 | |||
| Forward Contract | 2002 | 111.78 | 104.05 | 120.8 |
| 2003 | 110.74 | 99.43 | 123.42 | |
| 2004 | 131.34 | 113.1 | 161.82 | |
| 2005 | 137.33 | 128.88 | 144.25 | |
| 2006 | 138.62 | 126.37 | 147.83 | |
| 2007 | 138.86 | 125.59 | 151.34 | |
| 2008 | 150.52 | 141.54 | 157.29 | |
| 2009 | 142.11 | 130.88 | 165.01 | |
| 2010 | 137.61 | 133.25 | 142.44 | |
| 2011 | 149.89 | 138.2 | 171.08 | |
| 2012 | 185.13 | 169.05 | 200.89 | |
| 2013 | 200.87 | 191.95 | 211.21 | |
| 2002-13 | 144.57 | |||
| Formula Agreement | 2002 | 111.42 | 120.21 | 124.1 |
| 2003 | 111.68 | 99.48 | 127.17 | |
| 2004 | 135.65 | 117.98 | 166.39 | |
| 2005 | 138.63 | 124.37 | 149.07 | |
| 2006 | 138.65 | 125.37 | 152.42 | |
| 2007 | 139.35 | 124.83 | 159.12 | |
| 2008 | 146.64 | 137.19 | 156.01 | |
| 2009 | 133.21 | 128.18 | 141.83 | |
| 2010 | 145.18 | 129.43 | 159.53 | |
| 2011 | 161.24 | 145.78 | 194.43 | |
| 2012 | 188.28 | 167.66 | 203.18 | |
| 2013 | 194.46 | 178.65 | 202.77 | |
| 2002-13 | 145.37 | |||
| Negotiated Grid | 2002 | |||
| 2003 | ||||
| 2004 | 136.57 | 133.16 | 138.27 | |
| 2005 | 138.11 | 129.91 | 149.12 | |
| 2006 | 137.88 | 125.65 | 151.82 | |
| 2007 | 138.65 | 126.21 | 157.95 | |
| 2008 | 144.82 | 137.34 | 154.93 | |
| 2009 | 131.24 | 124.92 | 140.39 | |
| 2010 | 143.59 | 127.69 | 160.99 | |
| 2011 | 160.94 | 146.61 | 195.83 | |
| 2012 | 188.64 | 169.93 | 201.97 | |
| 2013 | 193.55 | 179.95 | 200.67 | |
| 2002-13 | 151.4 |
Year-to-year differences exist among alternative marketing or procurement arrangements but those differences are not consistent. For at least one year, each of the AMAs had the highest average annual price. Negotiated cash prices were highest in three of the most recent four years. Forward contract prices varied the most from negotiated cash prices. Forward contract prices were more than $5/cwt. lower on average than negotiated cash prices in 2004, 2010, 2011, and 2012; but were more than $5/cwt. higher on average than negotiated cash prices in 2008, 2009 and 2013. Examining annual average prices suggests no single AMA has a consistent advantage for either packers or cattle feeders. It suggests prices by AMA are determined by market conditions and the joint behavior of buyers and sellers.
One part of Table 1 needs an explanation. AMS did not begin reporting negotiated grid prices until 2004, so the two lowest-price years of the twelve-year period (2002 and 2003) are not included in the 2004-2013 average for negotiated grid pricing. Thus, while it appears negotiated grid prices were highest on average for the entire period; that is not correct. Negotiated grid prices were highest on average only in 2005.
Two concerns of some producers cannot be addressed here. One is whether or not there are special deals between selected packers and feedlots. Some feeders and others allege packers offer favorable pricing arrangements with selected feedlots that are not offered to all cattle feeders. A second concern of some producers and others is whether or not some AMAs are used strategically by packers to keep cash market prices artificially low. This fact sheet provides some comparisons between prices paid and received by AMAs, but summary data cannot address those concerns directly.
Price Comparison –
All Alternative Marketing Arrangements
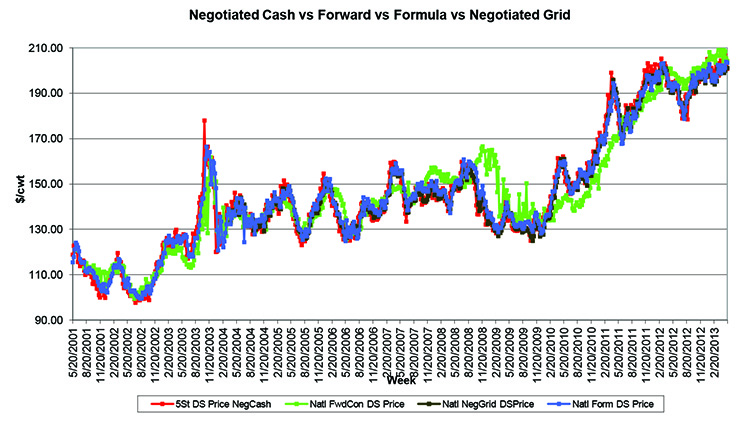
Figure 1 compares weekly average dressed steer prices for the four alternative marketing arrangements. Overall, all pricing methods track each other pretty closely as fed cattle market prices move up and down seasonally and cyclically. Thus, each is generally representative of broad market conditions (termed price determination), but not what might be affecting prices within and between weeks (termed price discovery).
Deviations are evident but usually for just a few weeks and not for extended periods, with one exception which is discussed later. There are several weeks during the twelve-year period when all prices were essentially pennies per hundredweight apart from each other. This seems especially important, given the concerns of many cattlemen and others regarding negotiated cash prices vs. prices for other AMAs. The exception is between forward contract prices and other AMAs, as was seen in annual average prices discussed above. More is said about this in a subsequent section.
In the following sections, negotiated cash prices are presumed to be the standard for comparison. Each alternative method is compared individually with negotiated cash prices.
Figure 1. Weekly fed cattle prices by alternative marketing arrangements, May 2001 to April 2013.
Negotiated Cash Prices vs. Formula Prices
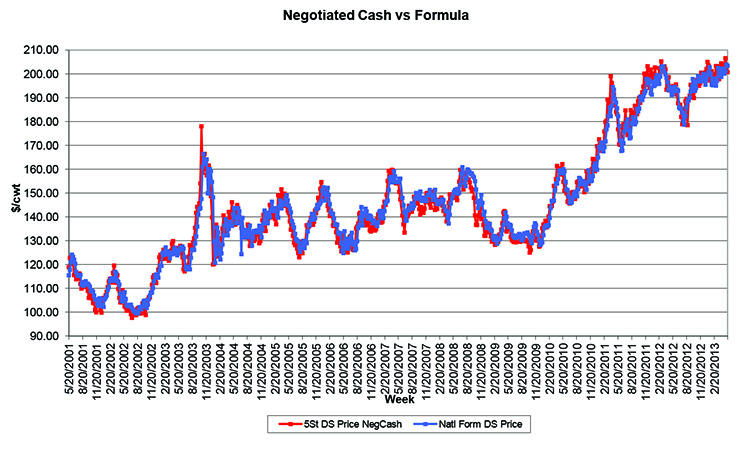
One concern for many supporters of mandatory price reporting was the presumed favorable relationship of formula prices relative to negotiated prices. Figure 2 compares negotiated cash prices with formula prices. There is a noticeable but small difference between the two series in most weeks. However, the two do not deviate from each other for long periods or by large amounts.
As shown in Table 1, formula prices on average for the twelve-year period were $0.08/cwt. lower than negotiated cash prices. However, formula prices averaged higher than negotiated cash prices in seven years (2002, 2003, and 2005-2009). Understanding how base prices in grids are discovered adds to the understanding of the price differences noted here. Many base prices in grids are formula priced with the base price tied to last week’s cash market, either a reported cash market price quote or the average cost of fed cattle at the packer’s plant where the cattle were slaughtered. Therefore, one would expect a close relationship between the formula price this week and the negotiated cash price last week.
Figure 2. Weekly negotiated cash prices for fed cattle, compared with formula prices, May 2001 to April 2013.
Negotiated Cash Prices vs. Forward Contract Prices
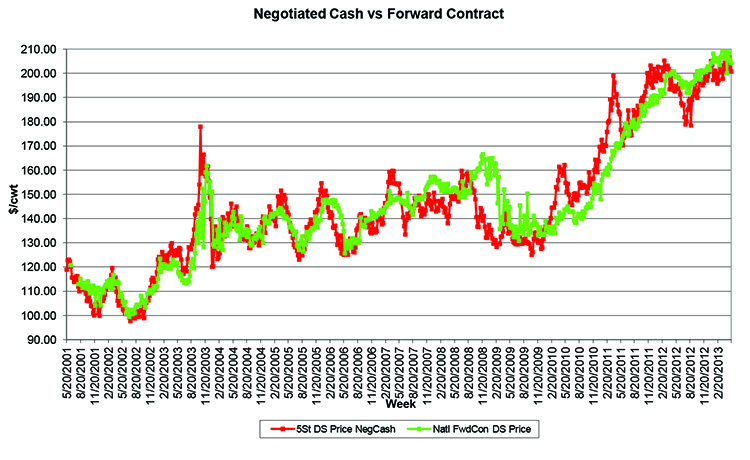
Figure 3 compares negotiated cash prices with forward contract prices. Forward contract prices deviate sharply in some weeks and for extended periods from negotiated cash prices. Looking at Figure 3 closely, it can be observed that negotiated prices tend to be lower than forward contract prices on a declining market. Conversely, forward contract prices tend to be lower than negotiated prices on a rising market. Some of those price differences are quite significant, both from week-to-week and on an annual average basis.
Price differences between these two methods may be affected by the time period in which prices are discovered in forward contracts vs. cash prices. Most cash trades consist of fed cattle purchased within one week of slaughter, whereas forward contract prices may be discovered much farther in advance of slaughter. Most forward contracts for fed cattle are basis contracts. Packers bid a futures market basis (cash market price minus nearby futures market price) in the month fed cattle are expected to be marketed. Then anytime between the time cattle are contracted and when cattle are delivered for slaughter, which could be several weeks, cattle feeders may pick or lock in the fed cattle price. Forward contracts may be made between buyer and seller when cattle are placed in the feedlot or anytime they are on feed. After agreeing to the forward contract, cattle feeders watch the futures market and try to determine when the live cattle futures market price has peaked for the futures market contract expiring just after the time cattle will be slaughtered. As a result of this process and depending on futures market price behavior, the average forward contract price may or may not be close to the current weekly cash market price, especially on sharply declining or rising markets. Thus, price differences between forward contract and cash transactions result in part from average weekly prices not being computed for the same price discovery periods for the two pricing methods.
Figure 3. Weekly negotiated cash prices for fed cattle, compared with forward contract prices, May 2001 to April 2013.
Negotiated Cash Prices vs. Negotiated Grid Prices
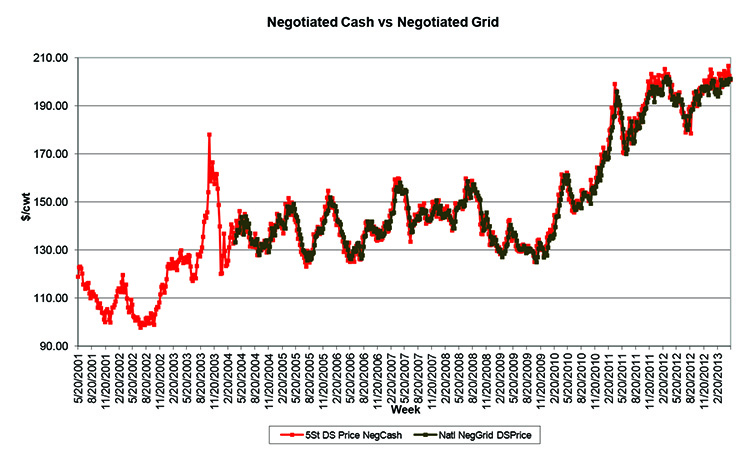
Opposition to the use of formula pricing by some cattle feeders, led to increased interest in negotiating the base price in grid pricing transactions. In April 2004, AMS began reporting negotiated grid pricing volume and prices. Figure 4 shows a comparison of negotiated cash prices with negotiated grid prices. For the comparison period, the relationship between the two pricing methods is generally very similar to negotiated cash prices and formula prices. Small differences exist in most weeks, though price differences during the most recent 18 months of the data period tend to be larger and favor negotiated cash prices. It appears negotiated cash prices have an edge in rising markets.
An explanation for the price differences relates again to the pricing process. Packers and feeders may negotiate the base price this week for grid priced cattle, but cattle are likely delivered and slaughtered next week. The net grid price, which is the base price plus and minus carcass premiums and discounts, cannot be computed until after cattle are slaughtered. Therefore, net grid prices reported this week from negotiated grid trades are close to negotiated cash prices for the previous week.
Figure 4. Weekly negotiated cash prices for fed cattle, compared with negotiated grid prices, May 2001 to April 2013.
Conclusions
Mandatory price reporting increased the amount of data and information available on various pricing methods and quantities traded for fed cattle. Comparisons between prices paid by packers for fed cattle purchased by alternative marketing arrangements (AMAs) are easier now than prior to mandatory price reporting.
Analyses with weekly data for the twelve years (2001-2013) since mandatory price reporting began can be summarized as follows:
- Differences between annual average negotiated cash prices and two AMAs (formula prices and negotiated grid prices) were generally small and varied from year to year. However, differences between negotiated cash prices and forward contract prices were often significantly different. However, no single pricing method was consistently higher or lower than others on an annual basis for the twelve-year period.
- Considerable week-to-week variation in prices is evident. Overall, for the twelve-year period, all pricing methods track reasonably well the dynamics or general movement of market prices as determined by supply and demand forces.
- Differences between negotiated prices and prices from AMAs from week to week were related to rising and falling market prices. Negotiated cash prices tend to be lower than other AMA prices on a declining market and higher during periods of rising prices.
- Differences between negotiated prices and prices from AMAs can be explained in part by the underlying mechanics of price discovery for each arrangement. The timing of discovering the sale/purchase price affects the weekly average price reported.
References
Ward, Clement E. AGEC-629, “Extent of Alternative Marketing Arrangements for Fed Cattle and Hogs, 2001-2013.”
Clement E. Ward
Professor Emeritus, Oklahoma State University


