Is Rainfall Index Pasture, Rangeland and Forage Insurance Right for You?
Weather can change from a rancher’s best friend to their worst enemy from one year, one month or even one day to the next. For cattle producers, months of prolonged drought affect grazing quality, rate of gain and stocking rate. For hay producers, the right amount of moisture at the right time of year can mean a difference between a profit and a loss. A risk management tool available to protect against low moisture and the subsequent production losses is the Rainfall Index Pasture, Rangeland and Forage (PRF) insurance program for perennial forage produced for grazing or haying (United States Department of Agriculture Risk Management Agency, 2017). Producers who purchase PRF coverage receive indemnity payments when rainfall drops below selected percentages of the historical index for the geographic area covered by the insurance policy (USDA RMA, 2017). The program isn’t tied to market prices or revenue. The aim is to offset forage losses associated with low moisture conditions. A producer has the potential to lose money on their operation due to market price drops or other kinds of risk and still not receive a PRF indemnity payment. This program is administered by the USDA RMA.
How the Program Works
A producer selects whether to insure their grazing or haying acreage; the number of acres to insure; the coverage level; productivity factor; insurable interest; and at which intervals to insure their acreage (USDA RMA, 2017). PRF generally begins with a 17×17-mile grid and measures actual rainfall using rainfall monitors inside or near that grid (USDA RMA, 2017). This program insures based on a producer’s general geographical area, rather than on their individual farm location. A producer can determine the grid their property is in using the USDA RMA interactive support tool. A rancher must insure their property in the grid where it actually resides (USDA RMA, 2017). Therefore, if a rancher owns land in multiple grids, they will then be insured in multiple grids (USDA RMA, 2017). A producer can insure as few or as many acres as they want, as long as it is suitable for the grazing or haying option selected (USDA RMA, 2017).
The coverage level will determine the percent of rainfall at which the producers’
indemnity payment will be triggered. A producer can select a coverage level from 70
to 90 percent (USDA RMA, 2017). For example, at a 90 percent coverage level, a producer
would receive a payment anytime the rainfall in their grid and chosen index falls
below 90 percent of the historical average (USDA RMA, 2017). The RMA insurance subsidy
is dependent upon the coverage level the acres are insured under (USDA RMA, 2017).
A 90 percent coverage level is subsidized 51 percent while a 70 percent coverage level
is subsidized 59 percent (USDA RMA, 2017).
The productivity factor is chosen based on how the producer thinks they compare to
the county base value (USDA RMA, 2017). A producer can choose a productivity factor
between 60 and 150 percent of the county base value for their grid (USDA RMA, 2017).
A producer would choose to insure at 100 percent productivity factor if they believe
their land is at the average production for their county; below 100 percent if they
believe their land is less productive than their county average; or above 100 percent
if they believe their land is more productive than the county average.
Finally, a producer must select the intervals in which to insure their pasture, rangeland
or forage acres. There are 11 index intervals that occur in two-month periods (USDA
RMA, 2017). The intervals are January-February, February-March, March-April, April-May,
May-June, June-July, July-August, August-September, September-October, October-November
and November-December. A producer must choose at least two intervals and insure a
minimum of 10 percent of their insurance percent of value and a maximum of 60 percent
of their insurance percent of value in each interval to total 100 percent, such as
50 percent in January-February and 50 percent in April-May (USDA RMA, 2017). The selected
intervals cannot be consecutive (USDA RMA, 2018).
Oklahoma Producer Impact Example
To see how this program could impact a producer, PRF is illustrated below with an example from a grid located in Carter County (grid 6931). This is just one example within one grid; use the RMA interactive support tool if you want to closely examine grids near your land.
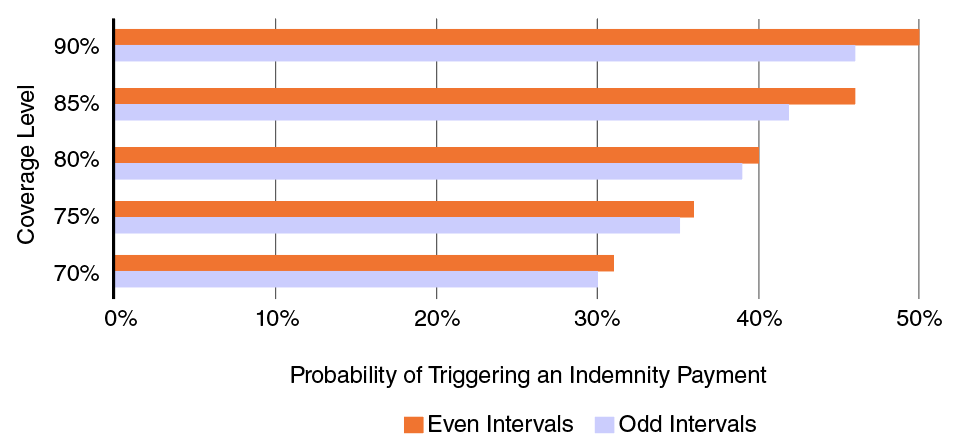
Consider a producer in this area who wants to maximize the probability of triggering
an indemnity payment. They can spread out the percentage of coverage provided in each
interval. For example, the producer could have selected all odd intervals (odd numbered
months first) or all even intervals (even numbered months first). If a producer chooses
to use this risk management method, the probability of triggering an indemnity at
each coverage level is shown in Figure 1.
Figure 1. Probability of triggering an indemnity payment at each coverage level.
Note: Odd intervals are: January-February, March-April, May-June, July-August, September-October
and November-December. Even interval months are: February-March, April-May, June-July,
August-September, and October-November. This represents all coverage levels available
and the probability of triggering a payment for each respective coverage level from
1948-2018 in grid 6931 and found using the USDA RMA Decision Support Tool: https://prodwebnlb.rma.usda.gov/apps/prf#.
This program was designed to help producers over time, so it may be helpful for producers
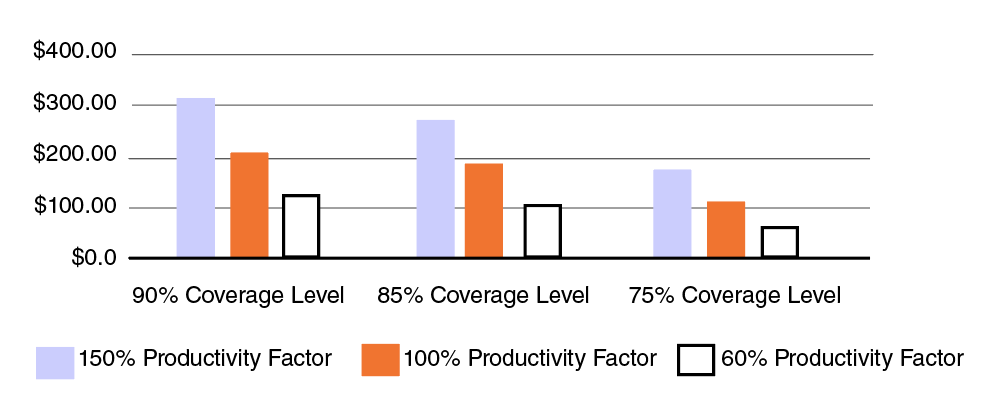
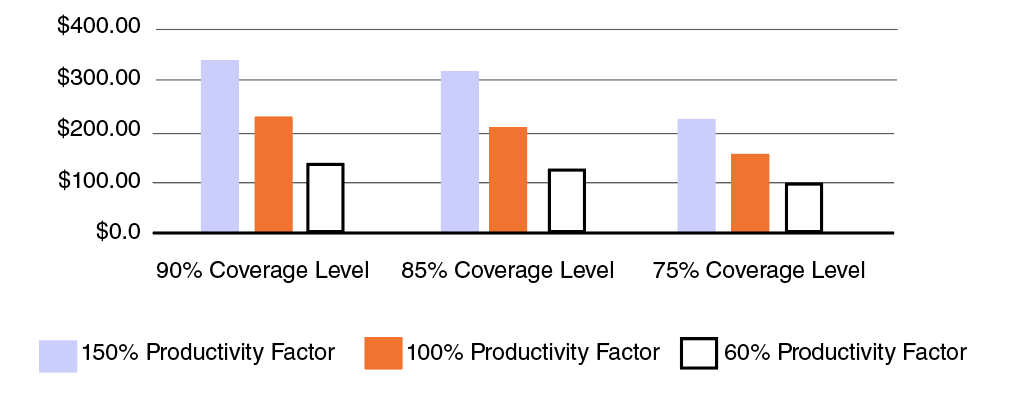
to analyze the program’s impact over a longer period. The average indemnity payments
during a 10-year time period (2008-2017) is shown in Figure 2 and Figure 3 below for
a high, medium and low coverage level and productivity factor to illustrate the variation
in indemnity payments.
Figure 2. Average indemnities across odd-interval months from 2008-2017.
Note: Odd intervals are: January-February, March-April, May-June, July-August, September-October
and November-December.
This represents the high, medium, and low coverage levels. The 75 percent coverage
level was selected as the lowest coverage level due to it being the lowest bracket
of government subsidy.
Calculations are based on Grid 6931 and found using the USDA RMA Decision Support
Tool: https://prodwebnlb.rma.usda.gov/apps/prf#.
Figure 3. Average indemnities across even-interval months from 2008-2017.
Note: Even intervals are: February-March, April-May, June-July, August-September,
and October-November.
This represents the high, medium, and low coverage levels. The 75 percent coverage
level was selected as the lowest coverage level due to it being the lowest bracket
of government subsidy.
Calculations are based on Grid 6931 and found using the USDA RMA Decision Support
Tool: https://prodwebnlb.rma.usda.gov/apps/prf#.
It is beneficial for producers to analyze the impact of different coverage levels
and productivity factors as the indemnity payment can vary drastically. As shown in
Figures 2 and 3, utilizing a 150 percent productivity factor could result in a higher
indemnity payment average at a lower coverage level (75 percent).1 Compare this to
a higher coverage level (90 percent) at a lower productivity factor (60 percent),
a producer is more likely to see a payment by electing the higher productivity factor
in this specific county.
Although this producer example illustrates spreading out coverage across the maximum
number of intervals, a producer also can choose as few as two intervals. Depending
on the producer’s operation, a low-coverage year-round or high-coverage during the
few months that rain is the most crucial to their operation may be most beneficial.
Producers should consider which intervals match their unique needs and risks. When
spreading out coverage across multiple months, a producer increases the probability
of receiving a payment during the year. However, the percent of value in each interval
is small. If a producer chooses to insure acres in fewer intervals, the percentage
insured in each interval will be larger. If utilizing this method, the producer would
decrease the number of intervals in which a payment could potentially be received,
but they may have a larger payment in the months they did insure and when a payment
is triggered.
Conclusion
The Pasture, Rangeland and Forage insurance program serves as a risk management tool to insure against reduced forage production incurred as a result of low moisture (USDA RMA, 2017). Indemnity payments are triggered based exclusively on the amount of rainfall received across the grid area and are not tied to production revenues (USDA RMA, 2017). There are multiple factors to take into consideration when engaging in the program such as coverage level, productivity factor and the insurance intervals for acreage (USDA RMA, 2017). Interested producers should utilize the USDA RMA decision support tool to see how this program might affect their operation under different scenarios.
For More Detailed Information
The USDA RMA has developed an online interactive support tool to help producers identify how the program would affect their individual operation. This tool can be found at: https://prodwebnlb.rma.usda.gov/apps/prf. Producers can find their grid, see how many times a payment would have been triggered historically and look at their profitability when considering all factors to make a decision.
Acknowledgments
The authors would like to thank reviewers Dan Childs and Robyn Peterson for their feedback on this research. This fact sheet was a collaborative effort with the Noble Research Institute, LLC, but does not necessarily represent the policies or recommendations of Noble Research Institute, LLC.
References
United States Department of Agriculture, Risk Management Agency. (2017). Pasture, Rangeland and Forage Pilot Insurance Program. Washington, DC. Retrieved from https://www.rma.usda.gov/Fact-Sheets/National-Fact-Sheets/Pasture-Rangeland-Forage-Pilot-Insurance-Progra.
1 United States Department of Agriculture Risk Management Agency “Pasture, Rangeland, Forage Support Tool” available at https://prodwebnlb.rma.usda.gov/apps/prf
Mckenzie Carvalho
Undergraduate Research Assistant,
Department of Agricultural Economics, Oklahoma State University
Myriah Johnson
Economics Program Lead and Agricultural Economics Consultant, Noble Research Institute,
LLC
Amy Hagerman
Assistant Professor, Department of Agricultural Economics,
Oklahoma State University


