Irrigated Agriculture in Oklahoma
- Jump To:
- Introduction
- Irrigation and Water Management Survey 2023
- General Information
- Irrigation Wells
- Irrigation Pumps and Energy Costs
- Other Irrigation-Related Expenditures
- Irrigation Interruption
- Deciding When to Irrigate
- Barriers Toward Water and Energy Conservation
- Sources of Irrigation Information
- Irrigation Systems
- Crops Harvested from Irrigated Farms
- Horticultural Operations
Introduction
Irrigation plays a vital role in fostering the economic viability of agricultural production in Oklahoma, especially in the arid/semi-arid western parts of the state. In recent years, irrigated agriculture has been challenged by prolonged droughts and strong competition from industrial, urban and environmental sectors over limited freshwater resources. These constraints along with the increasing demand in food, feed, fiber and fuel necessitate the urgent need to provide Oklahoma producers with tools to improve irrigation management and maximize water productivity. This task, however, is not possible without understanding the current situation of irrigated agriculture and investigating its potential weaknesses and opportunities.
This fact sheet provides an overall picture of the state of irrigated agriculture in Oklahoma. The information and analysis are based on the data published in the Irrigation and Water Management Survey (previously known as the Farm and Ranch Irrigation Survey) conducted in 2023 by the National Agricultural Statistics Service of the United States Department of Agriculture.
Figure 1. The 2023 survey cover page.
Irrigation and Water Management Survey 2023
The 2023 Irrigation and Water Management Survey adds detailed irrigation related information to the basic data collected from all agricultural operations in the 2022 Census of Agriculture. Some of the 2023 data are not comparable with previous survey reports conducted in 1997, 2003, 2008, 2013 and 2018, since the definition and reporting of some operations (e.g. horticulture in the open) has changed. The comparisons in this fact sheet are made keeping this point in mind to avoid misleading conclusions.
General Information
According to the 2023 survey, Oklahoma has 1,734 farms containing irrigated lands. The total area of land in these farms exceeds 3.9 million acres, with 607,301 acres of farmland equipped with irrigation systems and an actual irrigated area of 539,181 acres. This shows a 10% decrease compared to the total irrigated acres in the 2018 survey, but 26% and 17% increases compared to the 2013 and 2008 surveys, respectively. The decrease compared to 2018 is likely due to a combination of the reduced groundwater availability and extensive droughts, causing producers to divert water resources toward specific fields instead of applying irrigation to every field equipped with irrigation systems. For example, due to the ongoing droughts between 2022 and 2024, the Lugert-Altus Irrigation District was not able to release water from the reservoir. In terms of actual irrigated acres, Oklahoma is ranked 25th among all 50 states. All neighboring states have significantly larger irrigated areas, ranging from New Mexico with about 583,735 acres (ranked 22nd) to Arkansas with 4.6 million acres (ranked 3rd).
The total amount of irrigation water applied in the survey year was 665,465 acre-feet, which is equal to more than 216 billion gallons. This shows an increase of less than 1% compared to 2018 and an increase of about 27% compared to both 2013 and 2008 estimates. The amount of irrigation applied to a unit of land increased in 2023 (1.2 acre-feet per acre) compared to 2018 (1.1 acre-feet per acre), showing that more irrigation water was applied per unit area of land. This might explain the relatively smaller increase in the total amount of applied water compared to 2018 due to ongoing droughts between 2022 and 2024, causing limited surface water availability. There will not necessarily be a decrease in total water applied as crops will be more stressed during the time of droughts, but water resources that are available will be directed to current farms instead of expanding irrigated acreage. The 2023 survey recorded less than 0.1% of the total amount applied to operations under protection (e.g. greenhouse), and the remaining (99.9%) was applied to operations in the open – similar to the 2018 survey.
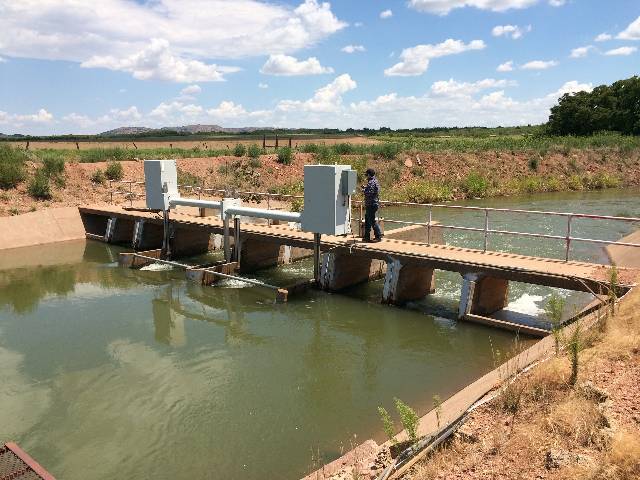
Figure 2. An irrigation canal taking water from Lake Altus in southwest Oklahoma to agricultural fields.
Ninety-four percent of the total water applied in the open in 2023 was supplied from groundwater resources, about 5% from off-farm resources, and the remaining (less than 1%) water provided from surface resources. This indicates a larger reliance on groundwater compared to 2018, when groundwater accounted for 85% of irrigation water applied in the open. The increased groundwater usage in 2023 was probably a result of ongoing droughts severely limiting the availability of surface water resources. The amount of groundwater supplied for irrigation was about 92% in 2013, like 2023 (94%). However, the volume of groundwater withdrawn for irrigation in 2023 was 11%, 30% and 44% larger than 2018, 2013 and 2008, respectively. This increase in the total amount of groundwater extraction could shorten the life of those aquifers that have a limited recharge capacity, such as the Ogallala aquifer in the Oklahoma Panhandle. It should be noted that the reported amount of applied water is based on irrigators’ best estimate and not metered flow rates.
Reclaimed water, defined as the wastewater that has been treated for non-potable reuse purposes, could be an important source of water when freshwater resources are scarce. In 2023, 29 farms in Oklahoma reported the use of reclaimed water for irrigation. This number was 40, 18 and two farms in 2008, 2013 and 2018, respectively, with total irrigated areas of 3,775 acres, 2,205 acres, and a disclosed area in 2018 due to limited acres of application. These statistics suggest there is significant potential for reuse of reclaimed water in irrigated agriculture in Oklahoma.
Irrigation Wells
According to the survey, 5,585 irrigation wells were in use on Oklahoma irrigated lands in 2023, which is 2% less than 2018, but 14% and 41% more than 2013 and 2008, respectively. Among all wells surveyed in 2023, around 25% had meters to monitor groundwater withdrawal, up from 19%, 16% and 12% in 2018, 2013 and 2008, respectively. In addition, 18% of wells did not have a backflow prevention device (down from 35% in 2018), which is necessary to prevent the flow of potential contaminants into aquifers; especially if chemigation is practiced. Chemigation is the injection of chemicals such as fertilizers and pesticides into irrigation systems.
The 2023 average well depth was 236 feet in Oklahoma, larger than the average depth in 2018 (194 feet) and 2013 (219 feet), but similar to 2008 (237 feet). The average depth to water estimated at the beginning of the growing season was 100 feet in Oklahoma, according to the 2023 survey. In 2023, 16% of Oklahoma wells showed an increase in depth to water while 70% reported no change. That leaves about 14% of wells in Oklahoma reporting a decrease in depth to water, which is lower than 2018 (45%), 2013 (31%) and 2008 (21%). However, the 2023 average pumping capacity was 417 gallons per minute, which was 13% more than 2018, 2% more than 2013 and 17% less than 2008. The decline in pumping capacity since 2008 is consistent with the increase in total groundwater withdrawal, which is up 44% in 2023 compared to 2008, mentioned before. The national average pumping capacity in 2023 was 742 gallons per minute.
Irrigation Pumps and Energy Costs
Regardless of water source (surface or ground), many irrigated farms rely on pumps to either raise the water to a desired level or to pressurize it for distribution through sprinkler and drip systems. In 2023, Oklahoma producers spent about $32.7 million in energy expenses to power 5,866 pumps. Pumping energy expenses were up 52% in 2023 compared to 2018, 47% compared to 2013 and only 2% compared to 2008. Pumping energy expenses in 2023 were similar to the expenses recorded in 2008 ($32.2 million). The reported average well depths in 2023 and 2008 were also similar and deeper than those re- ported in 2018 and 2013, which may help explain the higher pumping expenses observed in both 2023 and 2008. Producers powered less pumps in 2023 (5,866 pumps) compared to 2018 (6,530 pumps), but more than 2013 (5,351 pumps) and 2008 (4,087 pumps). Taking irrigated acres into account, the amount of energy expenditure in 2023 translates into $60 and $26 per acre for groundwater and surface water irrigation, respectively. Electricity was the main source of pumping energy, supplying water to 55% of all irrigated acres in state. The second major energy source was natural gas, which contributed 38% in 2023. The third most used energy source was diesel, which powered pumps to irrigate 4% of the remaining irrigated acres in 2023.
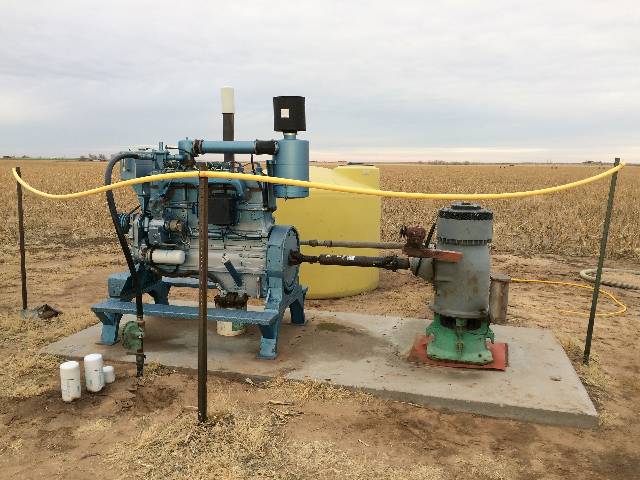
Figure 3. A natural gas engine extracts groundwater for irrigation.
Other Irrigation-Related Expenditures
In addition to the energy expenses mentioned above, Oklahoma producers spent another $27.3 million on irrigation equipment, facilities, land improvement and computer technology. This was about 29% less than 2018, but 45% higher than 2013 in terms of the total amount. However, the average expenditure per affected acre in 2023 ($93) was slightly smaller when compared to 2018 ($107) and 2013 ($118). A large portion of this money (57%) was spent for scheduled replacement and maintenance. Almost one-quarter (22%) of the total expenditures was dedicated to water conservation, 20% higher than 2018. Only about 15% of the expenses were used for new expansion, significantly smaller compared to 2018 (34%) and 2013 (33%). There were no reports of irrigated acres where mentioned expenditures were made that received financial assistance from the Environmental Quality Incentives Program or other USDA programs.
Oklahoma producers paid above $12.6 million of total labor expenses in 2023, which was around one and a half times larger than 2018, seven times larger than 2013, and three times larger than 2008. Out of this amount, about $11.2 million was spent on hired labor and over $1.4 million on contract labor. Furthermore, the average hired labor expenses per farm was $31,124, whereas contract labor per farm expenses was $5,893.
Irrigation Interruption
Out of all irrigated acres in Oklahoma, only about 6% experienced an irrigation interruption in 2023 that resulted in diminished crop yield. The two leading causes for irrigation interruption were equipment failure, affecting 46%, and groundwater shortage, affecting 42% of all acres that reported interruption. Surface water shortage was another reason for irrigation interruption, reported by 11% of total interrupted acres. Groundwater shortage was reportedly responsible for irrigation interruption for 13,150 acres in 2023, which is significantly higher than 2018 (1,464 acres), but a lot lower than in 2013 (23,349 acres). The large amount of acres reporting irrigation interruption, according to the 2013 survey, is likely a result of the drought that occurred during 2011-2014.
Deciding When to Irrigate
Improving irrigation management is not possible without implementing state-of-the-art methods in deciding when to irrigate. In Oklahoma, the main method for determining irrigation timing was the “condition of crop” in 2023, mentioned by 91% of irrigated farms. The next most common method was the “feel of soil,” used by 42% of all irrigators. The third most common method was based on “personal calendar schedule,” implemented in 14% of all farms. Smart methods such as soil moisture sensing devices plant sensing devices, and computer models had a low adoption rate, with each one of them being mentioned by less than 10% of irrigated farms. Among these smart methods, the use of soil moisture sensing devices in Oklahoma lags behind the national average and many neighboring states. The percentage of farms that used these sensors was 13% across the nation, 10% in Texas, 19% in Arkansas and 12% in Kansas. Mississippi was the leading state, with about 30% of all irrigated farms having adopted the soil moisture sensing devices in their irrigation scheduling. Surprisingly, the use of soil moisture sensors in Oklahoma has increased two times more in 2023 (10%) compared to 2018 (5%). However, soil moisture sensors used by farmers took a step back in 2018 compared to 2013, as 2013 (11%) was similar but slightly higher than 2023 (10%).
With the availability of the Oklahoma Mesonet as an extensive and well-maintained network of weather stations, the use of daily evapotranspiration (ET) products in determining when to irrigate was reported by only 9% of Oklahoma farmers. This is slightly more than the U.S. average (7%) and lower than other states such as Kansas (11%) and Nebraska (21%). The above information suggests that there is great potential to improve irrigation scheduling in Oklahoma by promoting the use of advanced approaches such as sensors, Mesonet products and computer models. It should be noted that percentages reported for mentioned methods do not add up to 100% since many irrigators use more than one method to decide about irrigation timing.
Figure 4. Installing soil moisture sensors at a cotton field near Altus, Oklahoma.
Barriers Toward Water and Energy Conservation
Identifying the barriers that prevent producers from improving water and energy conservation is the first step toward achieving conservation goals. According to the 2023 survey, a major barrier was related to financial challenges. Twenty-seven percent of farmers said that they could not finance improvements, up from 19% mentioning this barrier in 2018 and 14% from the 2008 survey, but down from 30% in 2013. Seventeen per- cent of producers mentioned that improvements would not reduce costs enough to cover installation costs and 10% noted that landlord would not share in costs. Thirty-six percent of producers mentioned that water and energy conservation was simply not their priority, which shows a slight decline when compared to 38% in 2018, 37% in 2013, and a more significant decrease compared to 46% in 2008.
Sources of Irrigation Information
The most relied upon source of irrigation information in the state was university Extension specialists and educators, mentioned by over half of all irrigated farms in 2023 (59%). This is up compared to 2018 (46%) and 2013 (48%), and significantly higher than 2008 (39%) when irrigation equipment dealers were the major sources of irrigation information. Private irrigation specialists and consultants and neighboring farmers were the next two sources of information in 2023, each mentioned by about one-third of irrigated farms. Irrigation equipment dealers were the next highest source of information for 29% of respondents.
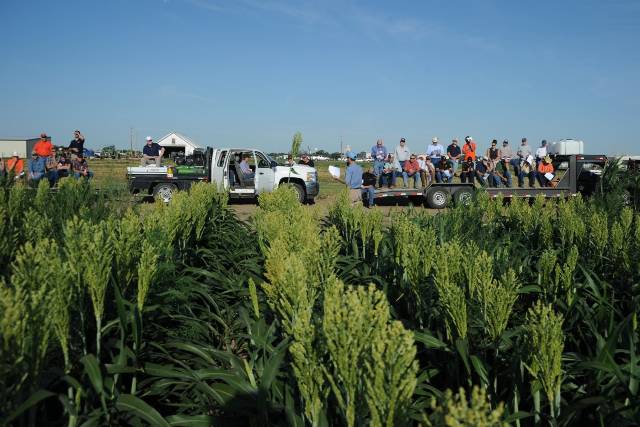
Figure 5. A field day at the Panhandle Research and Extension Center, where irrigation studies are being conducted on corn and sorghum.
Irrigation Systems
Irrigation systems can be generally divided into three main categories of gravity (a.k.a. surface or flood), sprinkler, and drip or localized. Each category has several subtypes. For operations in the open, sprinkler irrigation remained the most common type of irrigation system in Oklahoma in 2023, occupying 99% of all irrigated acres. Within different types of sprinkler systems, center pivots were the most widely used, accounting for 89% of all sprinkler irrigated acres. No farms reported operating center pivots on high pressures (60 psi or more). These systems are those with impact sprinklers placed on the mainline, shooting water at an upward angle across long distances (50 to 100 feet). High pressure systems have a much larger energy requirement. In addition, from one-fourth to more than one-third of discharged water could be lost due to droplet evaporation and wind drift. About 77% of these center pivots were operating on pressures under 30 psi.
In 2023, about 20,645 irrigated acres were under gravity (flood) irrigation systems. This indicates a significant decrease compared to 69,649 acres in 2018. The smaller irrigated acres in 2023 can be attributed to prolonged droughts in southwestern Oklahoma and the inability of Lake Altus to deliver irrigation water to large areas of gravity-irrigated farmlands. The 2013 estimate of gravity irrigated area in Oklahoma was 14,000 acres, closer to the 2023 estimate, also affected by 2011-2014 droughts. However, the 2018 estimate was similar to the 2008 estimate with both years irrigating around 67,000 acres with gravity irrigation systems. The most common subtype in 2023 was furrow systems, occupying 69% of all gravity-irrigated lands. Producers have been applying various water management practices to improve gravity systems over the years. However, in 2023, there were no reported farms using gravity-irrigated land under tail water pits, diking, time limits or alternative row irrigation management practices. The precision leveling or zero-grading practice of gravity-irrigated acres also did not have any reported uses in 2023. These management practices were significantly decreased compared to 2018.
Drip and localized irrigation systems (the third major type of irrigation system along with sprinkler and gravity) occupied only 25,018 acres of irrigated lands in 2023. This shows a significant increase compared to 2018, when 11,492 acres of irrigated land were under this type of irrigation system. Almost three-quarters of drip irrigated acres in 2023 were under sub-surface drip and only about 4% of them were under low-flow micro-sprinklers.
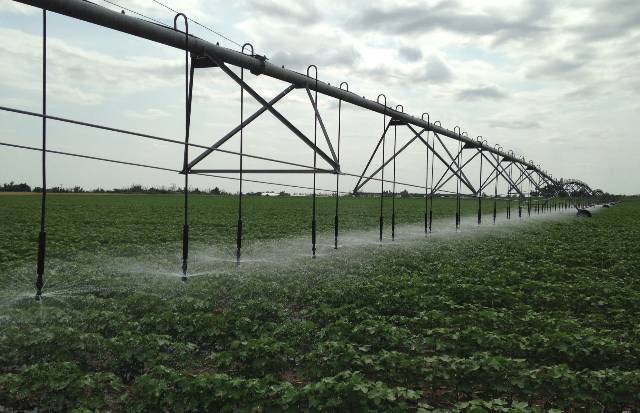
Figure 6. A low-pressure center pivot system in southwestern Oklahoma.
Crops Harvested from Irrigated Farms
The 2023 survey provides detailed information on major irrigated crops in the state. The crop-specific information is com- parable among survey years since it is not impacted by inclusion/exclusion of horticultural operations. In 2023, the largest irrigated crop was grain wheat, occupying about 113,028 acres of irrigated lands. This shows a consistent increase in irrigated area compared to previous surveys in 2018 and 2013, but is down from 2008 when 147,489 acres of irrigated wheat were harvested. The second largest irrigated crop in 2023 was corn for grain or seed, accounting for about 84,603 acres of irrigated farmlands. Irrigated corn acreage was down from the past three surveys conducted in 2018, 2013 and 2008 where there was a consistent increase each survey until a decrease in 2023. Irrigated cotton experienced a significant decrease, going from about 113,902 irrigated acres in 2018 to about 34,257 acres in 2023. Soybeans also show a consistent decrease in irrigated area, from 62,313 acres in 2018 to about 18,202 acres in 2023. The changes in irrigated acres of the top five commodity crops with time are shown in Figure 7.
Figure 7. Harvested irrigated acres of major crops in Oklahoma.
Horticultural Operations
The total irrigated horticultural area in the open was about 14,300 acres in 2023, which decreased compared to about 14,800 in 2018, 21,800 in 2018 and 19,800 in 2008. About 98% of the area in 2023 was dedicated to sod production in the open. Floriculture and bedding crops were next in the row, with about 2% of the total irrigated area. Ninety-nine percent of all irrigated horticultural area in the open was under sprinkler irrigation systems, and the remaining 1% was under drip, trickle, or low-flow micro irrigation and hand water irrigation. Like agricultural irrigation, groundwater from wells was the main source of water for horticultural irrigation, accounting for 58% of all water used for irrigation in the open. The remaining water used for horticultural irrigation was supplied from on-farm surface water resources or off-farm suppliers, both disclosed amounts in the 2023 survey due to limited farms reporting.


