Impact of Sensor-Based Nitrogen Management on Yield and Soil Quality
- Jump To:
- Introduction
- Summary
Introduction
The Sensor-based Nitrogen Rate Calculated (SBNRC) developed at Oklahoma State University has been documented to increase profit of winter wheat production through either the reduction of nitrogen (N) fertilizer inputs without loss of yield or increase in grain yields with increased inputs. The technique utilizes the GreenSeeker™ sensor, which records NDVI, to measure a high nitrogen strip (N-Rich Strip) placed in the field, pre-plant and an adjacent area representing the farmer practice. These values are then put in an algorithm that provides an estimate of potential yield and a field-specific nitrogen rate recommendation. To date the studies reported were established and concluded over a period of three years or less. Prior to this project there was no documentation on the long term impact of using this technology for increased yields, net returns and soil quality. This report examines a study that was established in 2004 designed to evaluate the sensor-based technologies and typical yield goal based management practices. The study consists of five treatments replicated three times; check, N-rich strip, Yield goal all pre-plant, Yield goal 50/50 split, and 45 lb N ac-1 pre-plant + SBNRC. The regional yield goal is 45 bu ac-1 which, according to Fact Sheet PSS-2225 (Zhang et al 2009), should receive 90 lbs N ac-1 annually. The 2012 winter wheat harvest marked the 8th crop harvested. Nitrogen application rates, grain yield and nitrogen use efficiency were analyzed across years along with soil properties such as percent organic matter, surface and sub-soil nitrate levels.

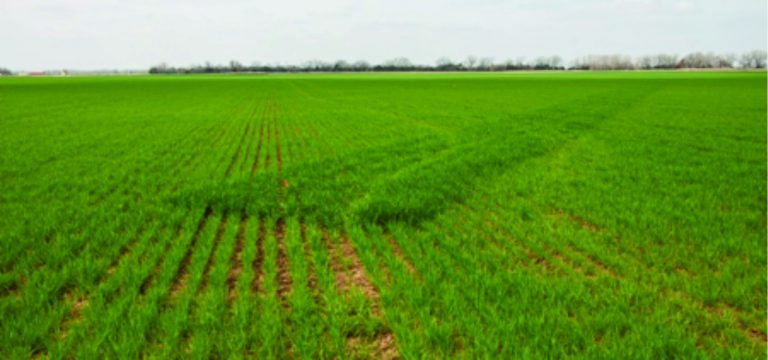
Figure 1. N-rich strip in a producer’s winter wheat field.

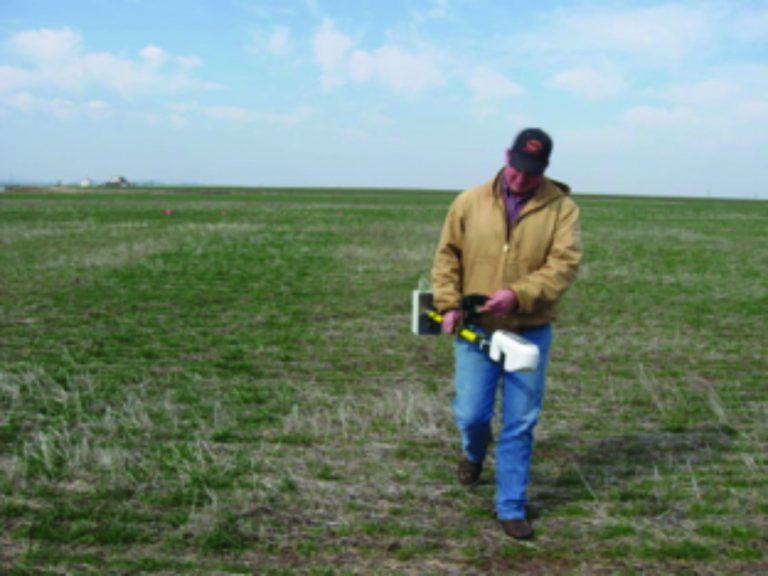
Figure 2. Farmer next to an N-Rich Strip, being sensed with a GreenSeeker™ sensor.
Only six years were evaluated as two harvests were lost due to late season freeze events. Table 1 shows the average annual N rate, grain yield and economic return (grain value – fertilizer cost) over the six years analyzed. On an annual basis, the SBNRC decreased N applied by 28 lbs ac-1 yr-1 while maintaining yields equivalent to both traditional fertilizer treatments. Similarly, Butchee et al. (2011) summarized a series of on farm large scale trials evaluating the Winter Wheat SBNRC in Oklahoma. Over fifteen site years, the technology produced an equivalent amount of total grain with 20 fewer lbs N ac-1 yr-1 than the farmer’s practice.
Table 1. Six year average N additions, yield and economic return.
| N rate lb ac-1 | Yield bu ac-1 | Return* $ ac-1 | ||
| Check | 0 | 33 | 154 | |
| N-Rich | 120 | 49 | 189 | |
| 45 pre SBNRC | 62 | 46 | 193 | |
| 45 / 45 split | 90 | 45 | 177 | |
| 90 pre | 90 | 48 | 194 |
*Return = grain value – nitrogen fertilizer cost: prices based on fertilizer cost and application + grain price at each harvest.
When comparing yield levels and return of the SBNRC method and 45/45 split on a year-by-year basis, the yield of the SBNRC was statistically greater once, lower once and equal to the 45/45 split during the four years. The economic return from the SBNRC plot was greater two years and equal for the 45/45 split the other four. Comparing the SBNRC to the 90 lbs N preplant treatment showed no significant difference in yield or return on an annual basis over the six years.
During the six cropping seasons, the SBNRC applied 166 lbs less N than the two producer
standard treatments (Table 2). The 90 lbs preplant treatment recorded the highest
total grain yield with a six year sum of 292 bu ac-1, the SBNRC treatment produced 283 bu ac-1, and the split application produced 277 bu ac-1. While the 90 lb preplant plot made the most grain numerically there was no significant
difference between the yields of the three treatments.
Table 2. Six year total additions and grain harvest.
| Total N lb ac-1 |
Yield bu ac-1 |
Grain N Removed lb ac-1 |
Nitrogen Use Efficiency | ||
| Check | 0 | 200 | 300 | ||
| N-Rich | 722 | 299 | 449 | 0.21 | |
| 45 pre SBNRC | 374 | 283 | 425 | 0.33 | |
| 45 / 45 split | 540 | 277 | 416 | 0.21 | |
| 90 pre | 540 | 292 | 438 | 0.26 |
During the eight years this study was conducted, plots were never moved. For example, the check had not received N fertilizer since 2004. Soil samples were collected after 2012 to a depth of 3 feet. Results of the 0- to 6-inch samples are reported in Table 3. There was no significant difference in total N, organic carbon, or soil organic matter level. The nitrate (NO3) level of the Check was significantly lower than the other treatments, while the split application was significantly higher. Below the 6-inch sampling depth, there was no significant difference in NO3 levels of any treatment. This is extremely important if you consider that during the eight years of the study, 960 lbs of N ac-1 was applied to the N-Rich strip and no N had been applied to the check. The question must be asked “Where did the N go?” The answer is likely one of nitrogen’s many pathways of loss; leaching, identification, volatilization or plant loss.
Table 3. Soil test summary a 0-6” in sample after eight consecutive years of following specific nitrogen management practices.
| NO3 lbs ac-1 |
Total N % |
Org C % |
SOM* % |
||
| Check | 12 | 0.07 | 0.66 | 1.13 | |
| N-Rich | 17 | 0.08 | 0.68 | 1.18 | |
| 45 pre SBNRC | 18 | 0.08 | .072 | 1.25 | |
| 45 / 45 split | 23 | 0.09 | 0.8 | 1.37 | |
| 90 pre | 18 | 0.08 | 0.66 | 1.13 |
*SOM: Soil Organic Matter.
Summary
After eight years of continuous management, there was no significant difference in average grain yield or cumulative grain yield of plots receiving the traditional producer fertilizer rate or the sensor-based nitrogen rate. In addition, there was no significant difference in the levels of residual nitrogen or organic matter, supporting that the use of the sensor technology will not deplete soil reserves but in fact greatly reduce the amount of nitrogen being lost to the environment.
References
Butchee, K.B, J. May., D.B. Arnall, R. Taylor, W.R. Raun. 2011. Large scale evaluation of the sensor-based nitrogen rate calculator. J. Crop Prod. doi:10.1094/CM-2011-0725-01-RS.
Zhang, H., B. Raun., B. Arnall. 2009. OSU Soil Test Interpretations. PSS-2225-
Okla. Coop. Ext Serv. Okla. State Univ. Stillwater OK.
Brian Arnall
Precision Nutrient Management Specialist
Bill Raun
Soil Fertility Research
