Distribution Patterns for Gourmet Specialist Food Shops & Gift Shops
According to a report from Packaged Facts (a division of MarketResearch.com) titled “Gourmet, Specialty and Premium Foods and Beverages in the U.S.,” consumers purchased nearly $59 billion worth of gourmet and natural packaged products in 2007. This was 10.9 percent more than in 2006. The U.S. gourmet and premium sector is expected to continue growing to a level of $96 billion by 2012.
At the same time, consumers are more aware of healthy eating options and are seeking products that claim to be “natural.” This implies that foods of natural origin in a gourmet or premium format could meet consumers’ twin desires in one venue.
As of October 2007, the number of new gourmet foods and beverage products displaying a natural claim was 259, up from 174 in 2006. According to Packaged Facts, mainstream supermarkets and grocery stores have led the way in this growth and account for 52 percent of gourmet and specialty foods market offerings in 2007 (natural or not).
In Oklahoma, there are many specialty gift shops that offer gourmet food and beverage products either on the shelf to the walk-in customer or in gift baskets distributed throughout the U.S. Many of these shops look for locally produced or “Made in Oklahoma” items to carry. Additionally, specialty food shops such as Native Roots Market in Norman, Okla., have opened their doors with a major focus of their operation being to offer high quality, locally produced foods and beverages.
In order to better understand distribution of gourmet foods and beverages in Oklahoma, the Robert M. Kerr Food & Agricultural Products Center conducted a telephone survey of specialty food and gift shops in the Metropolitan Statistical Areas (MSA’s) of Oklahoma City, Tulsa, Enid and Lawton. Contact information was obtained through an Internet Yellow Pages search. Additionally, since some Oklahoma winery gift shops carry foods and beverages, wineries listed at Oklahomawines.org were included in the telephone survey. Callers were able to make 103 contacts; however, only 40 contacts were willing to respond to the survey (a 38.8 percent response rate).
The specialty shops were asked questions to develop an understanding of how food and beverage products are delivered to their stores. A common method of payment, payment terms and mark-up percentages also were determined. The results of the survey follow.
Delivery of Food & Beverage Products
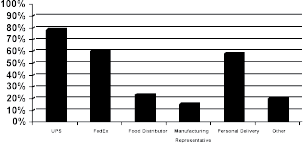
Participants in the survey were asked how food and beverage products were delivered to their stores. Specifically, they were asked to select “all that apply” from the choices of UPS, FedEx, food distributor (e.g. Deli Delights), manufacturing representative (e.g. Blue Sky Bakery), personal delivery by the entrepreneur and other. Seventy-eight percent of the respondents received food and beverage products via UPS. When asked what percentage of foods and beverages were received via UPS, respondents’ answers ranged from 5 percent to 100 percent with 18 of 31 respondents (58 percent) receiving UPS food and beverage shipments more than 50 percent of the time.
Sixty percent of the respondents received food and beverage products via FedEx. When asked what percentage of foods and beverages were received via FedEx, respondents’ answers ranged from 2 percent to 65 percent with 4 of 24 (16.7 percent) respondents receiving FedEx food and beverage shipments more than 50 percent of the time.
When asked about food distributor deliveries, 23 percent received products in this manner. Their percentage of food and beverage deliveries via food distributor was from 1 percent to 75 percent with 4 out of the 9 receiving this type of delivery more than 50 percent of the time. Deliveries via manufacturers representative occurred among 15 percent of the respondents with deliveries ranging from 5 percent to 10 percent.
Personal delivery by the entrepreneur occurred among 58 percent of the respondents with frequency ranging from 2 percent to 100 percent; 11 out of 22 of the respondents received deliveries direct from the entrepreneur more than 50 percent of the time. Twenty percent of the respondents received deliveries from “other” means, which included deliveries by the US Postal Service, direct pickup of the products at the manufacturer’s location and buying products at shows.
Figure 1 demonstrates the percentage of each type of delivery to the gift shop. By far, UPS was the method by which most gourmet and gift shops receive food and beverage shipments with FedEx and personal delivery by the entrepreneur following behind.

Figure 1. Percentage of Food & Beverage Deliveries by Delivery Method
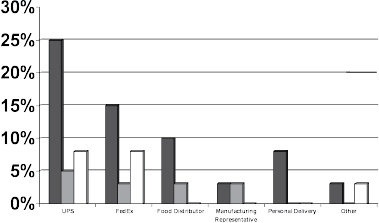
Respondents also were asked how frequently they received food and beverage products by each method of delivery with the choices being 1 or 2 times per week, 3 or 4 times per week or daily. In the instance of UPS deliveries, 25 percent of the respondents claimed they received deliveries 1 or 2 times per week. Five percent received deliveries 3 or 4 times per week and 8 percent received UPS deliveries daily. Fifteen percent of respondents received FedEx delivered food and beverage products 1 or 2 times per week, while 3 percent received deliveries 3 or 4 times per week, and 8 percent received FedEx deliveries daily.
In the case of utilizing a food distributor, 10 percent received shipments 1 or 2 times per week, while 3 percent received deliveries 3 or 4 times per week and daily shipments were not made. Shipments received via manufactures representative were received 1 or 2 times per week by 3 percent of the respondents while another 3 percent received this type of shipment 3 or 4 times per week. Eight percent of respondents received deliveries 1 or 2 times per week from personal deliveries while no respondents indicated deliveries by this method for the other two measures of frequency.
For the delivery method of “other” 3 percent received deliveries 1 or 2 times per week, while another 3 percent received them daily. The question of how often food and beverage products were received assumed that shipments arrived at least weekly; however, this only occurred for up to 10 respondents. Many respondents noted they received food and beverage products monthly to quarterly. A couple said seasonally or third-quarter only (in time for the holidays).

Figure 2. Frequency of Food & Beverage Deliveries by Delivery Method
Payment for Food & Beverage Products
Many different payment methods were used by the respondents for delivery of food and beverage products. Payment by check was the most common method of payment used; about 50 percent of those surveyed (20 respondents) paid for their products in this manner. Thirty-eight percent, or 15 respondents, preferred the use of a credit card, paying upon receipt of the product or after. Five percent, or 2 respondents, chose to pay with cash. Eight percent, or 3 respondents, paid with another method. When “other” was chosen, respondents paid with the following: prepay with credit card at time of order, open account, invoice and company credit.
The survey also reported the most common term of payment for deliveries. Forty-three percent (17 out of 40 respondents) stated the most regular term of payment is net due in 30 days. Cash on delivery is the second most common term of payment, accounting for 33 percent (13 out of 40 respondents). Net 30-day and 2 percent discount if paid in 10 days represented only 3 percent (1 out of 40 respondents). “Other” terms were noted by 23 percent of those surveyed (9 out of 40 respondents).
Of those who responded, 31 claimed shipping and handling charges were applied beyond the price of the food or beverage product purchased anywhere from 5 percent to 100 percent of the time. Twenty respondents paid for shipping and handling charges for food and beverage purchases 100 percent of the time.
Mark-Up/Pricing
Respondents were asked their typical percent mark-up and price range by category. Of the respondents who carry each of the following products, the range of percent mark-up on beverages-bottled was 2 percent to 100 percent; beverages-dry was 2 to 200 percent; and salsas, sauces and dressings were 2 to 110 percent. Jellies, jams and honey were 2 to 110 percent; breads, cookies and crackers (prepared) were 2 to 100 percent; bread mixes, spice mixes and seasonings were 30 to 100 percent; and jerky was from 2 to 100 percent. When looking at total responses for all seven categories, 77 out of 141 responses indicated a mark-up of 100 percent or more, which is defined as a “keystone” mark-up. Table 1 notes the number of respondents by category that use a keystone mark-up.
Table 1. Number of Respondents Using "Keystone" (100% or more) Markup of Category
| Category | |
|---|---|
| Beverage - Bottled | 8 of 21 |
| Beverage - Dry | 10 of 21 |
| Salsa, Sauces, etc. | 12 of 23 |
| Jellies, Jams, etc. | 9 of 20 |
| Breads, Cookies, (prepared) | 10 of 20 |
| Dry Mixes | 12 of 18 |
| Jerky | 2 of 7 |
The typical price points for the following categories also were reviewed. Companies were instructed to respond with a high and low price point for each of the products they produce. On average the companies who responded charged a low price of $2.19 and a high price of $8.15 for beverages-bottled; a low price of $4.35 and a high price of $8.67 for beverages-dry; a low price of $4.98 and a high price of $7.97 for salsas, etc.; a low price $4.83 and a high price of $7.95 for jelly, etc.; a low price of $3.40 and a high price of $7.82 for bread, etc.; a low price of $3.28 and a high price of $7.03 for dry mixes; and a low price of $3.00 and a high price of $5.00 for jerky. Table 2 summarizes price points by category.
Table 2. Average Low and High Points by Category
| Category | Average Low | Averge High |
|---|---|---|
| Beverage - Bottled | $2.19 | $8.15 |
| Beverage - Dry | $4.35 | $8.67 |
| Salsa, Sauches, etc. | $4.98 | $7.97 |
| Jellies, Jams, etc. | $4.85 | $7.95 |
| Breads, Cookies, (prepared) | $3.40 | $7.82 |
| Dry Mixes | $3.28 | $7.03 |
| Jerky | $3.00 | $5.00 |
Conclusion
Food and beverage products for these smaller operations are commonly delivered by UPS one or two times per week. Paying with check is the most common method of payment for food and beverage products delivered. The most common term of payment for food and beverage products received is net due in 30 days, and shipping and handling charges are usually applied beyond the price of the food or beverage product purchased. For many of the food and beverage products, a “keystone” mark-up (100 percent or more) is applied and the ranges of price points varied greatly among product categories. Food and beverage product movement in this arena appears to be low volume and seasonal in some cases as well. One observation from the survey process was that gift shop owners, like most small business owners, are very busy and often would require up to three call-backs before getting a response or completed survey. This was the case even when following the recommendation of calling around 9 a.m. when the owners open their stores for business.
Krista Smith
FAPC Business & Marketing Intern
Chuck Willoughby
FAPPC Business & Marketing Relations Manager
Rodney Holcomb
FAPC Agribusiness Economist
