

Data Center Construction and Tax Revenue: Two Case Studies from Oklahoma
Across the United States, data center construction has accelerated rapidly, driven by the expansion of cloud computing, artificial intelligence (AI) and digital services. These facilities have become indispensable to modern economic and social activity. They house vast networks of servers used to store, transmit and process data, supporting activities ranging from financial transactions and emergency communications to streaming content and cloud storage.
As their footprint grows, data centers have also become a source of increasing public attention and, at times, contention. Popular press coverage often highlights concerns over energy and water consumption (Borenstein, 2026; Greenfield, 2026) while simultaneously emphasizing potential economic benefits, including gains from construction-related spending and tax revenue (Maher, 2026). Although these narratives frequently suggest that construction activity generates meaningful local tax receipts, we are not aware of any research that directly quantifies these effects.
Oklahoma is uniquely positioned to examine whether there is increased tax revenue associated with data center construction. Unlike most states, Oklahoma makes available city-level tax revenue data by NAICS (North American Industry Classification System) sector. This allows for precise analysis of economic activity associated with specific industries. Additionally, the state has attracted multiple data center projects in recent years. This combination of detailed tax data and ongoing data center development activity provides a rare setting to evaluate whether and to what extent data center construction materializes into increases in local tax revenue.
This fact sheet examines two recent data center projects in Oklahoma: one in Stillwater and one in Muskogee. We provide a comparison of the key characteristics of the two projects selected in Table 1. Despite differences in scale, structure and intended use, the two projects provide a useful basis for comparison. Together, they offer an opportunity to evaluate how different types of data center construction may influence local tax revenues.
| Characteristic | Stillwater Project | Muskogee Project |
|---|---|---|
| Developer/operator | Polaris Technologie, Inc. | |
| Primary Purpose | Cloud/AI | Bitcoin/cryptocurrency Mining |
| Construction start | Late 2025 (Phase 1) | Early 2024 (Phase 1) |
| Operational timeline | 2027 (Phase 1) | Mid-late 2024 (Phase 1) |
| Investment size | $500 million (Phase 1) | $100 million (Phase 1) |
| Planned Capacity | Not yet disclosed | 200 MW (Phase 1) |
| Site Size | 387 acres total of which 77 acres makes up Phase 1 | 42 acres |
| Infrastructure type | Traditional concrete data center buildings | Modular "server contrainers" |
| Development scope | Up to six phases, with each phase having an investment of around $500 million | Expected to double investment and capacity in Phase 2 |
Methods
For this analysis, data were obtained from the Oklahoma Tax Commission’s OkTAP (Oklahoma Taxpayer Access Point) Public Reports, specifically the “Tax by NAICS Report.” These reports organize tax collections by NAICS codes, allowing revenue to be examined by economic sector.
A key advantage of this dataset is its monthly reporting structure, which enables aggregation into fiscal years (July 1 – June 30) and direct comparison of construction and non-construction periods within the same city. By examining changes across sectors and time, it is possible to identify shifts in economic activity that could be associated with large-scale development such as data center construction.
This approach builds on prior studies that use the same data source, including Pull Factors: A Measure of Retail Sales Success Estimates for 77 Oklahoma Cities (2024 Edition) and Does My Town Sell a Lot of (Legal) Weed? Medical Marijuana Dispensary Gap Analysis Across 77 Oklahoma Cities. Drawing from this established methodology, this analysis uses NAICS-level tax data to assess how construction activity may influence local tax revenues.
Results
Stillwater
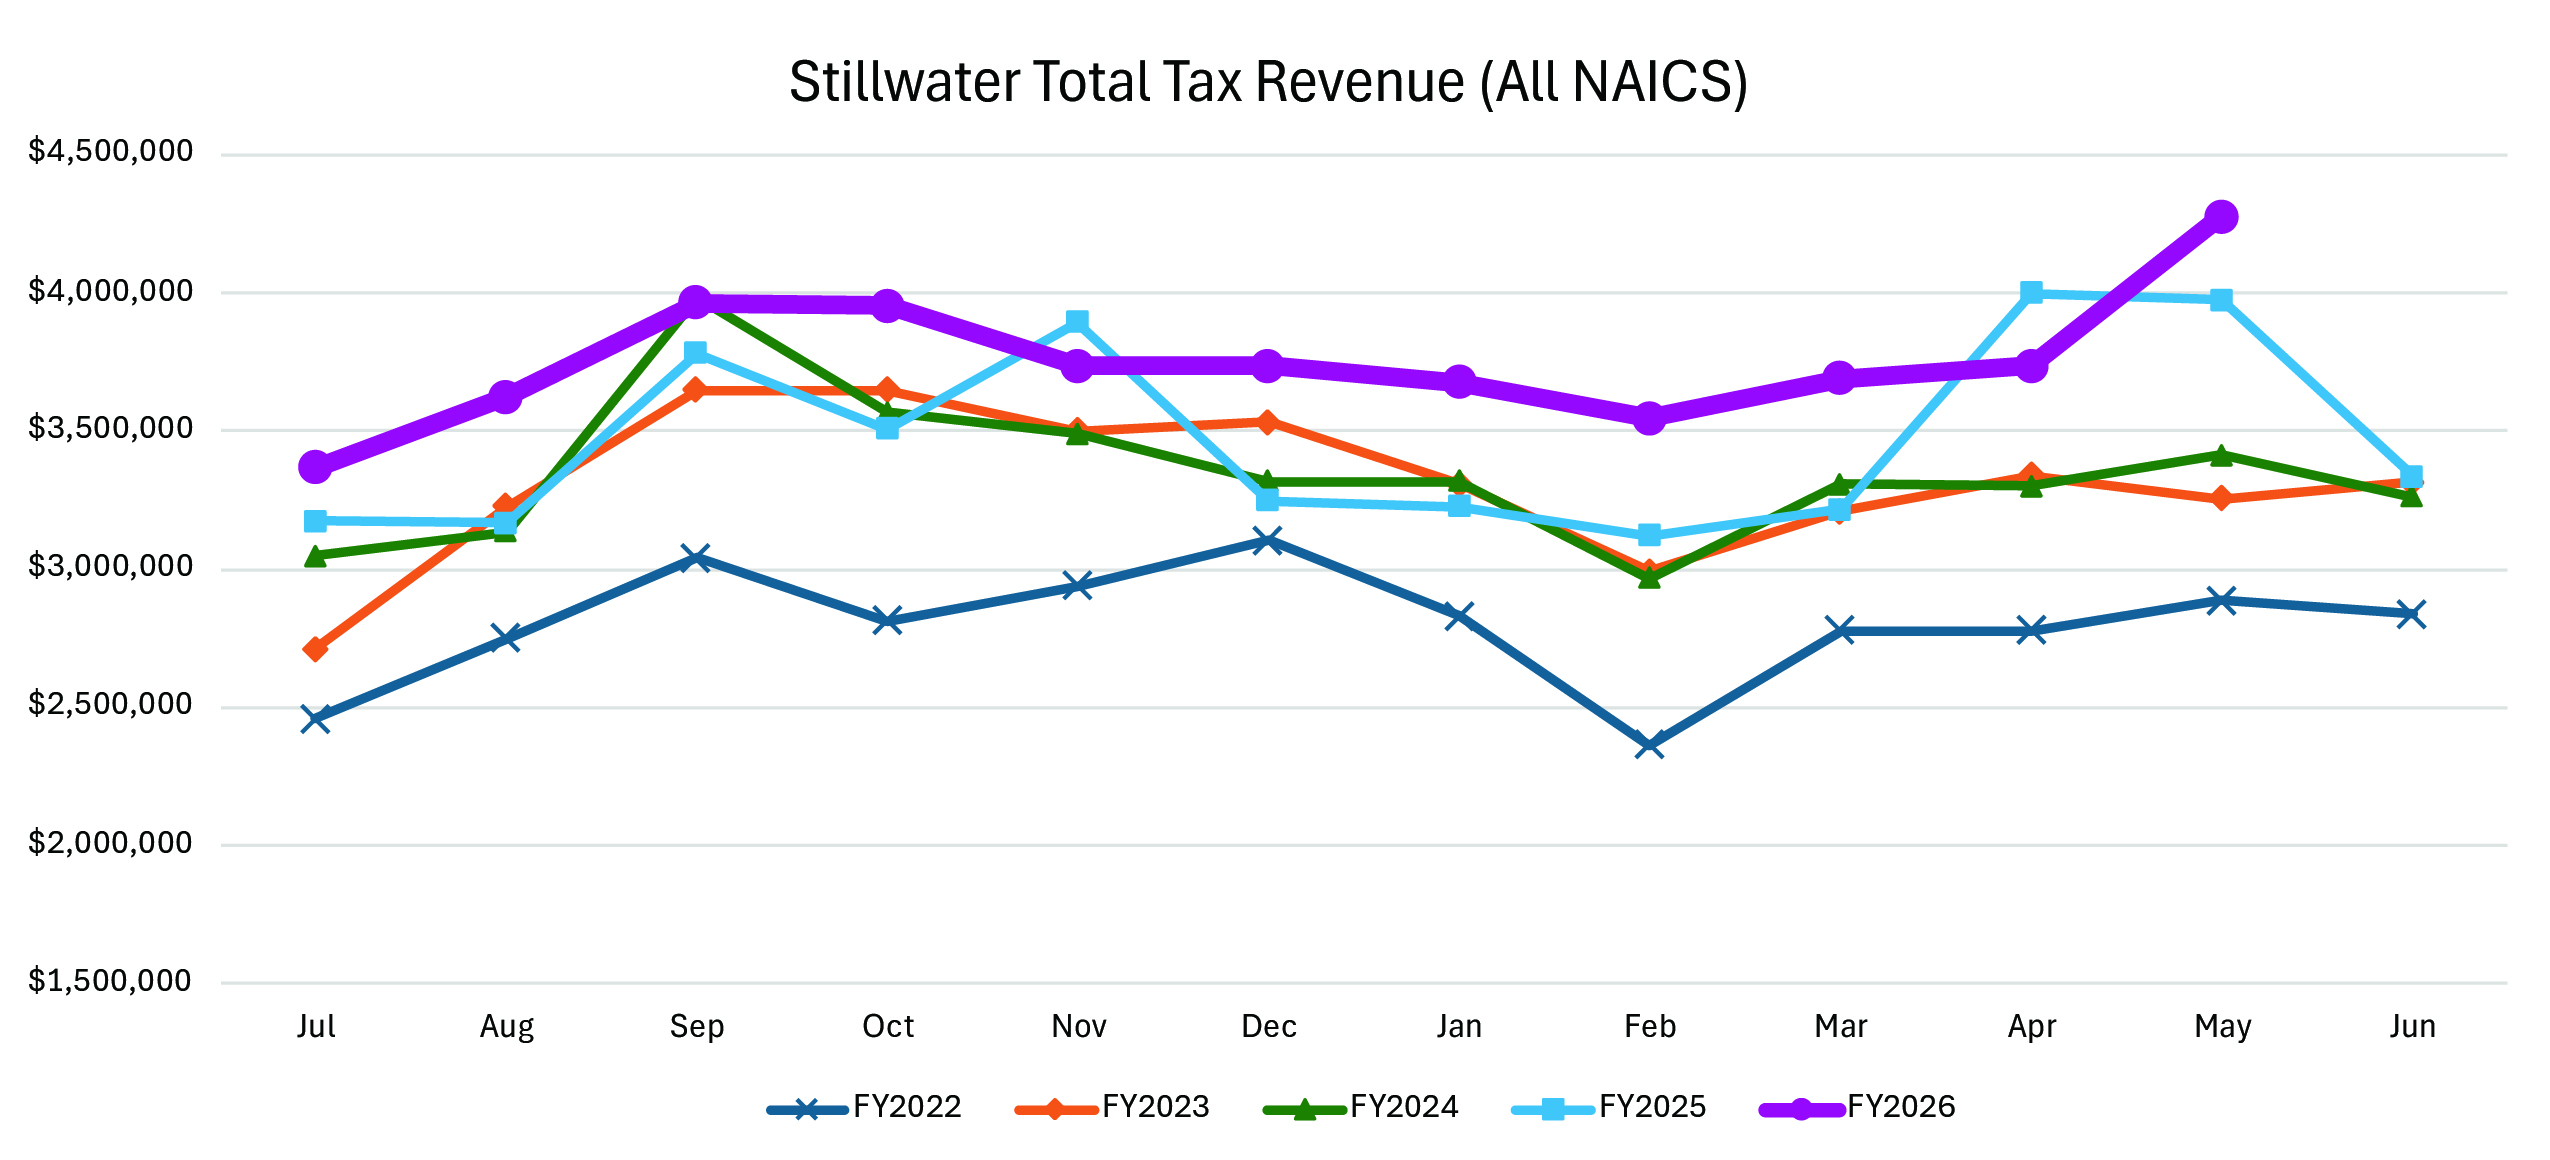 Figure 1. Stillwater sales tax revenue from all NAICS codes, FY2022–FY2026. Source: Oklahoma Taxpayer Access Point and author’s calculations.
| Images | Caption |
|---|---|
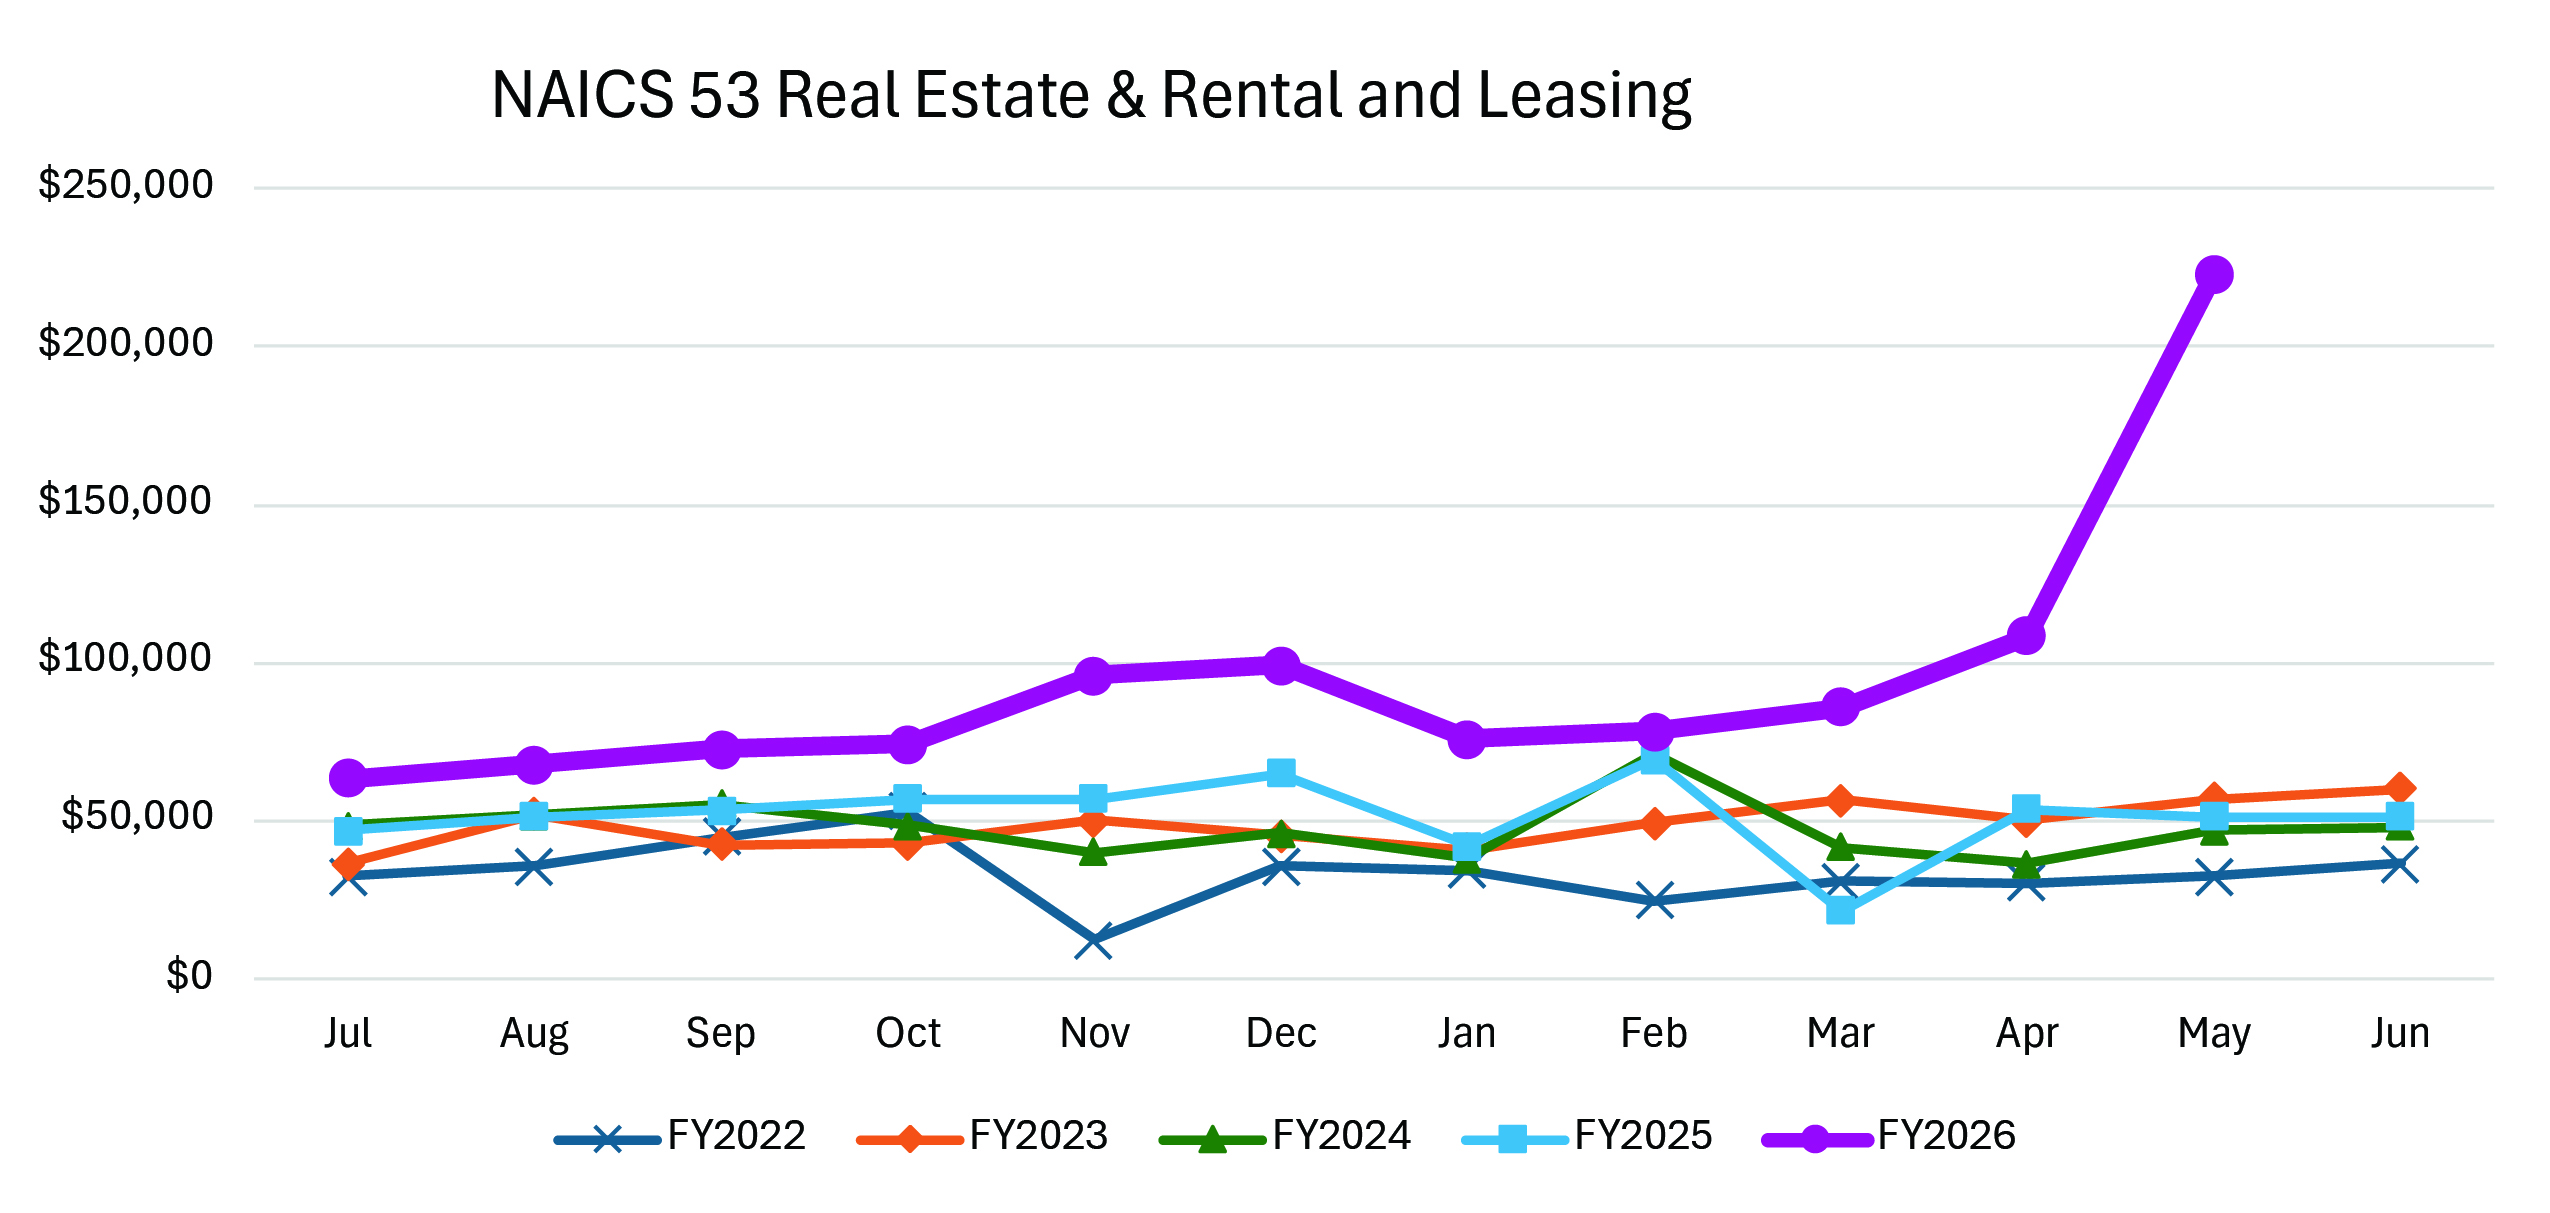
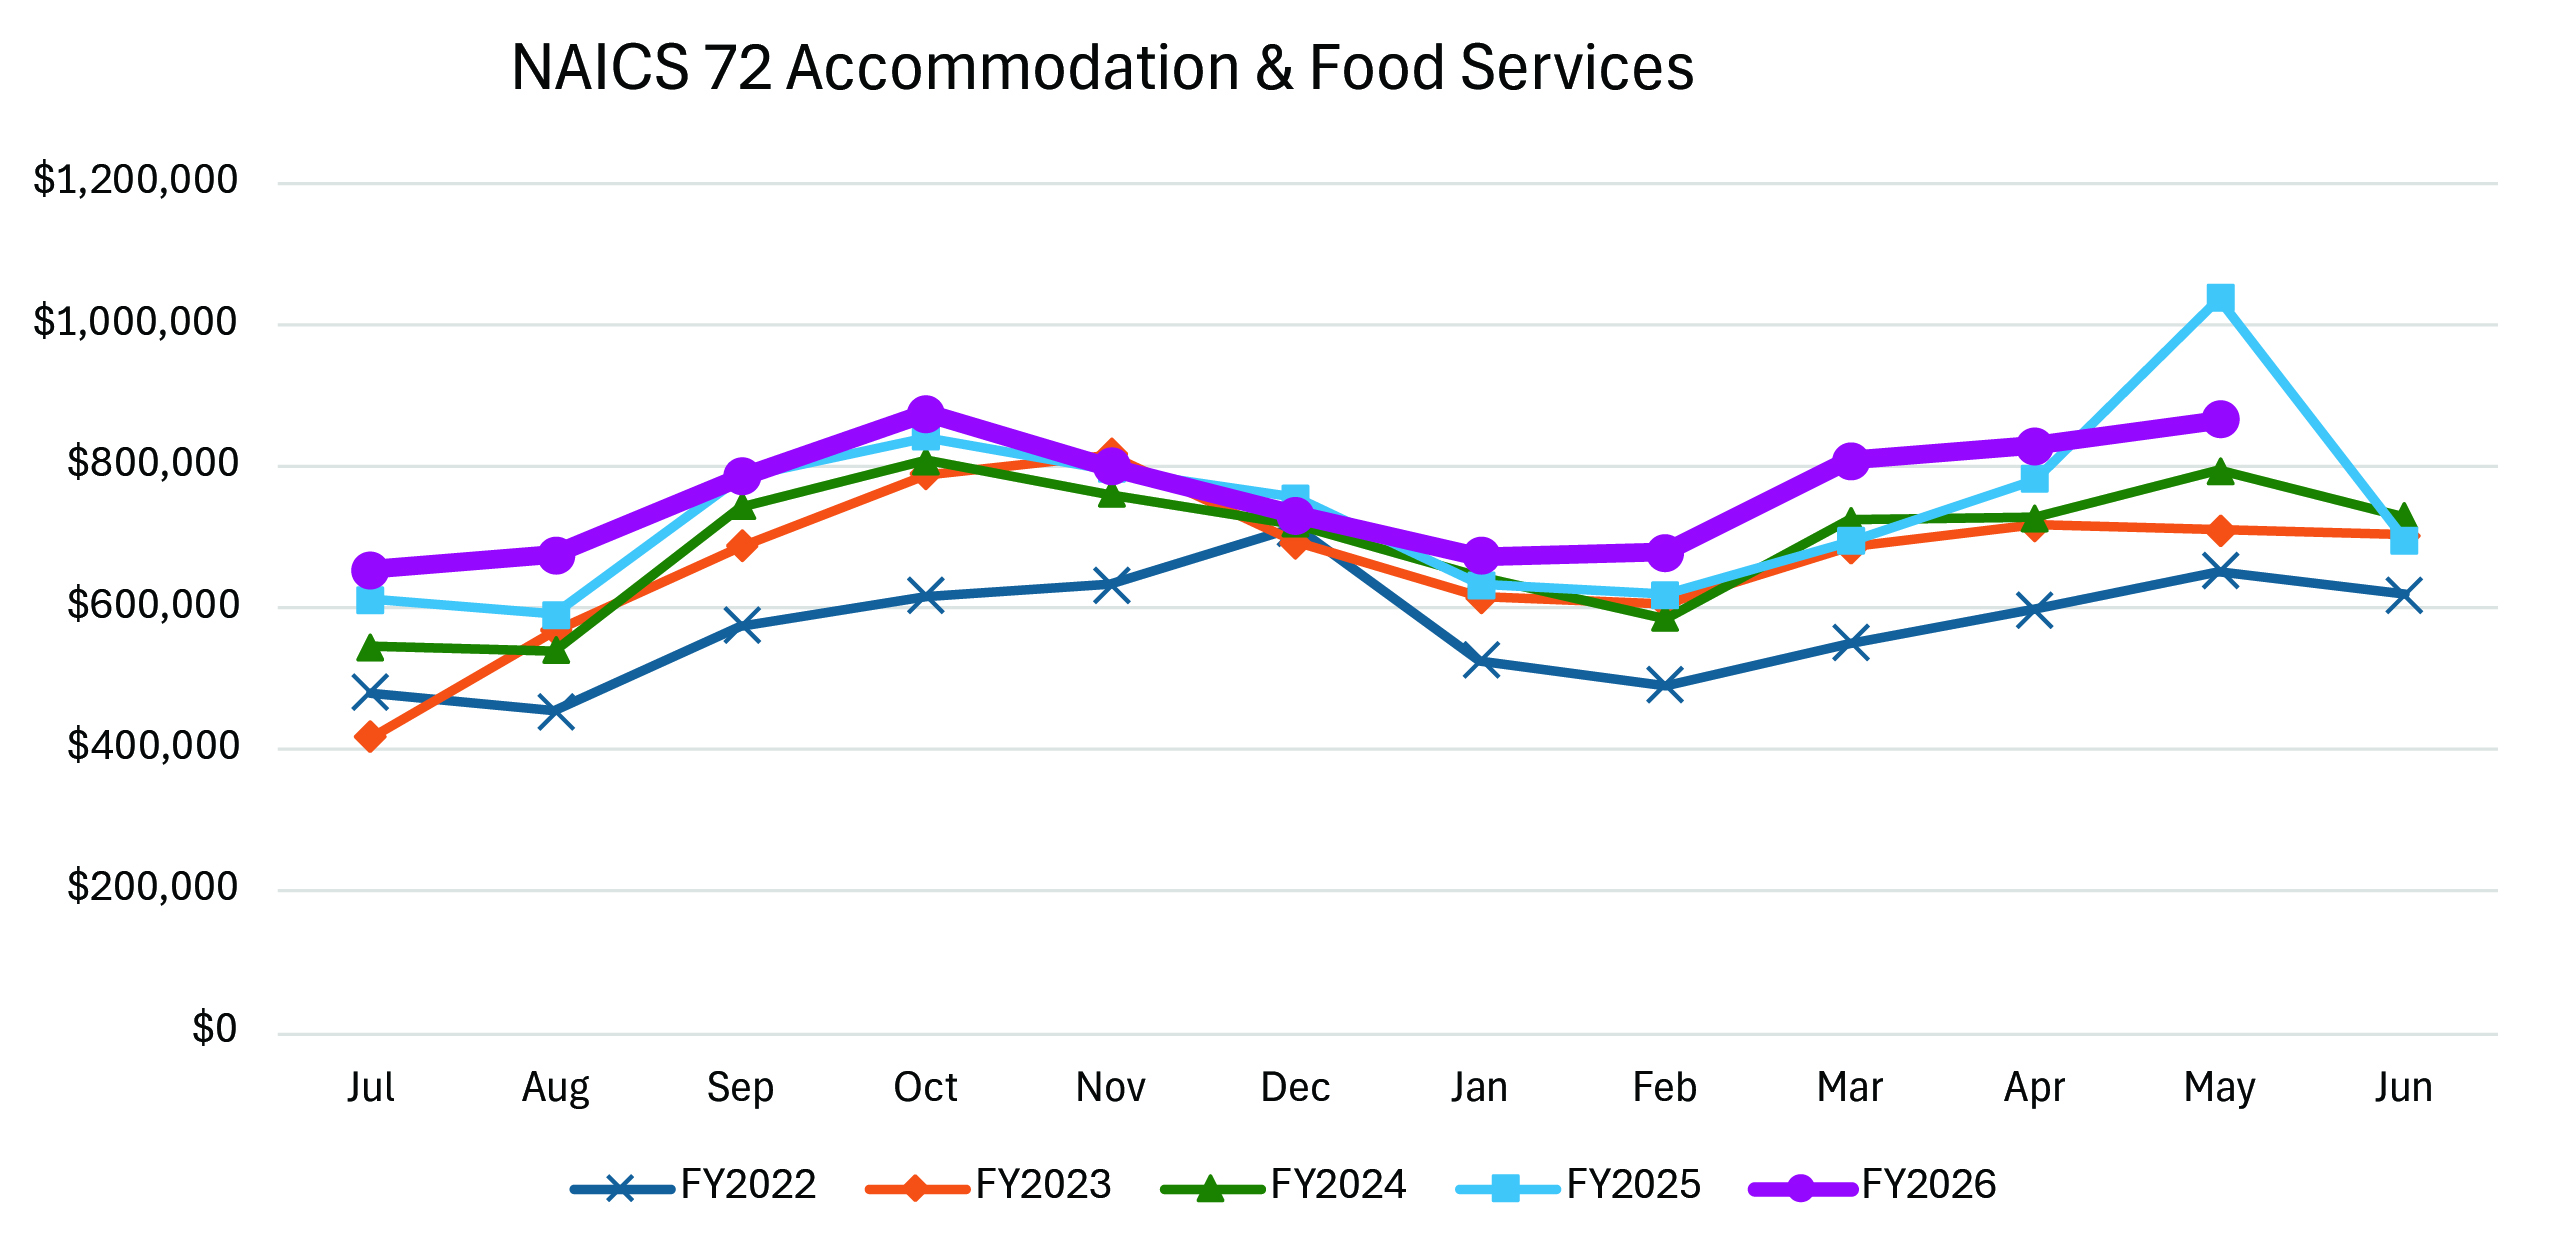
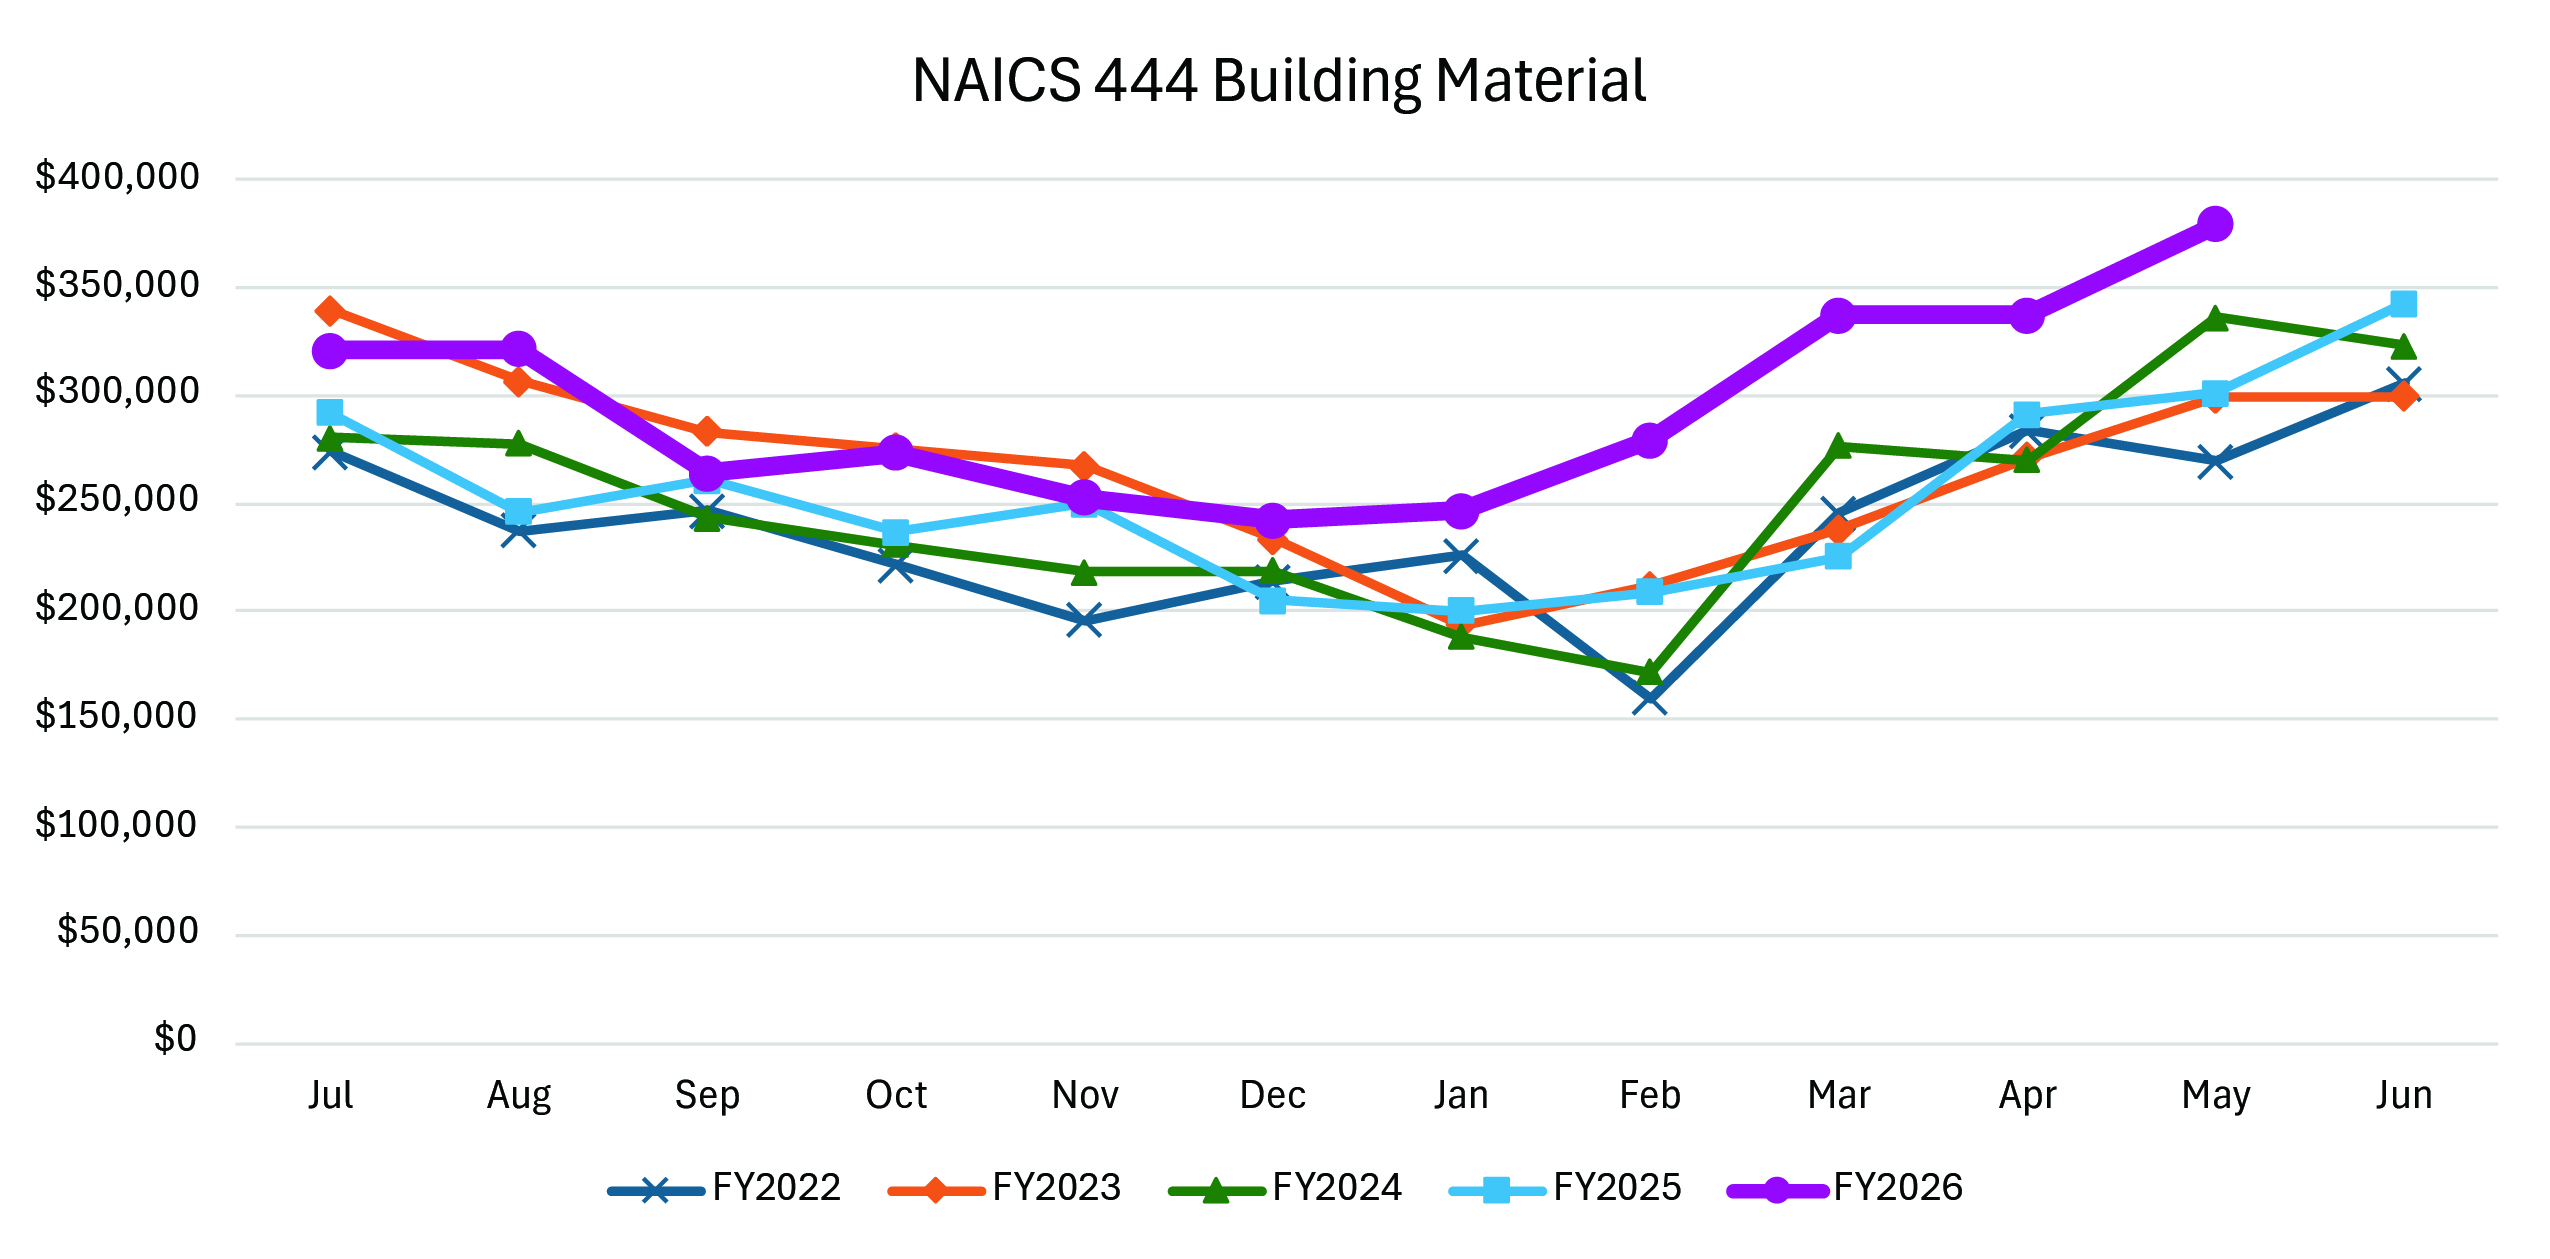
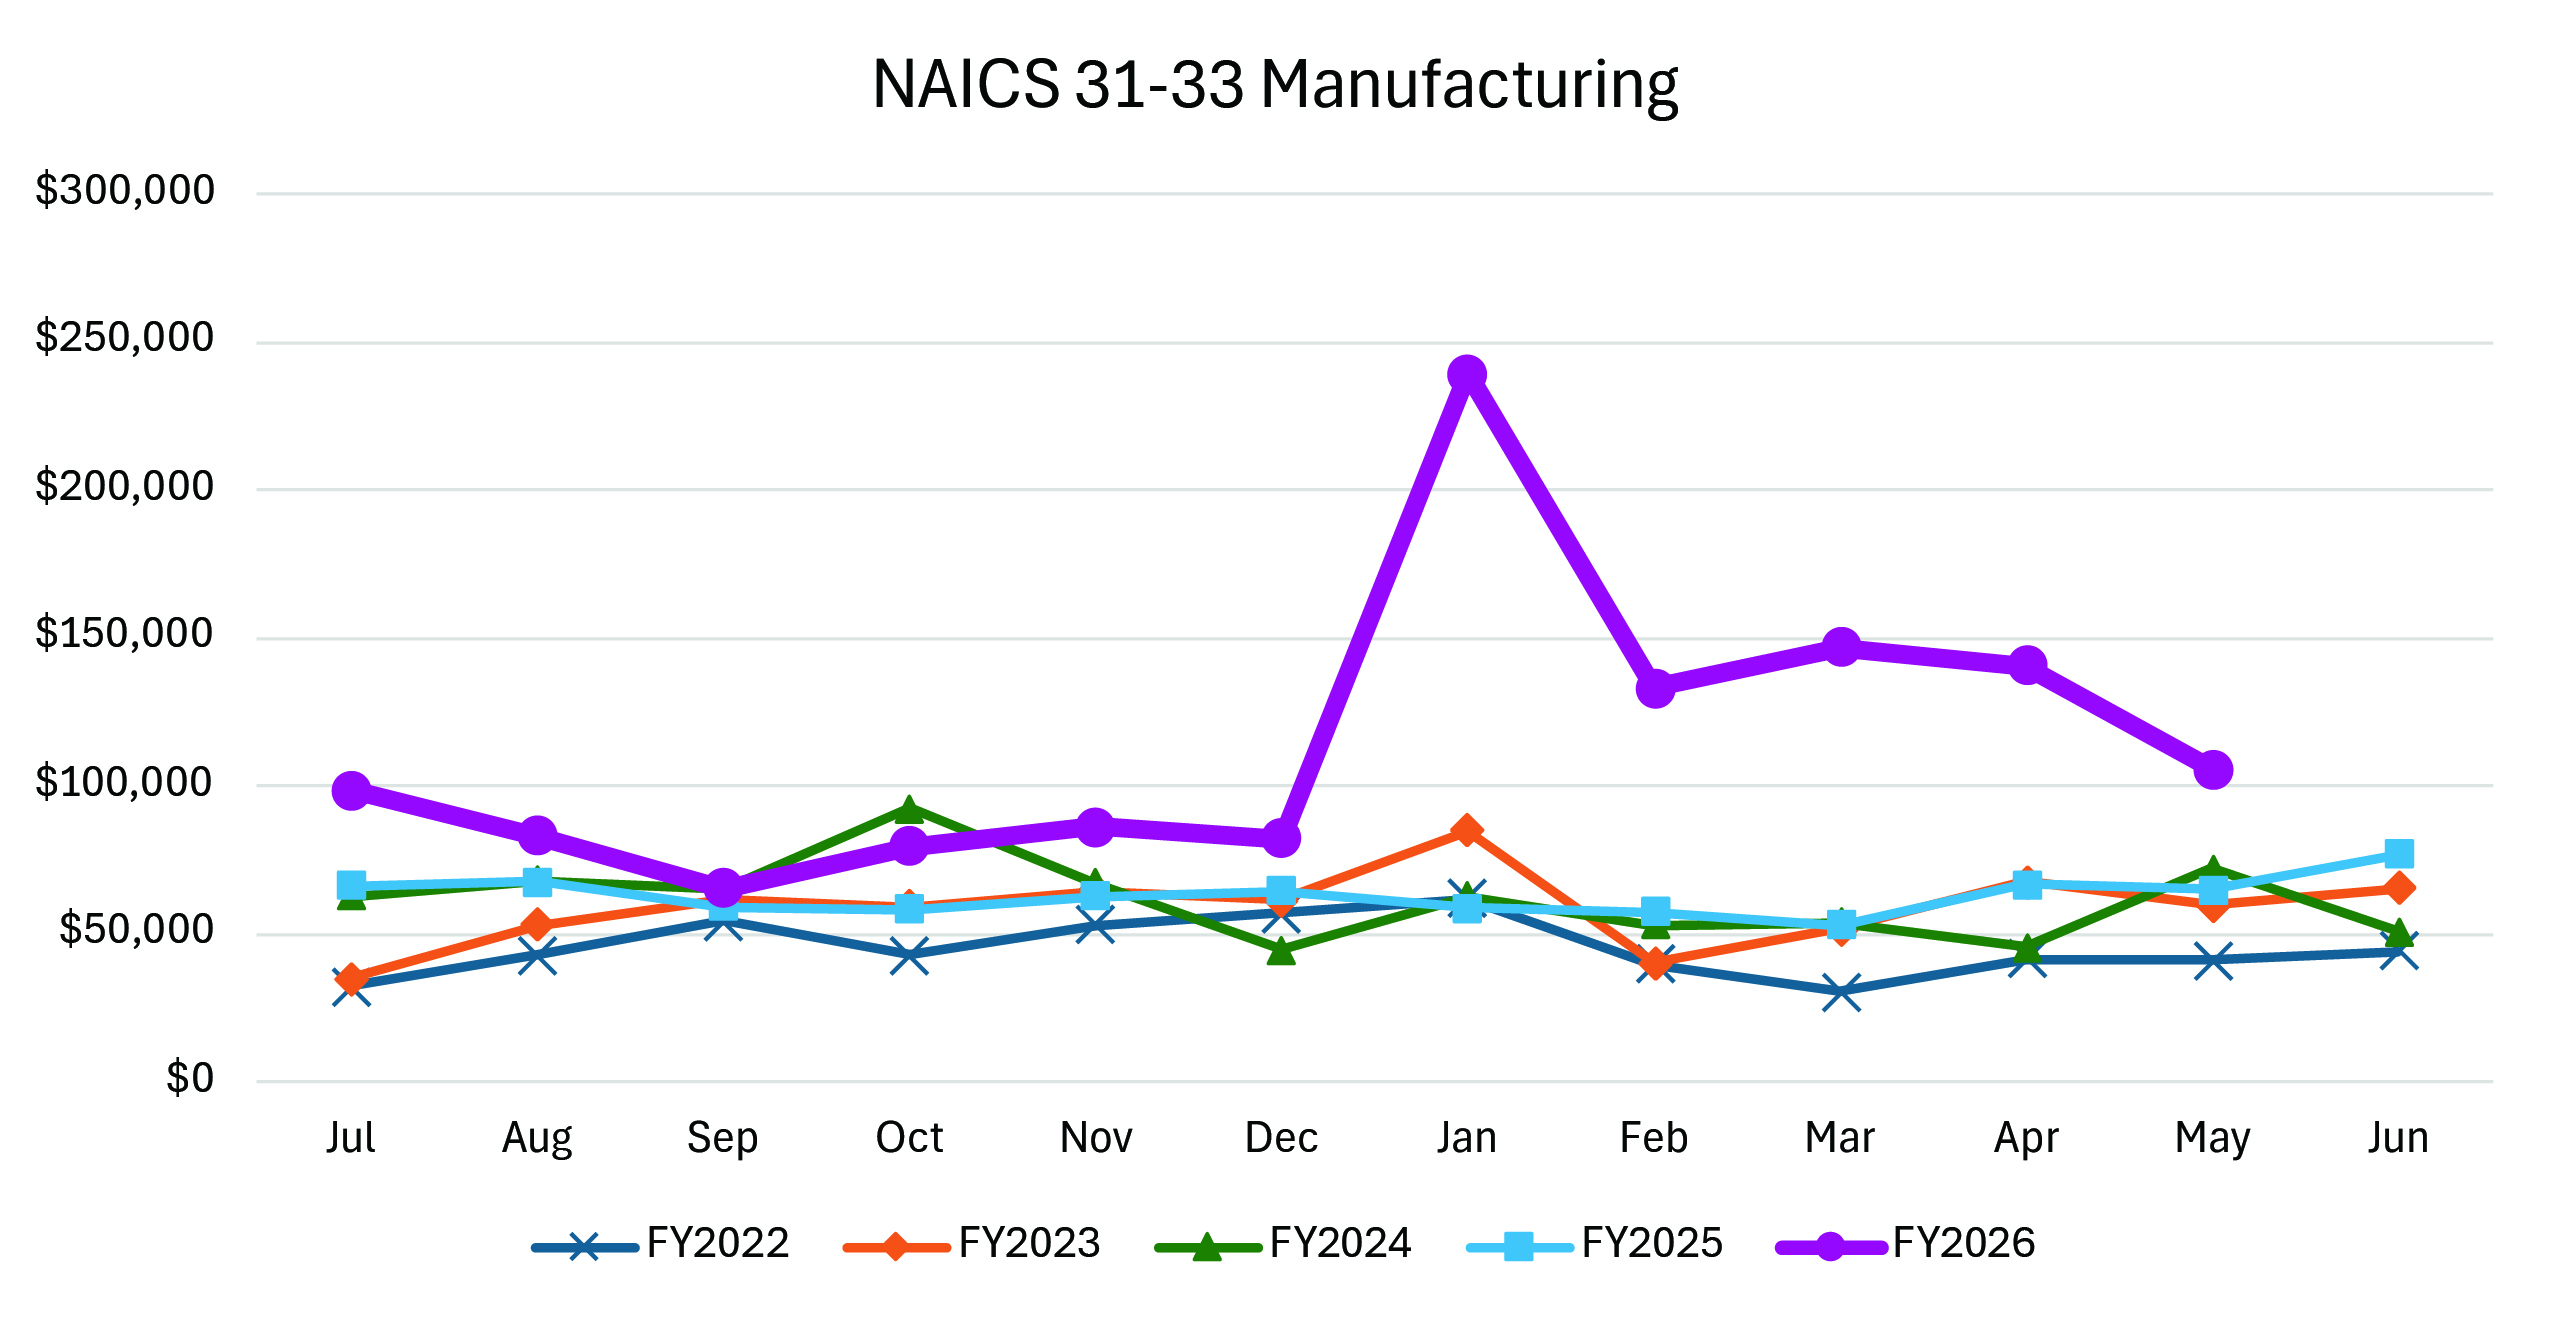 | Caption for Figure 2 A-F. Stillwater sales tax revenue from selected NAICS codes, FY2022-FY2026. Source: Oklahoma Taxpayer Access Point and author's calculation |
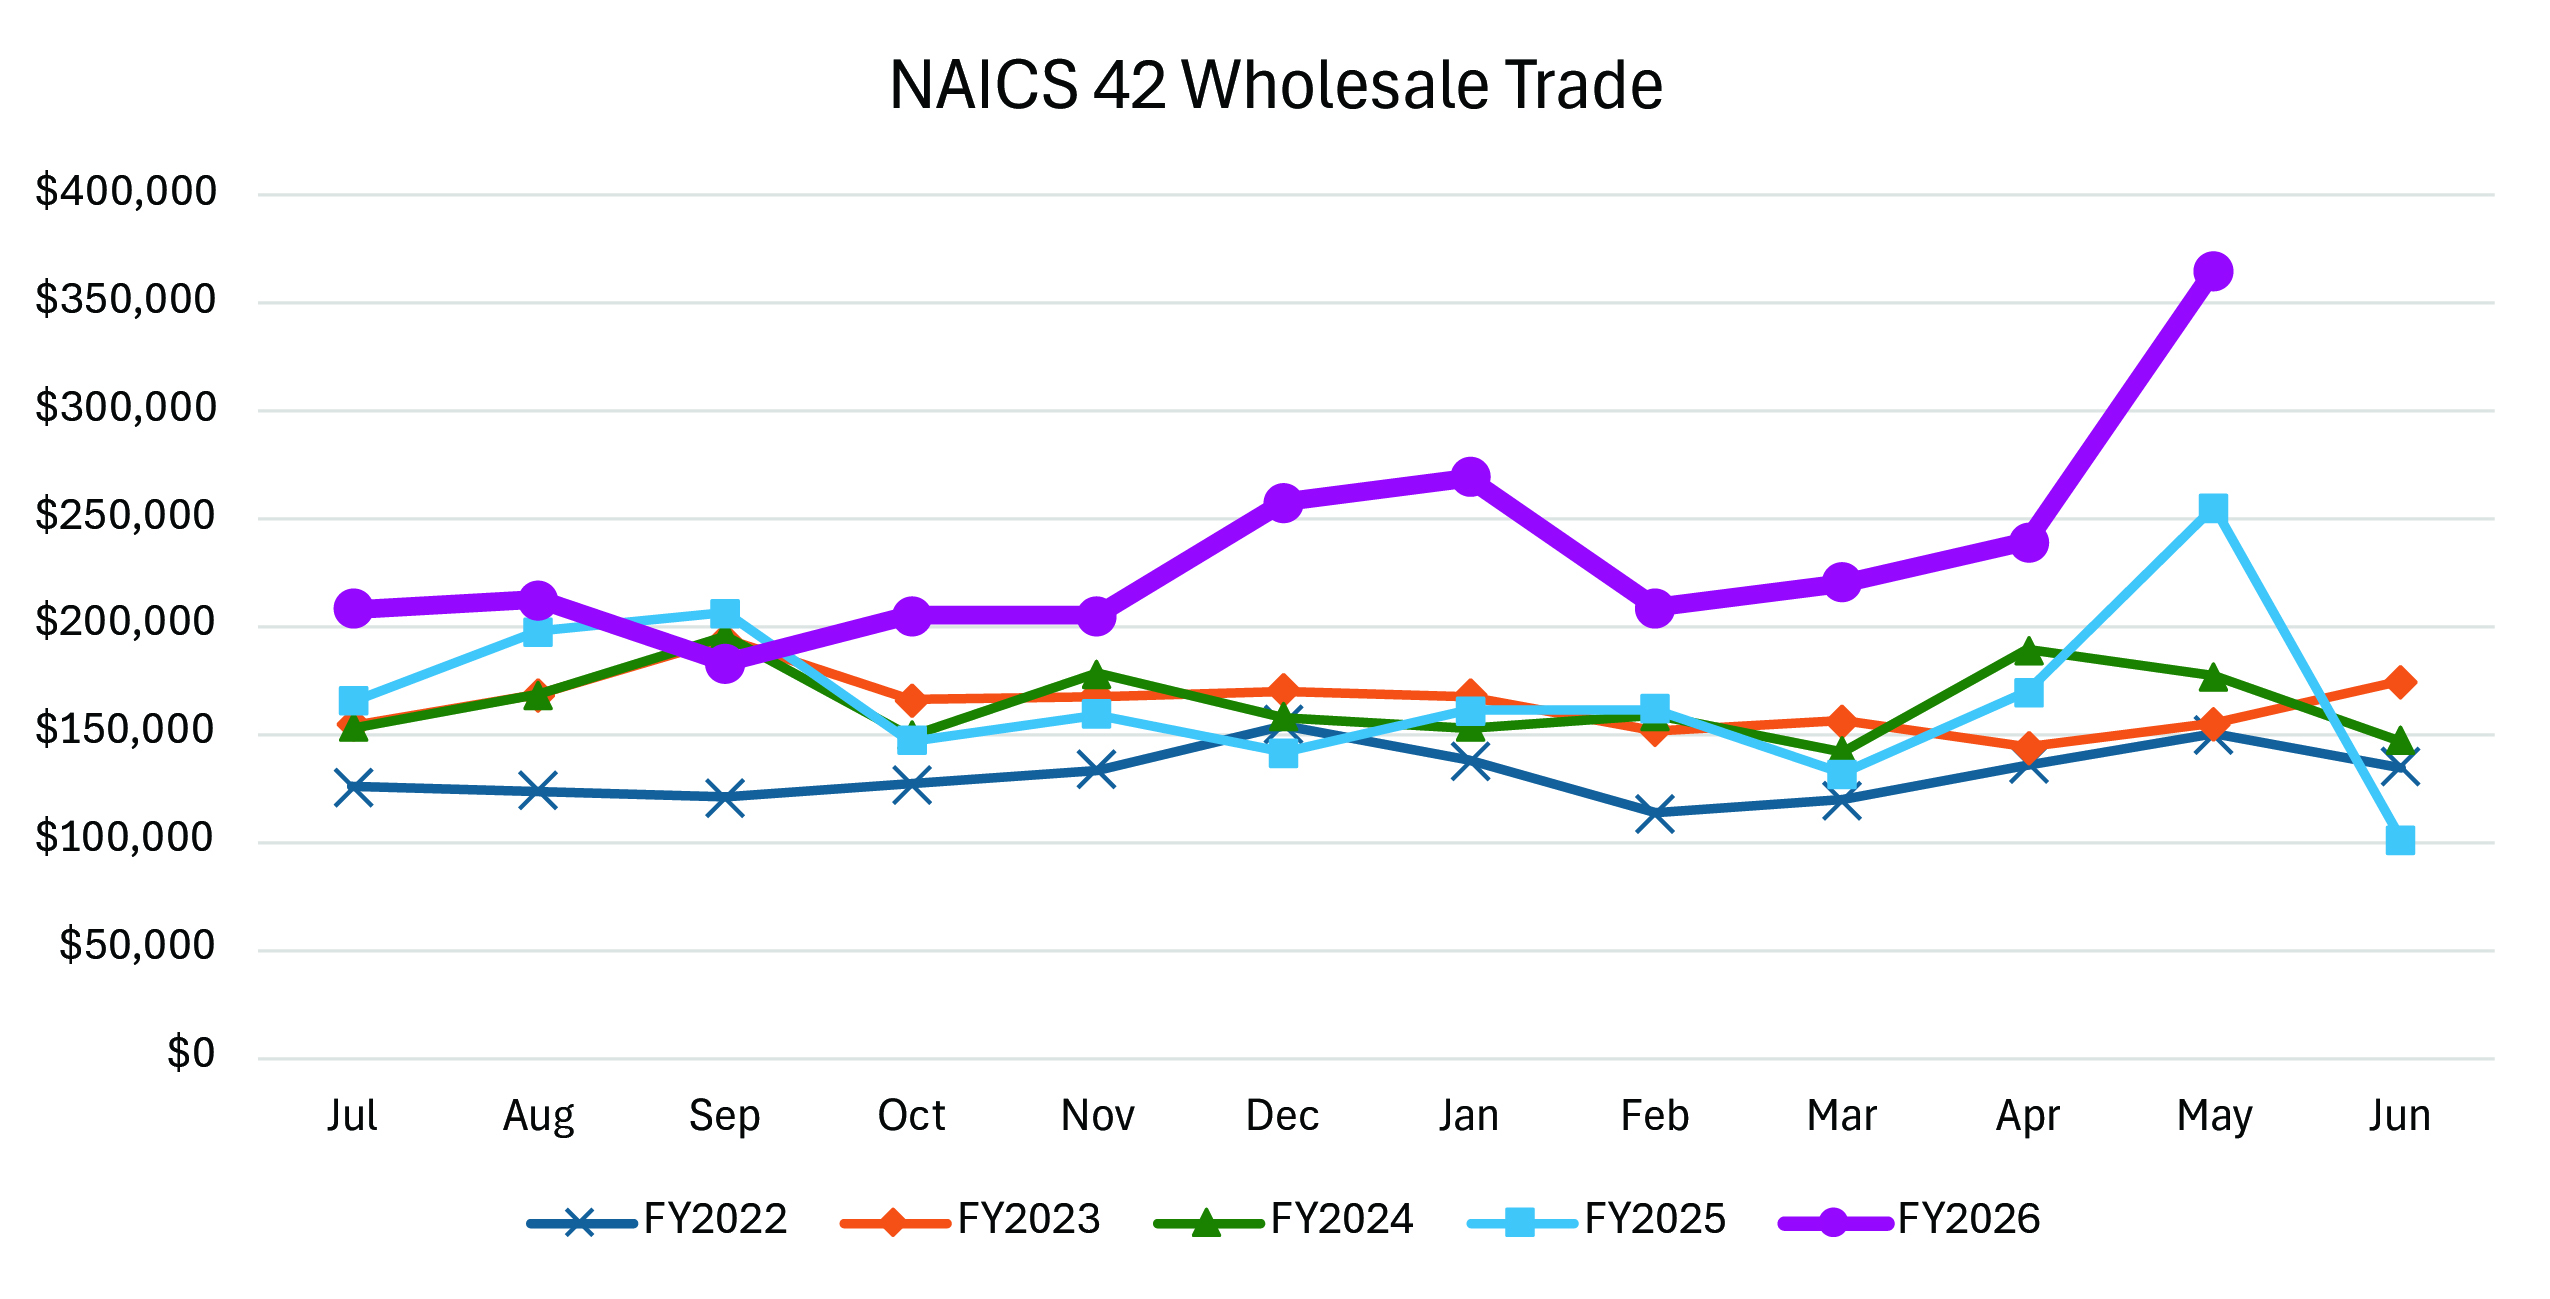 | Figure 2b. |
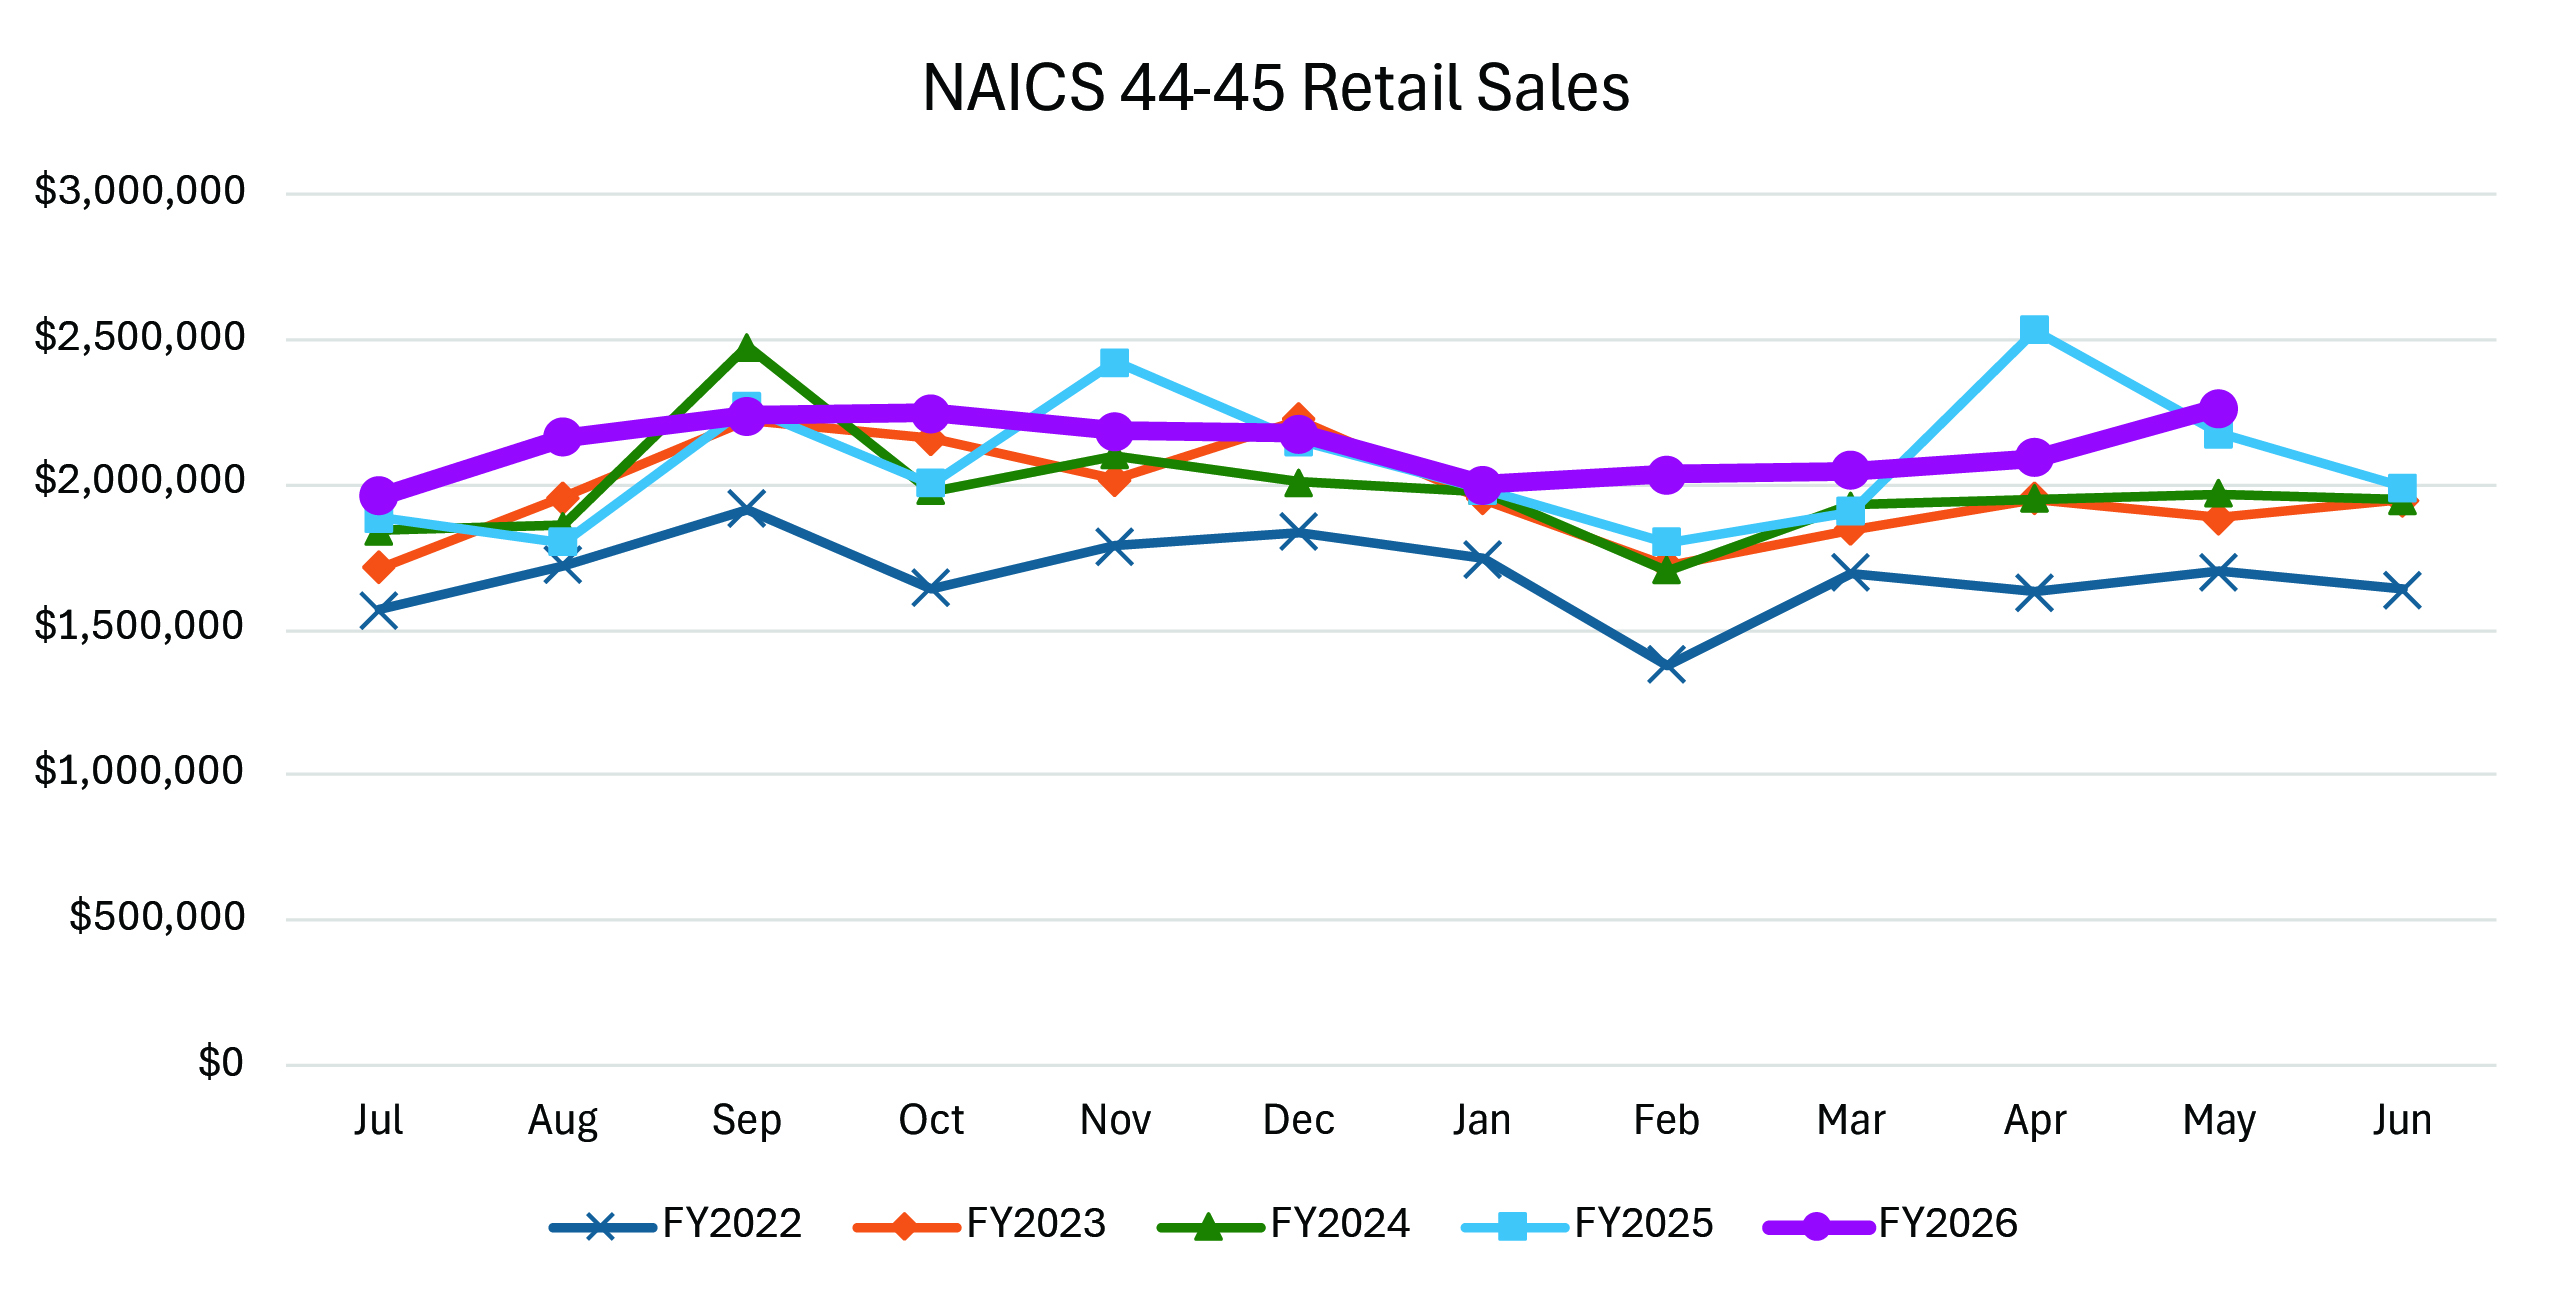 | Figure 2c. |
 | Figure 2d. |
 | Figure 2e. |
 | Figure 2f. |
Overall, Stillwater’s total tax collections show a steady upward trend from FY2022 through FY2026 (Figure 1), indicating a growing local economy with seasonal patterns. Notably, FY2026 tends to exhibit higher sales tax revenue than prior fiscal years, overlapping with the timeline of data center construction. In particular, the average monthly revenue for the 6-month period starting in December 2025 (roughly when data center construction started) was 9% higher than the same period a year prior (~$300,000 per month increase). However, it is necessary to examine sector-level trends to better understand if this increase can plausibly be attributed to construction activity.
Manufacturing (NAICS 31-33), wholesale trade (NAICS 42), retail sales (NAICS 44–45), real estate and rental and leasing (NAICS 53), accommodation and food services (NAICS 72) and building materials (NAICS 444) are the industry sectors we hypothesize would be most impacted by data center construction activity due to demand for building inputs and support for temporary workers. As shown in Figure 2, we see increased sales tax revenue during the data center construction period, with manufacturing, wholesale trade, real estate and rental and leasing and building materials sectors seeing the most significant increase.
For the 6-month period starting in December 2025, there was a roughly 130% increase (~$70,000) in monthly sales tax revenue from manufacturing (NAICS 31-33) compared to the prior fiscal year. This is likely to reflect the heightened production of construction materials and equipment needed for data center development. A similar pattern holds for wholesale trade (NAICS 42), which shows about a 50% monthly increase (~$80,000) over the same 6-month period as the year prior. This is consistent with increased bulk purchasing and distribution of building supplies needed for data center construction. Real estate and rental and leasing (NAICS 53) tax revenue has also more than doubled (~$50,000) in the most recent months. This could potentially be driven by land transactions, equipment leasing and temporary space needs associated with large-scale development, though the sharp increase in May could be an outlier. Finally, building materials (NAICS 444) also saw a substantial increase from December to May 2026. The average monthly revenue here is up over 27% (~$65,000) compared to the same 6-month period a year prior. This pattern is consistent with local purchasing of building inputs.
While smaller effects are seen across the other selected sectors, retail sales tax (NAICS 44-45) revenue is slightly higher in FY2026, specifically the December–May period. This suggests some impact from data center construction; however, the average monthly increase is only $10,000 (1%) higher than the same period a year prior. Similarly, accommodation and food services (NAICS 72) show modest increases in FY2026, while maintaining typical seasonal patterns. This may reflect spending by construction workers in hotels and restaurants. Sectors not included in Figure 2, such as utilities (NAICS 22), did not see much of an increase during the data center construction period.
These findings suggest that the Stillwater data center project has generated — and is likely to continue to generate — additional sales tax revenue, but that these gains are concentrated in specific sectors rather than broadly distributed across the local economy. This distinction is important because it suggests that the benefit of increased sales tax revenue from data center development depends on local conditions. Particularly, the presence of businesses positioned to supply construction inputs, provide leasing and real estate services and capture project-related spending by workers and contractors.
Muskogee
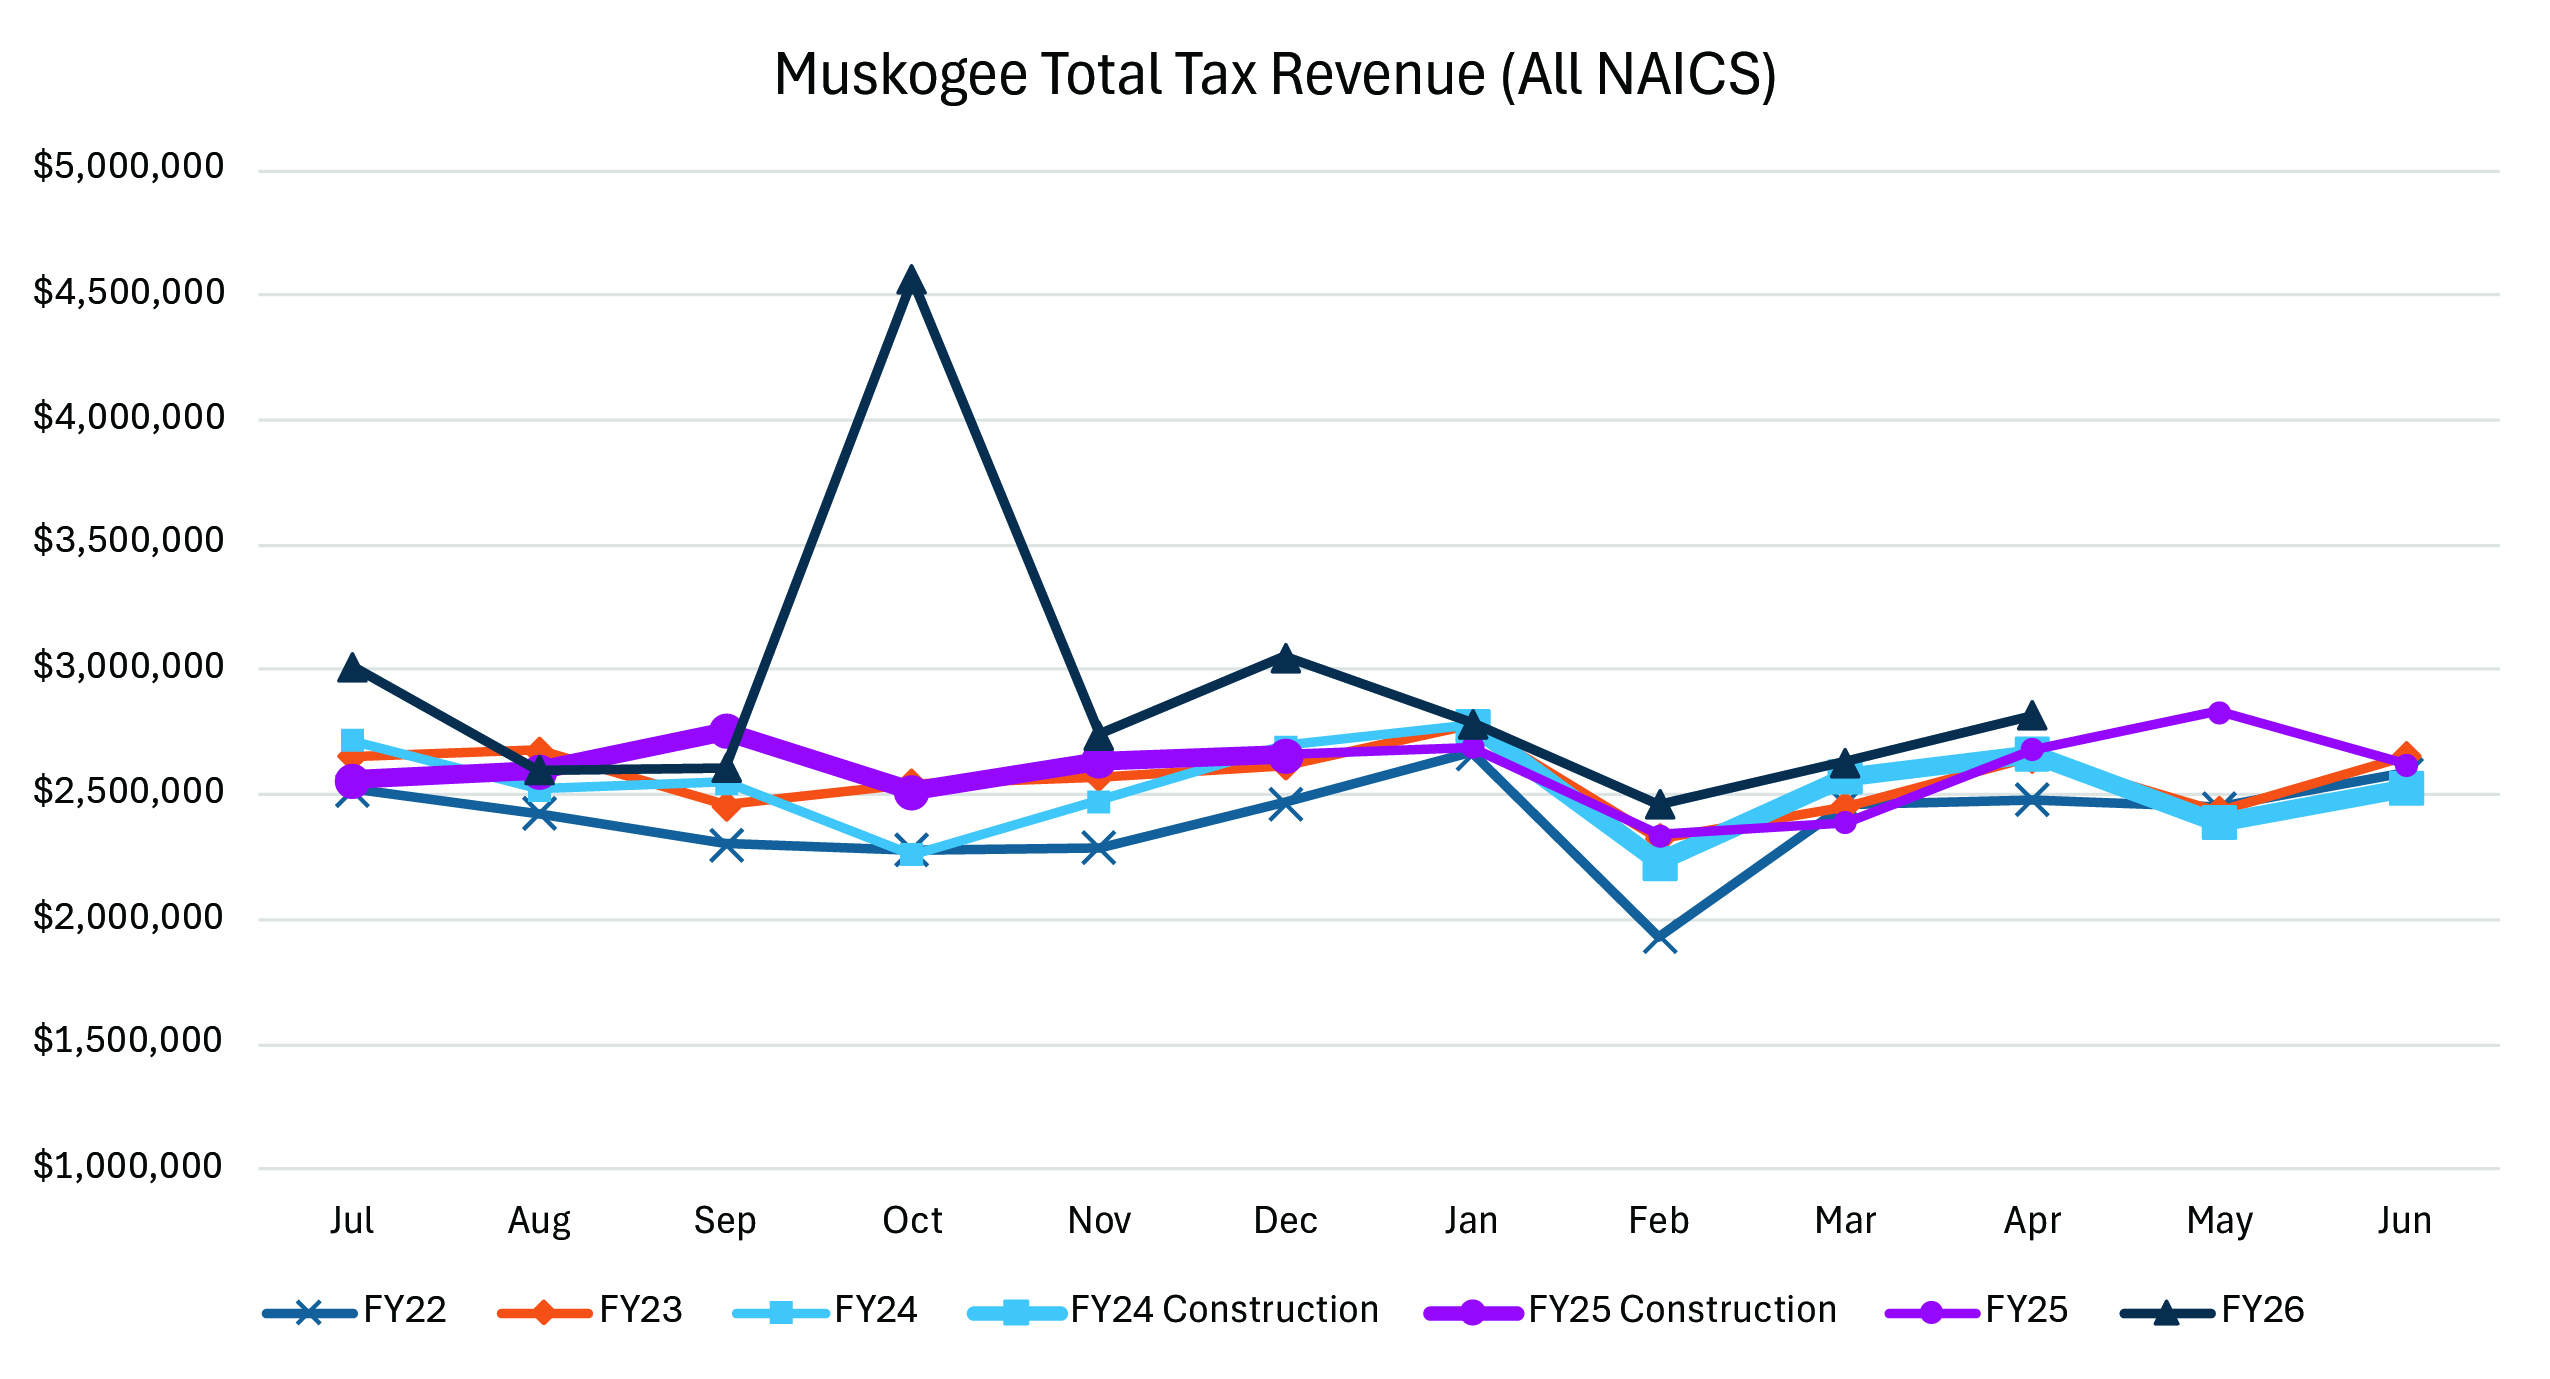 Figure 3. Muskogee sales tax revenue from all NAICS codes, FY2022-FY2026. Source: Oklahoma Taxpayer Access Point and author’s calculations.
| Image | Caption |
|---|---|
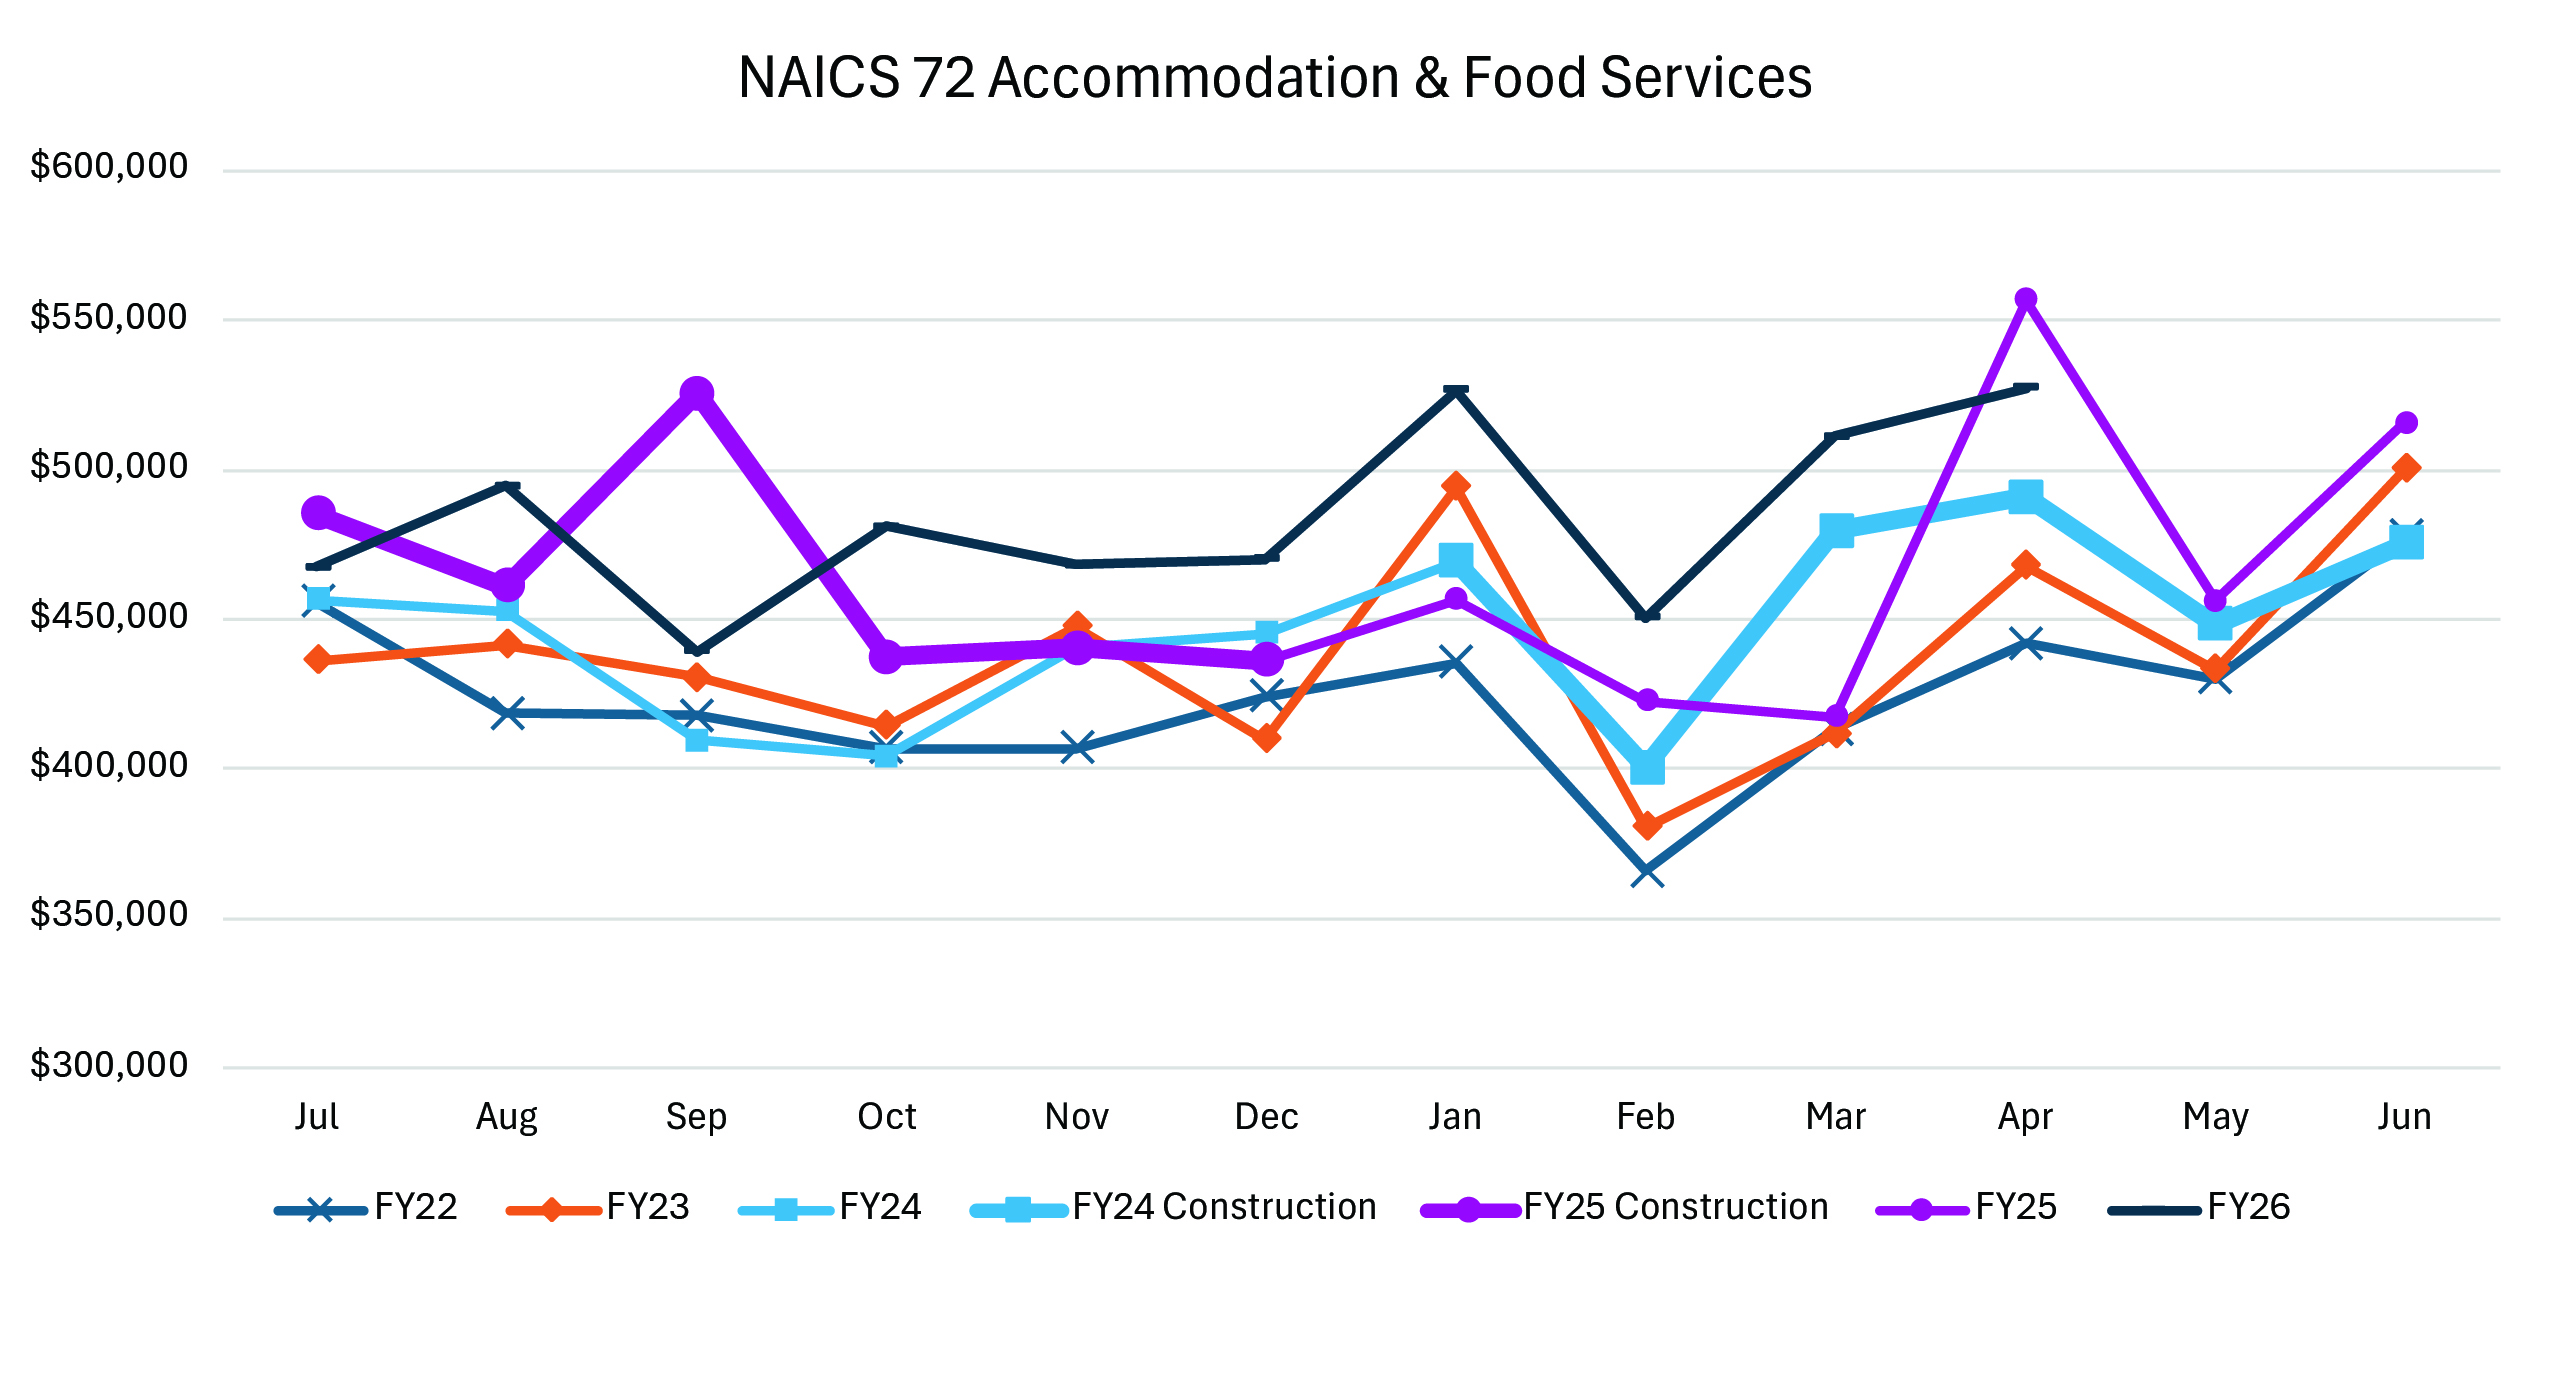
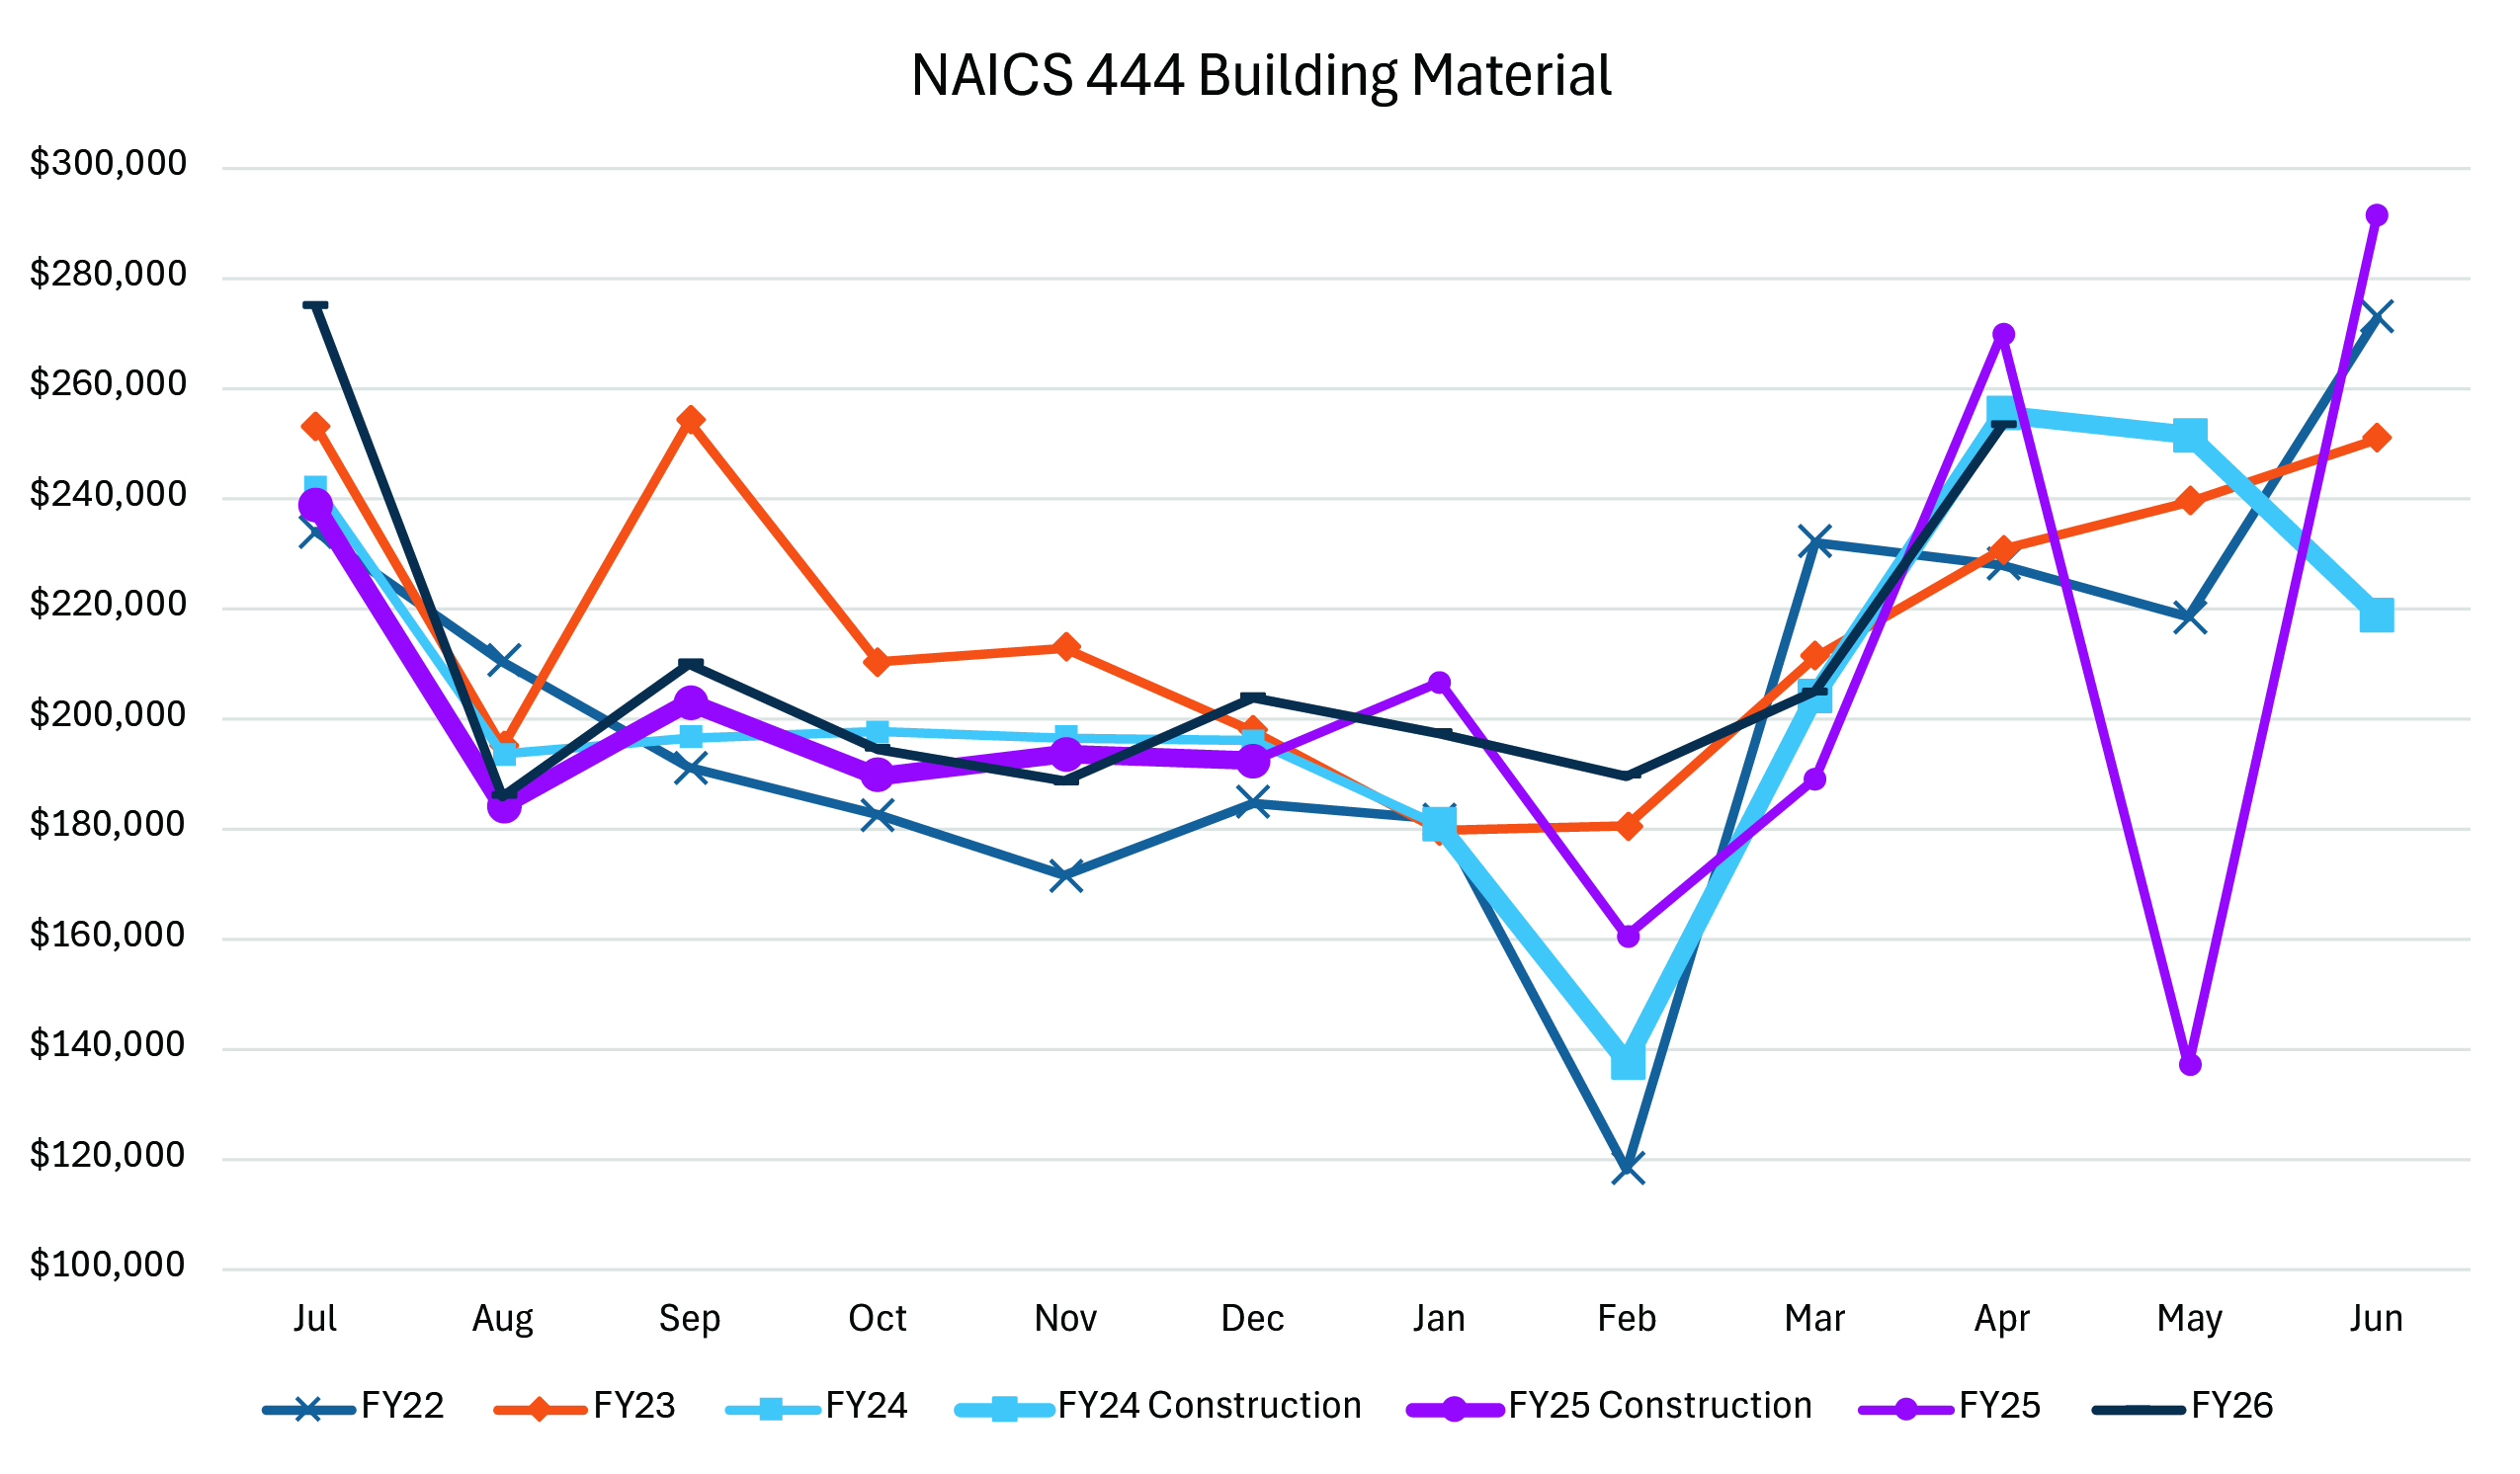
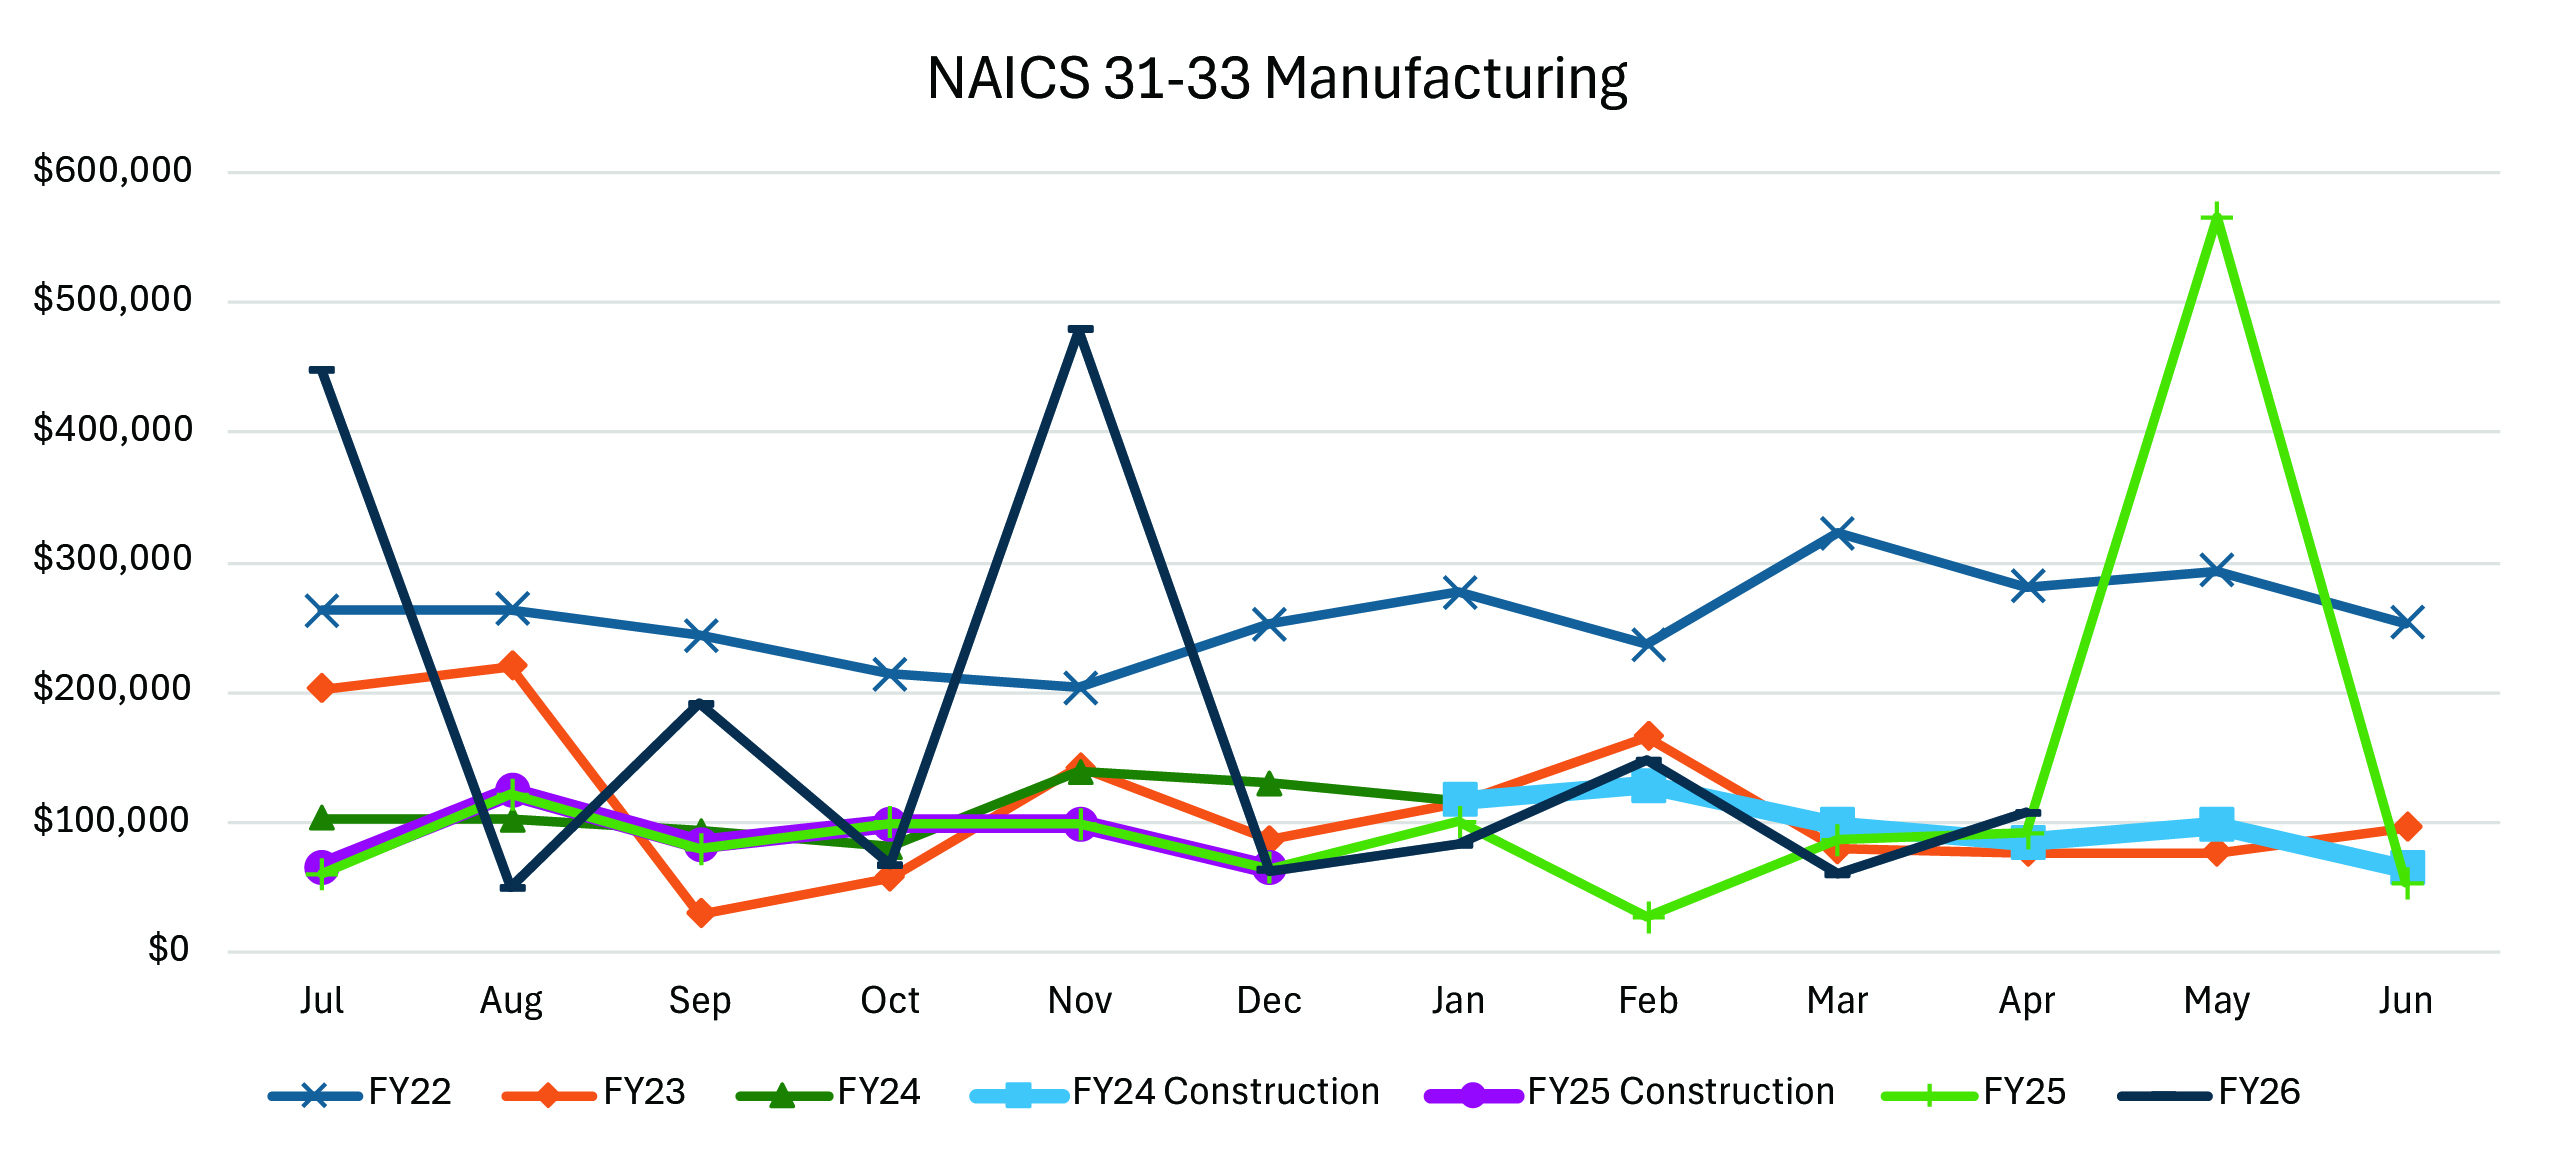 | Caption for Figure 4 A-F. Muskogee sales tax revenue from selected NAICS codes, FY2022–FY20 FY2026. Source: Oklahoma Taxpayer Access Point and author’s calculation. |
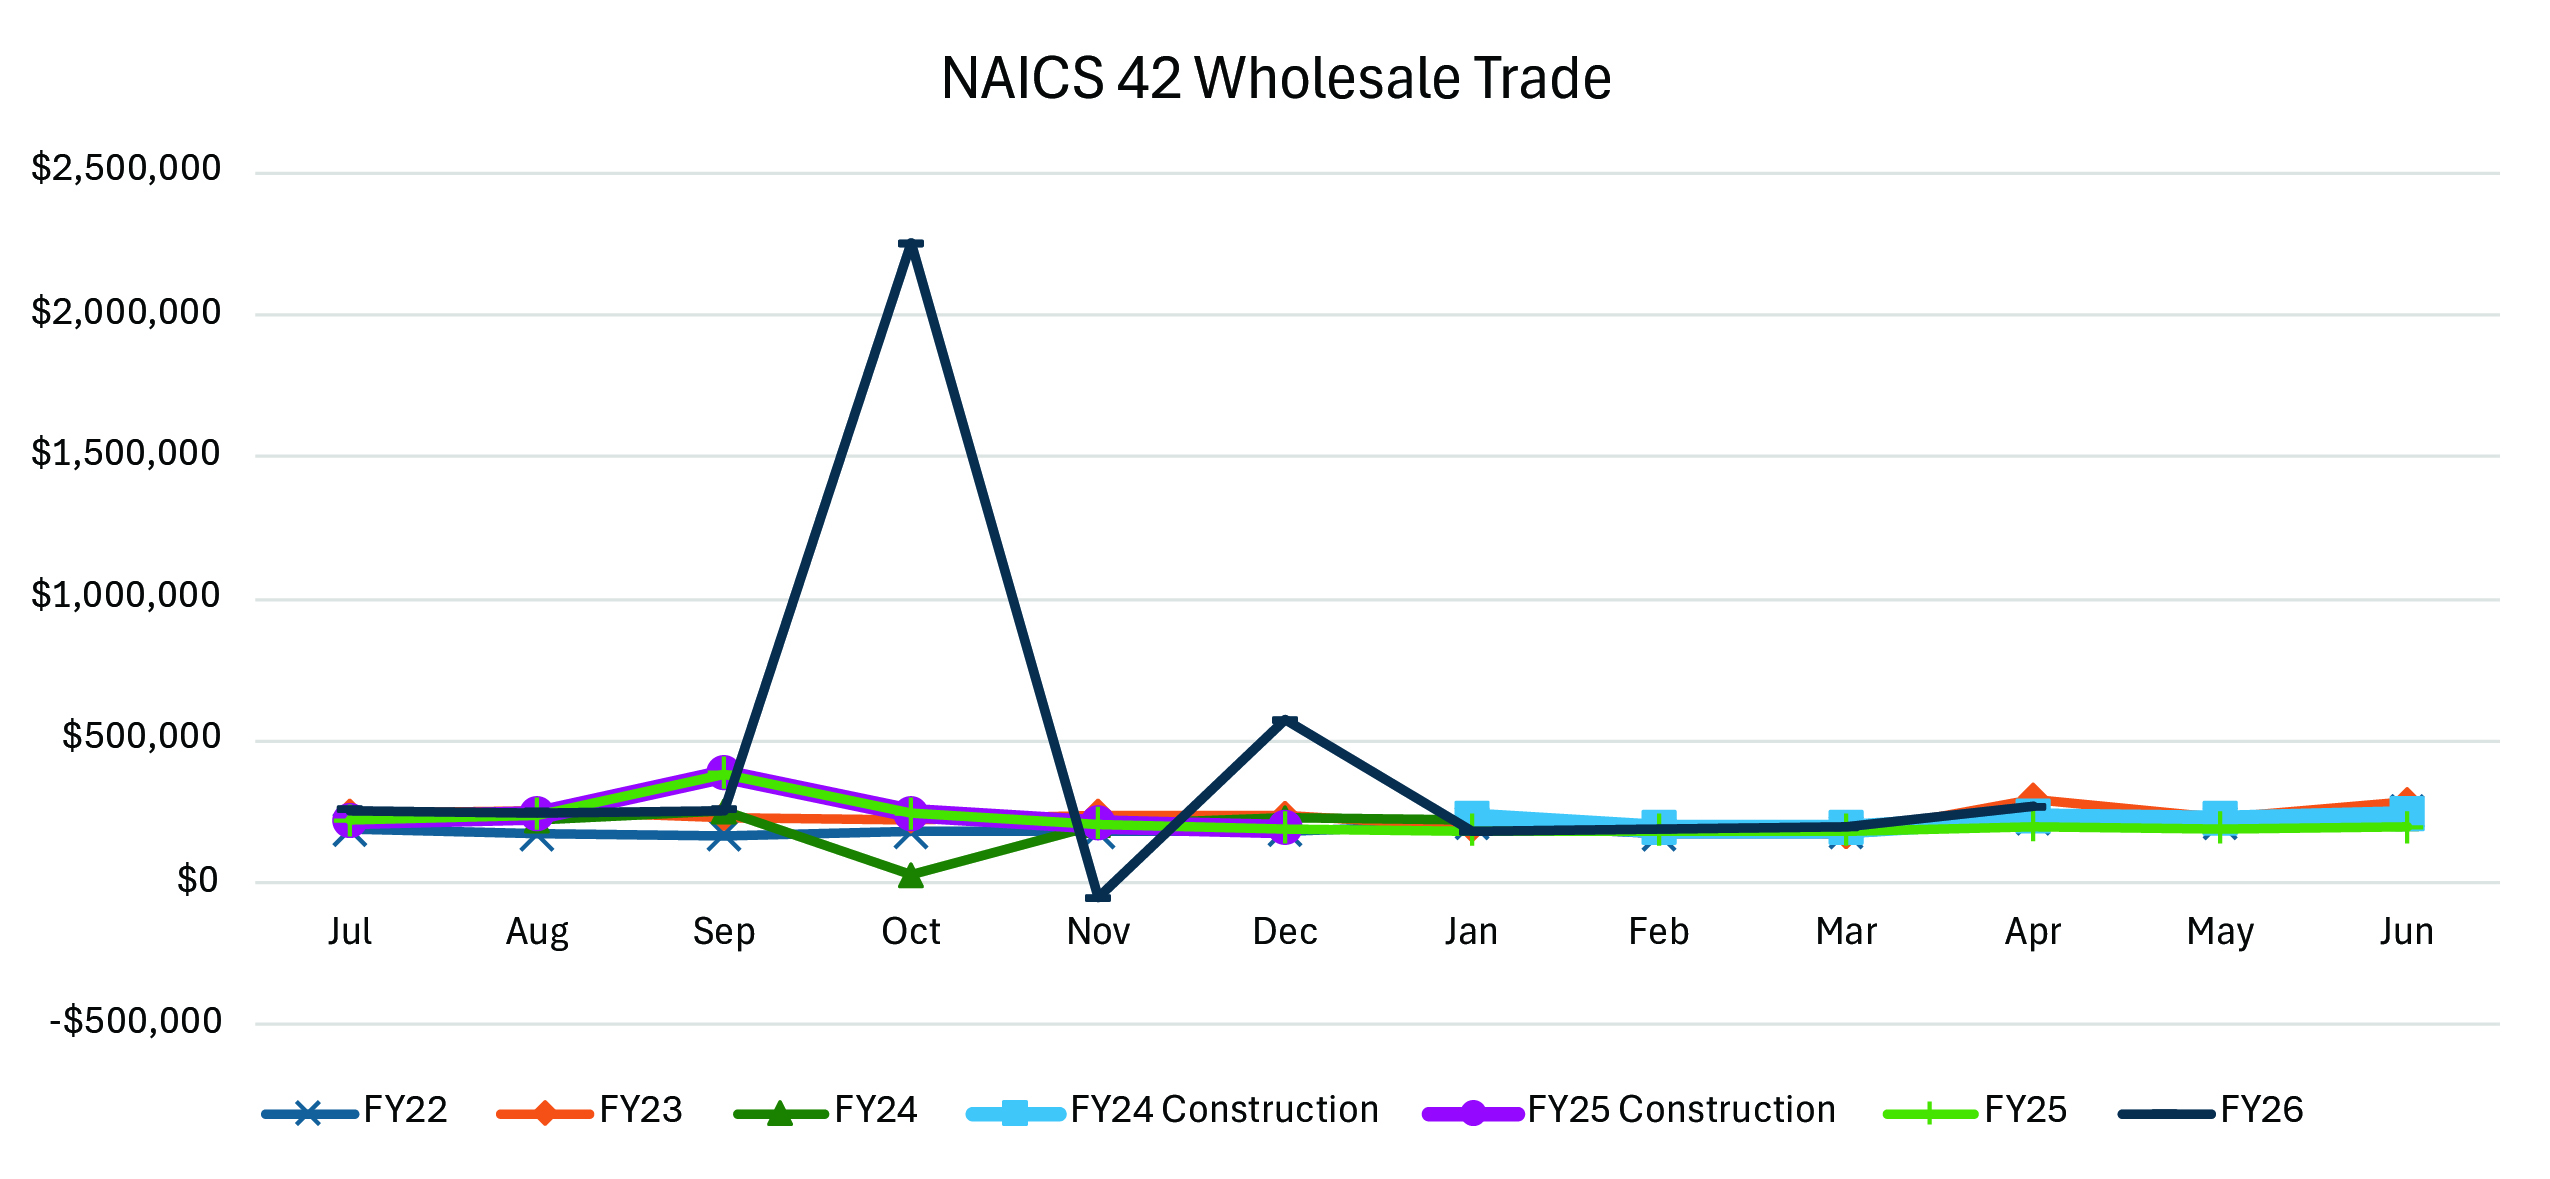 | Figure 4b. |
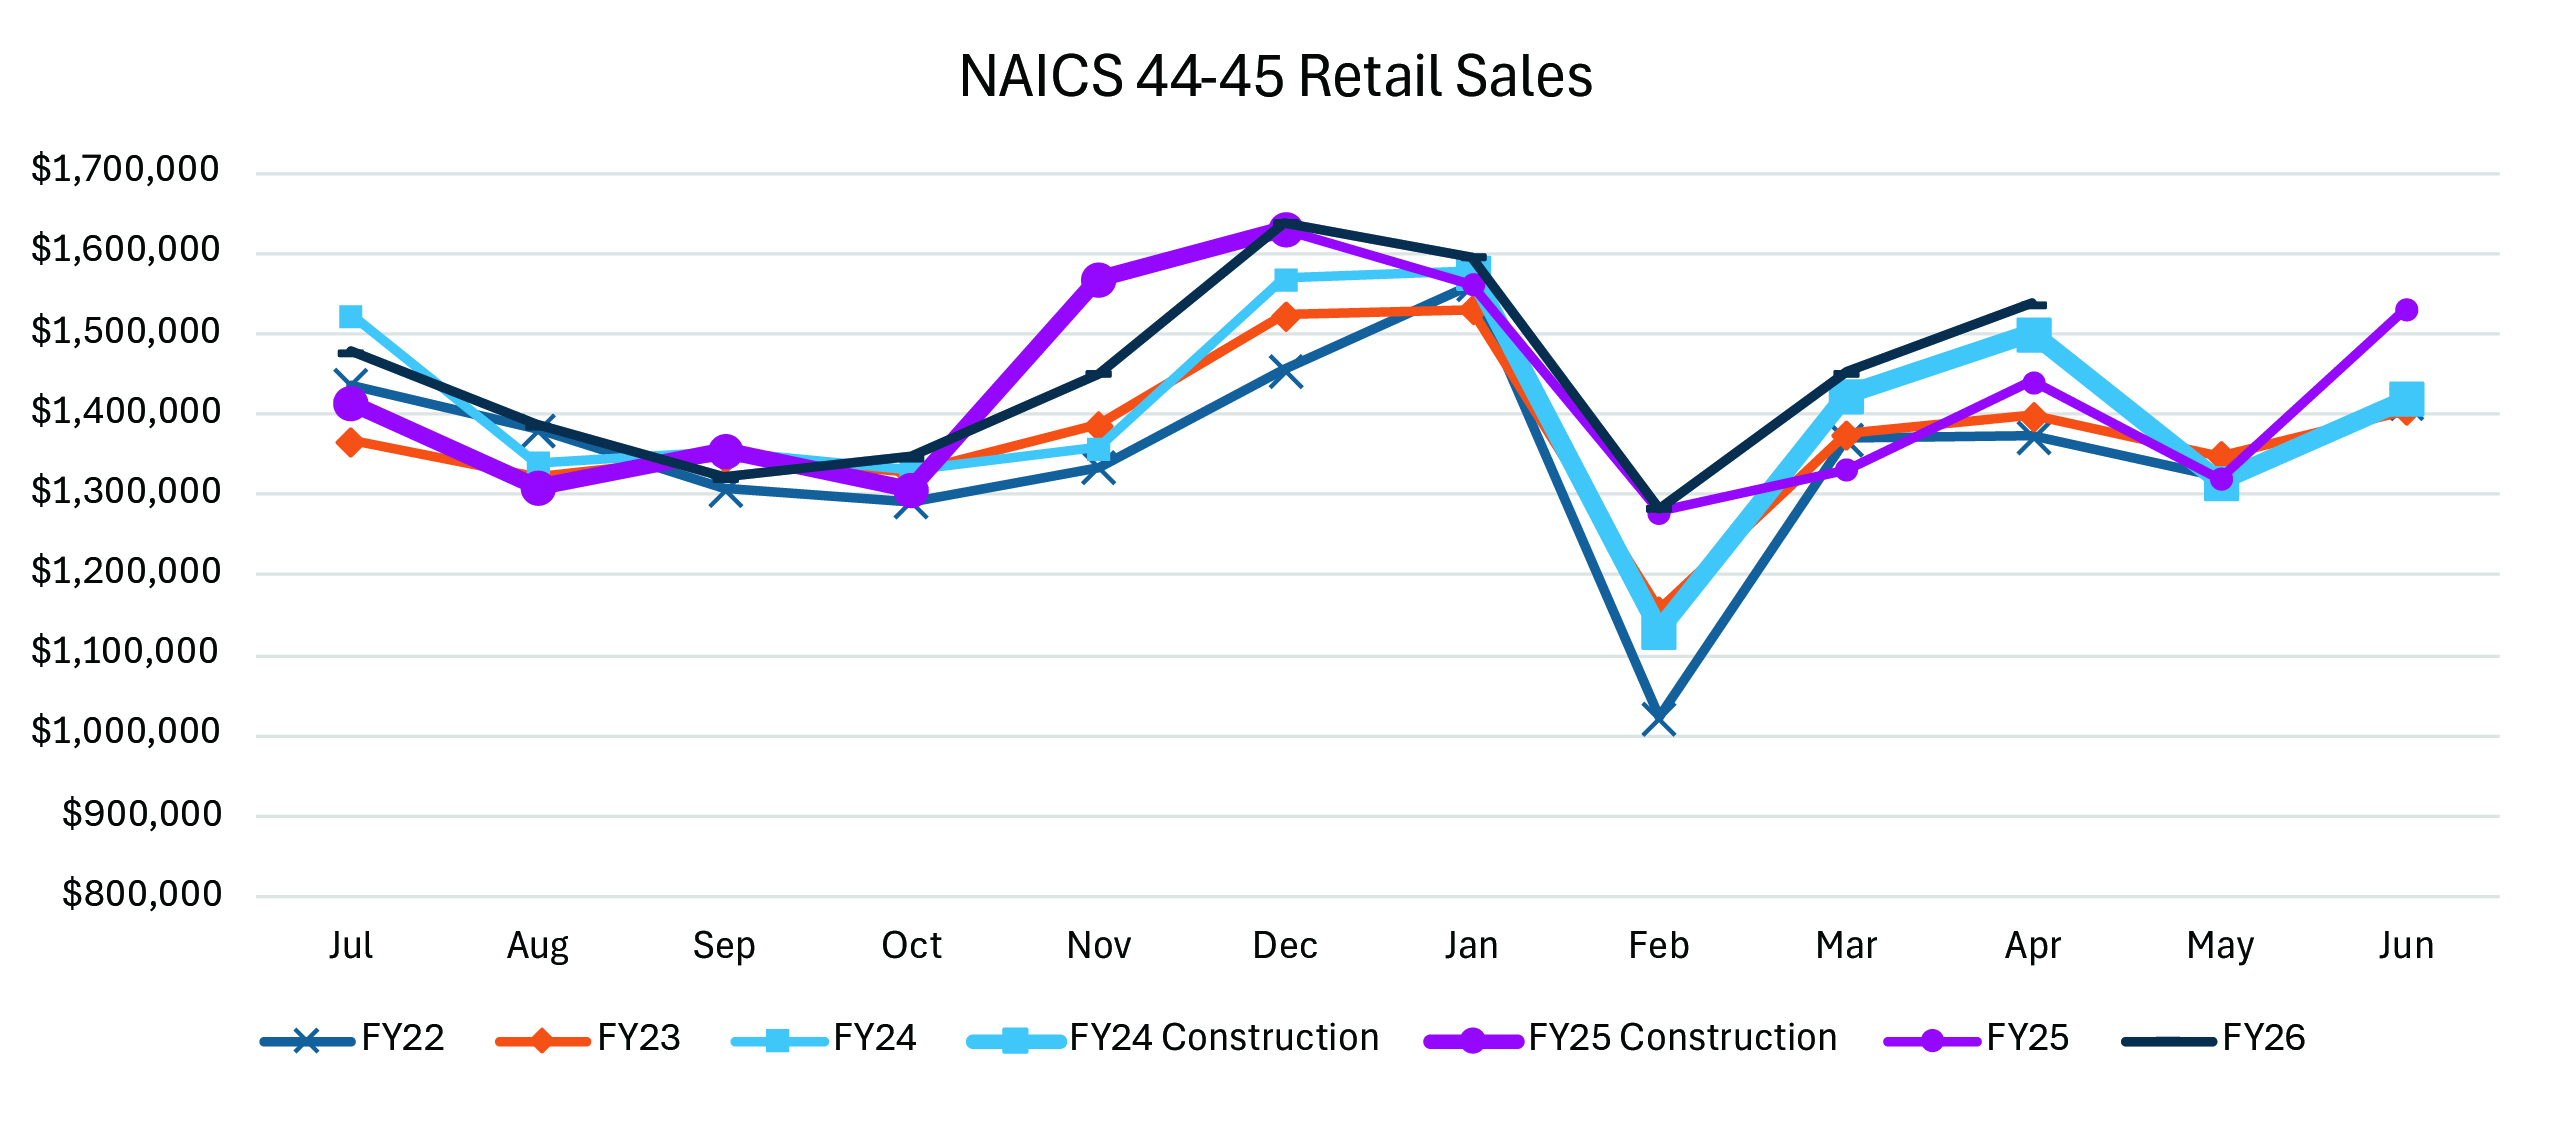 | Figure 4c. |
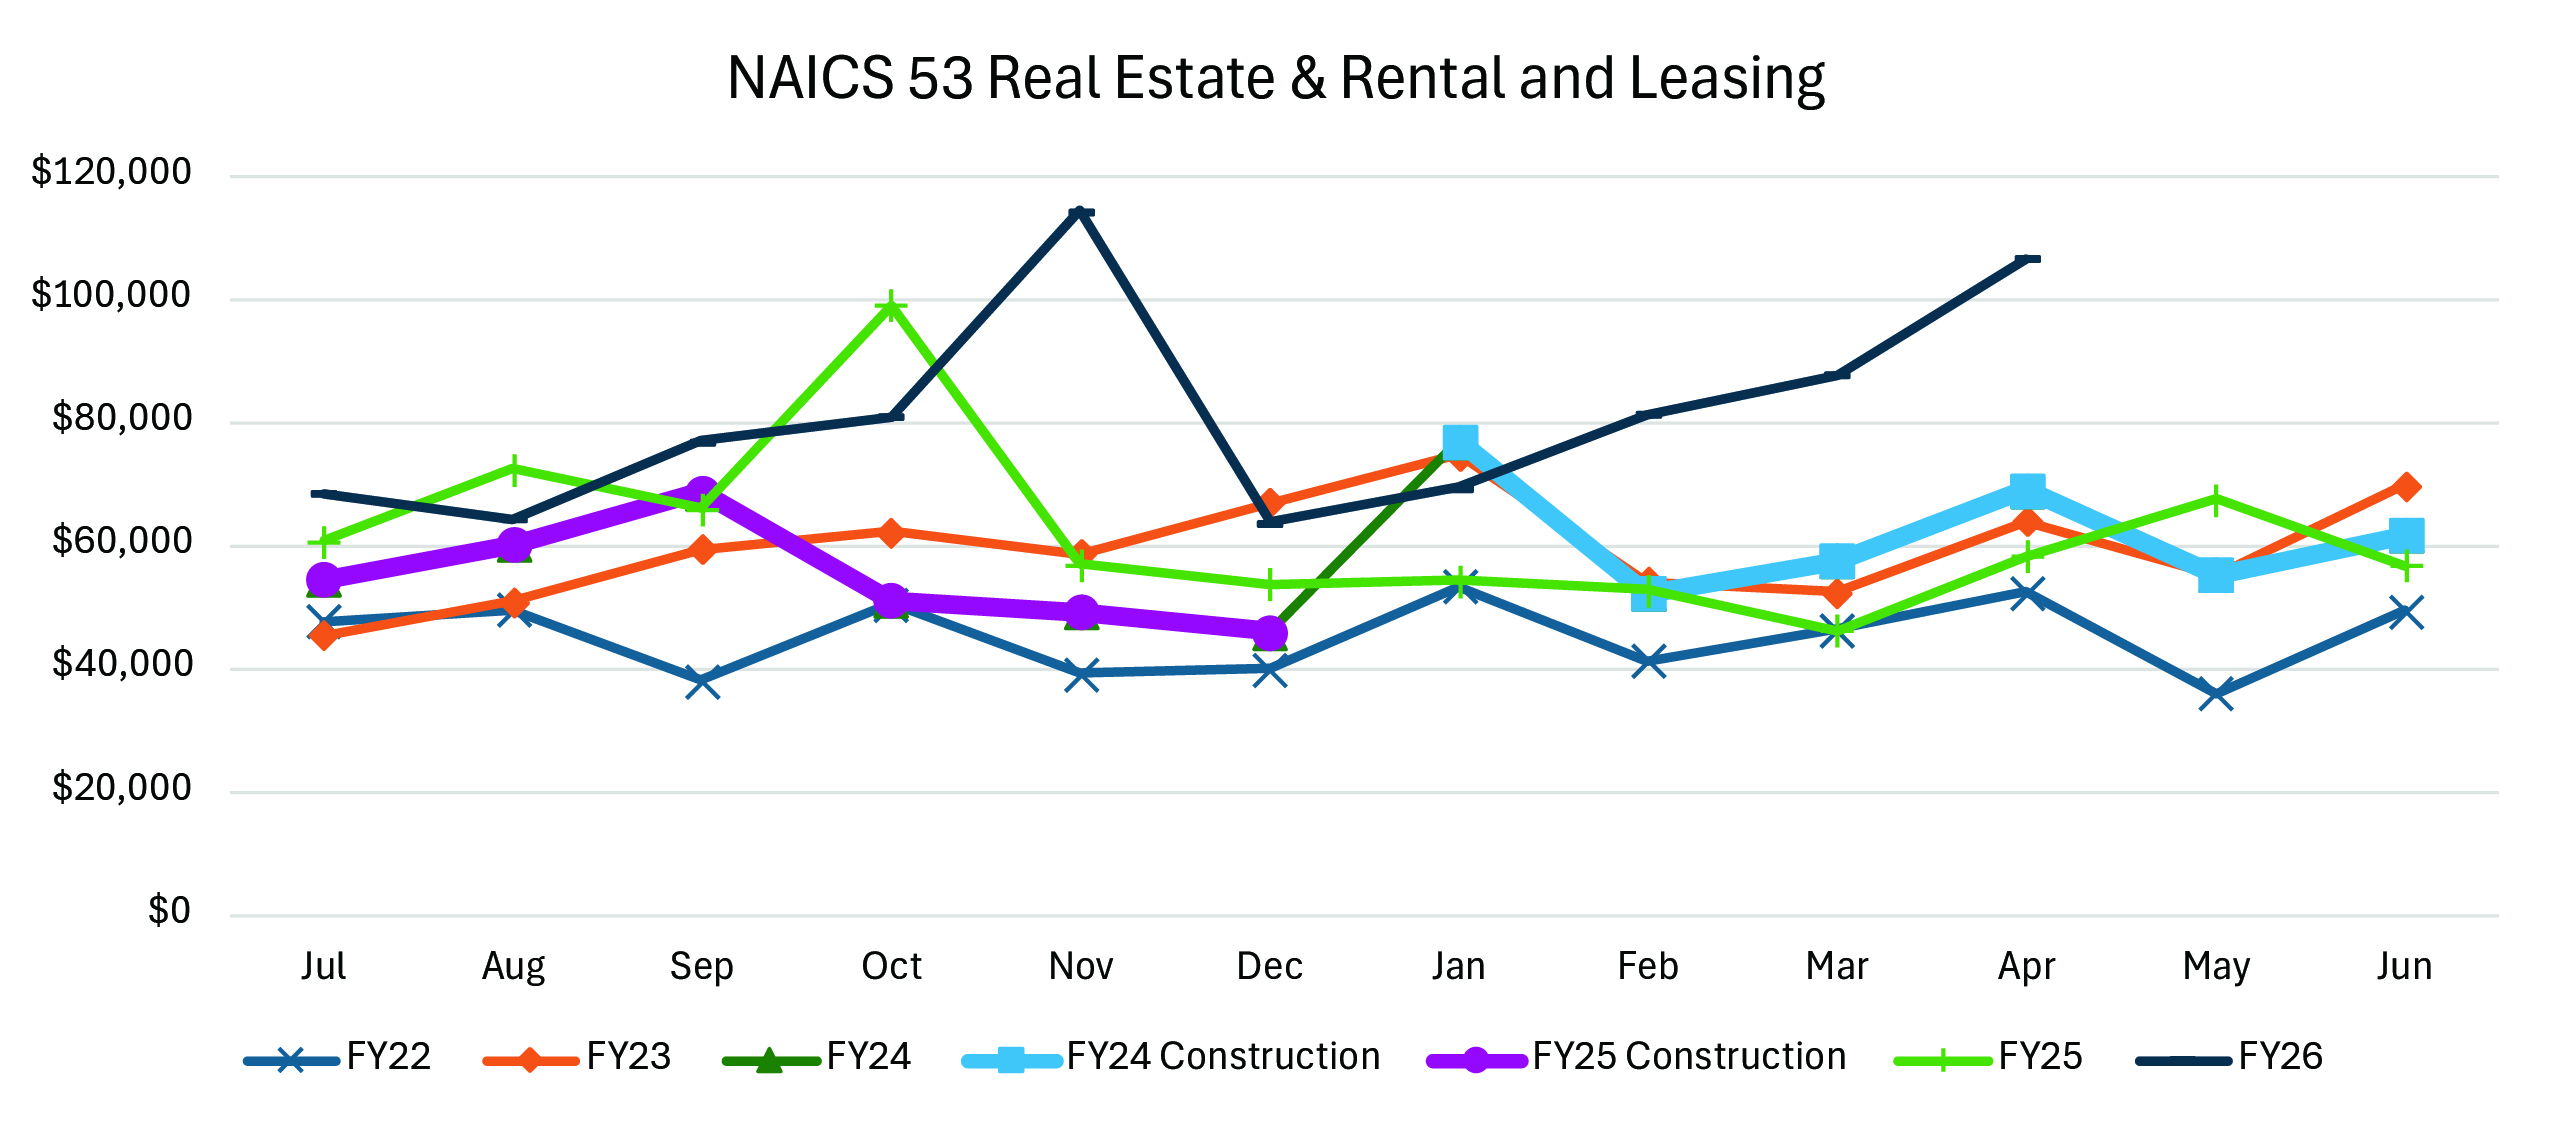 | Figure 4d. |
 | Figure 4e. |
 | Figure 4f. |
Muskogee’s total sales tax collections remain relatively stable from FY2022 through FY2026, suggesting a steady local economy without a clear upward shift tied to data center construction activity in early 2024. While FY2026 includes one notable spike in October, this appears to be driven by a one-time event outside the data center’s construction window. Across sector-level trends, most patterns align closely with historical norms rather than showing distinct changes associated with the timing of the data center project.
Manufacturing (NAICS 31-33) and wholesale trade (NAICS 42) sales tax revenue was generally lower during data center construction than during non-construction periods. Retail sales (NAICS 44–45) remain strong and predictable following holiday-driven peaks, real estate and rental and leasing (NAICS 53) and accommodation and food services (NAICS 72) shows higher sales tax revenue during the construction period than prior years but has grown more significantly in fiscal years after construction. Building materials (NAICS 444) continue to exhibit cyclical variation, with no noticeable increase during the construction period.
These patterns provide little evidence that the construction of the Muskogee data center affected local sales tax revenue. Unlike Stillwater, where certain sectors show increases consistent with construction activity, Muskogee’s sector-level trends largely fall within normal historical ranges and follow historical trends. This suggests that any construction-related spending may be occurring outside the local tax base or may not be of sufficient magnitude to shift overall collections. Thus, whether data center construction generates additional sales tax revenue for the host community appears to vary meaningfully across projects and communities.
Discussion and Conclusion
This fact sheet examined whether data center construction generates measurable changes in local sales tax revenue and which sectors of the economy are most likely to experience those effects. Using detailed NAICS level tax data from the Oklahoma Tax Commission, the analysis compared economic activity in Stillwater and Muskogee, two Oklahoma communities experiencing different types of data center development. The results suggest that construction can produce short-term increases in local sales tax revenue, but these effects are neither uniform nor guaranteed. In Stillwater, where the project is larger in scale, increases are most visible in sectors closely tied to construction activity and temporary population influxes. In contrast, Muskogee shows little evidence of measurable sales tax effects, with sector-level trends largely remaining with typical historical patterns.
Taken together, these findings indicate that the economic benefits of additional sales tax revenue from data center construction are likely to be concentrated, temporary and highly dependent on project scale and local conditions. Communities with the capacity to support construction activity, through lodging, food services and building supply stores, may be better positioned to capture short term gains in tax revenue. However, the absence of broad-based or consistent effects suggests that local leaders should be cautious about relying on construction induced sales tax revenue increases as a significant source of fiscal growth. As more development occurs and additional data become available, further analysis will help clarify the magnitude and duration of these impacts.
Importantly, there are other potential economic effects of data centers that communities should be aware of, including property tax revenue, Payments in Lieu of Taxes (PILOT) or “Community Betterment Payments” are paid directly from the builder, and employment/infrastructure/opportunity cost considerations. Boyce and Whitacre (2026) provide an overview of these topics.
References
Borenstein, S. (2026, June 3). AI and data centers leave goliath-sized environmental footprints globally. AP News. https://apnews.com/article/ai-data-centers environment-climate-footprinta792f184a9f2833b5388dbae8b41ca95
Boyce, M. & Whitacre, B. (2026). The Economics of Data Centers: Considerations for Communities. (Fact Sheet AGEC-924). Oklahoma State University Extension. https://extension.okstate.edu/fact-sheets/the-economics-of-data-centers-considerations-for-communities
City of Stillwater, Oklahoma. (2024). Stillwater data center economic development project plan (Agenda attachment). https://stillwaterok.portal.civicclerk.com/event/2035/files/attachment/2274
Cruikshank, J., & Whitacre, B. (2024, August). Does my town sell a lot of (legal) weed? Medical marijuana dispensary gap analysis across 77 Oklahoma cities (Fact Sheet AGEC-921). Oklahoma State University Extension. https://extension.okstate.edu/fact-sheets/does-my-small-town-sell-a-lot-of-legal-weed-medical-marijuana-dispensary-gap-analysis-across-77-oklahoma-cities-agec-921
Greenfield, N. (2026, March 20). AI data centers’ impact on electric bills, water, and more. Consumer Reports. https://www.consumerreports.org/data-centers/ai-data-centers-impact-on-electric-bills-water-and-more-a1040338678/
Maher, K. (2026, March 13). The teachers getting $50,000 bonuses thanks to a massive Meta data center. The Wall Street Journal. https://www.wsj.com/us-news/education/the-teachers-getting-50-000-bonuses-thanks-to-a-massive-meta-data-center-b4631d05
Oklahoma Tax Commission. (n.d.). State tax by NAICS (OkTAP report). Oklahoma Taxpayer Access Point. https://oktap.tax.ok.gov/OkTAP/Web/_/#2
Port Muskogee. (2024, February 13). Polaris Technologies, Inc. invests $100M to establish Muskogee’s first data center facility.
https://www.portmuskogee.com/polaris-technologies-inc-invests-to-establish-first-data-center/
Ramos, L. (2025, August 14). Google announces a new $9 billion cloud and AI investment in Oklahoma. KOSU. https://www.kosu.org/local-news/2025-08-14/google-announces-a-new-9-billion-cloud-and-ai-investment-in-oklahoma
Whitacre, B., & McPeak, M. (2025, June). Pull factors: A measure of retail sales success estimates for 77 Oklahoma cities (2024 edition) (Fact Sheet AGEC-1079). Oklahoma State University Extension. https://extension.okstate.edu/fact-sheets/pull-factors-a-measure-of-retail-sales-success-estimates-for-77-oklahoma-cities