Creating Process Flow Diagrams for Food and Ag
Introduction
A Process Flow Diagram (PFD) is a type of flowchart that illustrates the separate steps of a process in sequence. The purpose of this fact sheet is to describe basic PFDs and how to make and apply them in the food and agriculture (F&A) industries. While this fact sheet is written specifically for PFDs used for F&A processes, it may be used in other applications. The intended audience includes manufacturers, developers of processes and products, quality and safety specialists, regulators, administrators, food scientists, engineers and practitioners.
The goal of this fact sheet is to improve and encourage the use of process flow diagramming as a tool for the F&A industries. The scope is fourfold: (1) introduce PFDs, (2) explain how to create them, (3) describe uses of PFDs and (4) how to include supplemental information.
Purpose of PFDs
PFDs serve multiple purposes:
- Describe a process
- Promote clear thinking, planning and examination
- Aid communication
- Provide documentation of process details, such as safety and quality
- Guide activities, such as troubleshooting, optimization, maintenance and cleanup
- Track materials, utilities, cost and labor
- Serve as a basis for other diagrams, such as Piping and Instrumentation Diagrams (P&ID) and General Arrangement (GA)
Getting Started
Process flow diagramming begins with a systems approach and a purpose. A systems approach recognizes that a process exists as a part of a larger system and interacts with outside factors. Interactions should be identified and evaluated before diagramming begins. Figure 1 shows outside factors interacting with a process. Most processes in the F&A industries will link with outside factors, including materials (e.g. ingredients and packaging), personnel and utilities (e.g. steam, electric, water, natural gas, ammonia, chilled water and compressed air).
Figure 1. Outside factors interacting with a process.
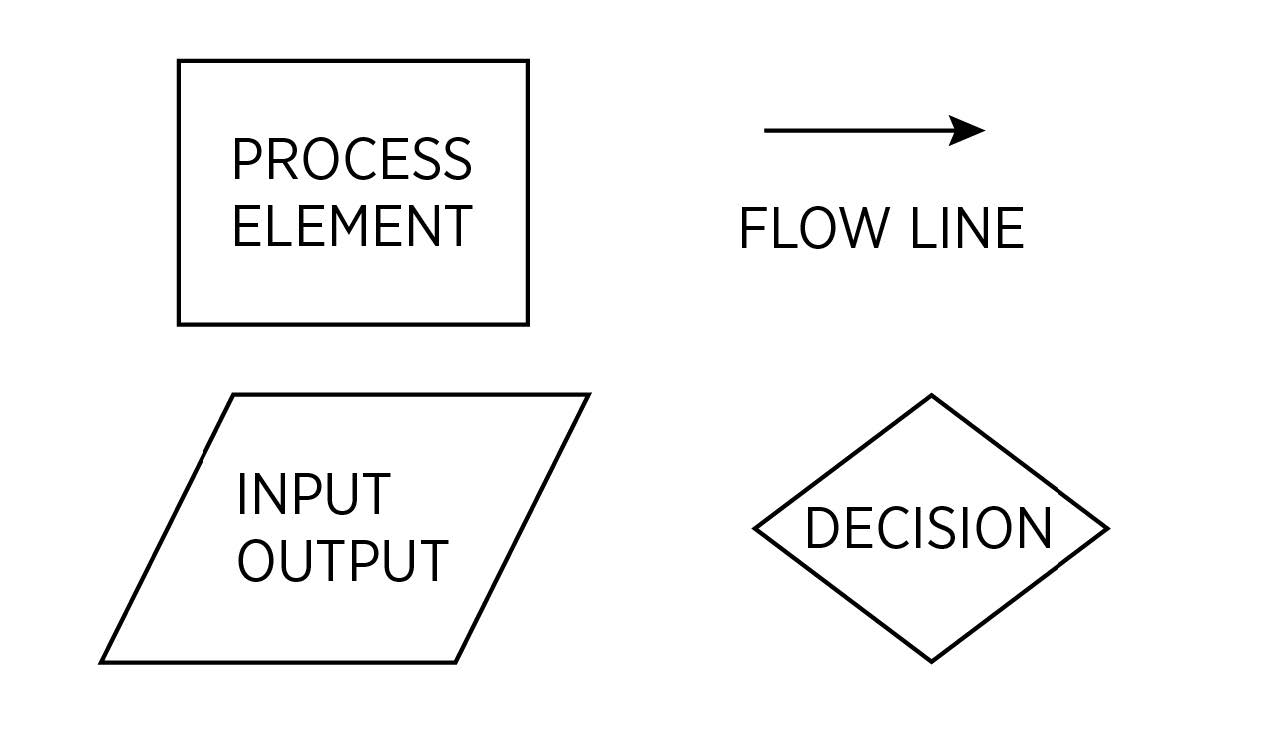
Simplicity is crucial in the development of PFDs. Drafters of PFDs will be more productive and readers will gain a better understanding when diagrams are simple. PFD layout should be intuitive. For instance, the direction of flow should follow conventional paths (like left to right and clockwise). Consistent notation from drawing-to-drawing will reduce confusion. Four symbols, shown in Figure 2, are adequate for drafting most PFDs. The four symbols are the process element (rectangle), flow line (arrow), decision (diamond) and input/output (parallelogram).
Figure 2. Four symbols are adequate for drafting most PFDs.
The process element (rectangle) may represent specific equipment identified in the narrative, unit operations, or a statement of the process to be accomplished. Unit operations are physical or chemical changes in the process, such as receiving, storing, size reduction, separation, peeling, cooking, heating, holding, cooling, packaging, shipping, cleaning and sanitizing.
The flow line (arrow) connects symbols in a PFD and indicates a direction of movement. When a flow line follows a decision symbol, it will be labeled “yes,” or “no” based on the decision logic. The decision symbol (diamond shape) represents that a yes or no decision must be made in the process. The decision diamond has one input and two output arrows. One output arrow is labeled “yes” and the second output arrow is labeled “no.” Finally, the input/output symbol (parallelogram) portrays the introduction or removal of materials, products, waste or other items on the PFD. It can also represent a location of origination or a destination.
How to Draw a PFD
The first step in drawing a useful PFD is to identify the process. Once the process is identified, there are different methods that can be followed. The method selected depends on factors like the author’s experience and preferences, company standards, available examples and software. This document describes two methods, one aimed at drawing a PFD for a new process and another for drawing a PFD of an existing process.
Drawing a PFD of a New Process
To draw a PFD for a new process, the author writes a narrative or a few sentences to describe the process. The description might include the location of the process, starting and stopping points, inputs, outputs, purpose, goals, quality and safety attributes, process customer and audience of the PFD. An example of a process narrative for applesauce manufacturing is given in Figure 3.
"Handpicked apples are collected in totes that are hauled from the field to the processing facility. Totes of apples are dumped into a washing and inspection system. Cleaned, inspected apples are sent to a machine that removes the calyx. De-calyxed apples are cooked to soften the flesh. Cooked apples are passed through a pulper-finisher to remove seeds, cores and skins. Apple pulp is pumped to a mixer where ingredients are added to make applesauce. Applesauce is pumped through a heat exchanger to reach a target temperature. After heating, the applesauce is directed through a pipeline to establish the hold time required for pasteurization. Pasteurized applesauce is directed to a filler/capper. Filled jars are cooled in a tunnel conveyor. Cooled jars are dried, inspected and labeled. Labeled jars are cased and palletized, then sent to a finished-goods warehouse."
Figure 3. Process narrative for applesauce manufacturing.
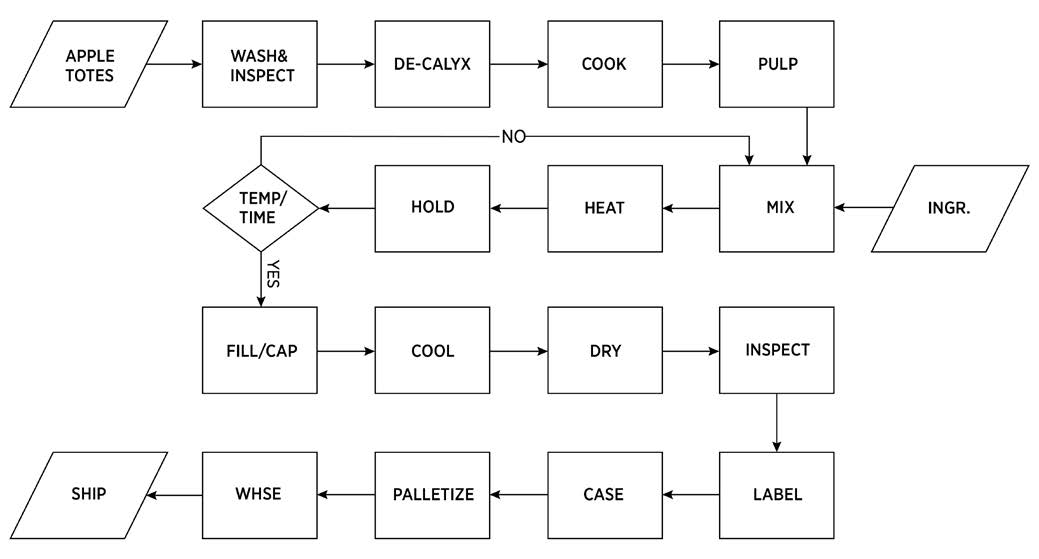
After the process narrative is written, the PFD is started. Most PFDs begin with one or more input symbols and finish with at least one output symbol. Process elements, flow arrows and decision symbols are used to describe the process flow between the input and output symbols. Figure 4 is a PFD developed from the applesauce process narrative provided in Figure 3.
Figure 4. PFD of applesauce production.
The applesauce PFD in Figure 4 includes inputs (apple totes and ingredients) and an output (finished pallets of applesauce shipped from the warehouse). A decision symbol (diamond shape) is also included in Figure 4. The decision step is shown to highlight an important aspect of product safety. The applesauce manufacturing process includes a pasteurization step, with defined time and temperature goals, to inactivate disease-causing and spoilage microorganisms. If the conditions of pasteurization are not met (time and temperature), a decision is made to send the applesauce back to the mixer for reprocessing. If the pasteurization conditions are met, the applesauce goes on to the next step of filling and capping. Filling and capping are shown as a single process element because they occur in one machine.
The De-Calyx machine and Filler/Capper process elements are examples of specific equipment identified in Figure 4. Most of the elements shown in Figure 4 are unit operations: wash, inspect, cook, pulp, mix, heat, hold, cool, dry, label, case and palletize. The element “WHSE,” an abbreviation for warehouse, indicates a location for product storage.
Drawing a PFD of an Existing Process
Drawing a PFD for an existing process first requires an understanding of the process. Start by researching the process to learn as much as possible about its purpose, goals, inputs, outputs and the environment. Observe the process in action, covering the full range of products produced. Become familiar with the equipment and its functions. Identify decisions that are made during the process that impact subsequent steps. Look for special circumstances or triggers that activate a different process sequence. Review quality assurance, product and human safety steps and guards. A recorded video of the process, played back in slow motion, may be helpful for observing fast-moving lines. Meet with experienced operators, maintenance and cleanup personnel to learn their perspectives on the process. After the learning step is complete, a process narrative can be written. Follow the same procedure outlined above for drawing a PFD of a new process based on the narrative.
More About Process Elements
The ability to edit and quickly move process elements in a PFD facilitates creativity and continuous improvement. Process elements can show more detail as the process evolves and improves. Figure 5 shows how a process element may evolve during process development.
(a) Initial process element shows a basic reactor vessel for an enzymatic reaction.
(b) Improved process with vessel using an immobilized enzyme to reduce waste.

Figure 5. Evolution of a process element (a) first iteration, (b) second version and (c) final version (input and output symbols are not fully shown for brevity).
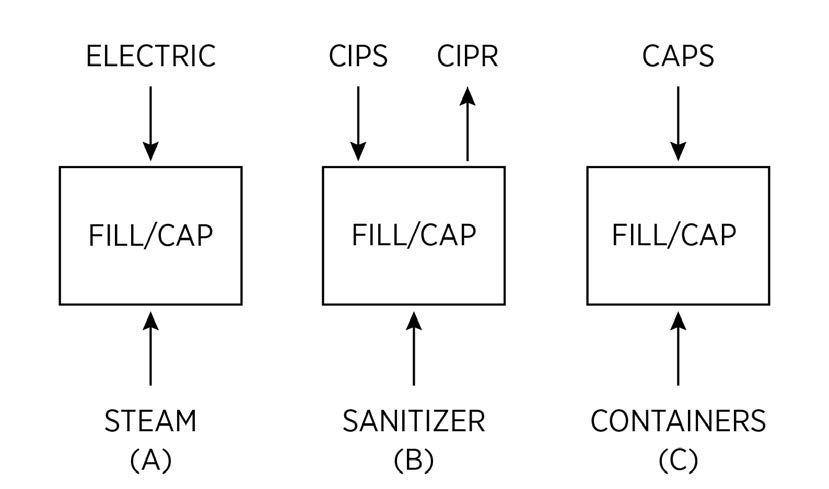
A process element in a given PFD may show different inputs and outputs compared to the same element that appears in another related PFD. The appearance of an element may depend on the purpose of the PFD and the information the author wishes to convey. One PFD may be focused on manufacturing, another on cleaning and sanitation and a third on utilities. Figure 6 shows examples of the same process element that conveys different information, depending on the purpose of the PFD.
Figure 6. Examples of the same process element that occurs in more than one PFD with differences. From left to right, (A) shows connected utilities, (B) indicates cleaning and sanitizing connections, and (C) shows packaging materials.
Documenting Safety & Quality on PFDs
Safety and quality information may be documented on PFDs. Safety and quality information can take different forms, such as product, environmental and worker safety. Examples relating to product safety are temperature, pathogens, foreign materials and package integrity. Environmental issues include items like process waste, fumes and hazardous materials (e.g. combustibles). Examples of operator hazards are open tanks that require entry for cleanup or servicing, pinch points, moving parts, high temperature surfaces and equipment holding stored energy (e.g. springs and air cylinders). Figure 7 is an example of a portion of the applesauce PFD developed to document human safety issues.
Figure 7. Example of human safety factors documented on three PFD elements from the applesauce manufacturing process.
Utility PFDs
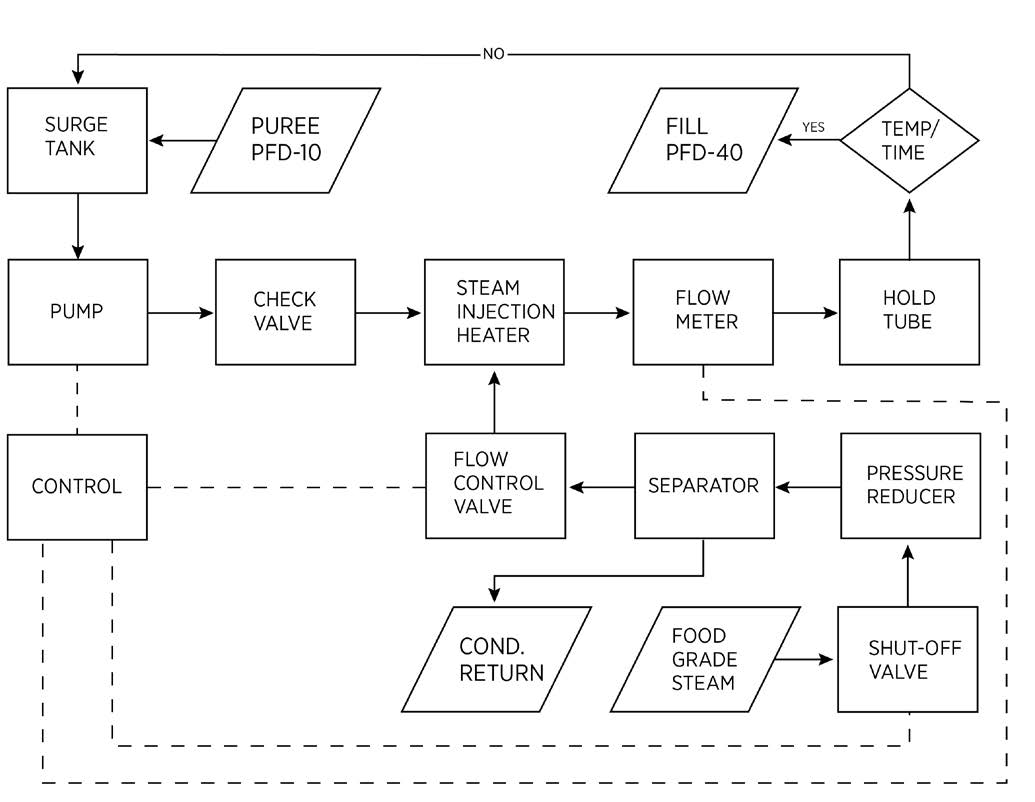
Most F&A processes and facilities rely heavily on installed utilities. Utility services may be diagrammed for several reasons, including design and documentation of controls and safety plans. Steam, natural gas, electricity, compressed air, potable water, hot water, chilled water, glycol, ammonia and sewage are examples of plant utilities. Figure 8 shows a utility PFD for a direct-injection steam heating process. The example utility PFD includes flow controls, steam quality controls and safety features to protect the operator and equipment.
Figure 8. Utility PFD showing steam control and safety features in a direct-injection steam heating process. Dashed lines indicate process control signal.
Master PFD
Paper size can be a make-or-break issue, especially for lengthy PFDs. PFDs printed on normal-sized paper are user-friendly, since they are easy to print and copy. However, a detailed PFD should not be squeezed onto a single sheet of paper. Instead, it should be broken down into multiple pages to make it easier to use. A user-friendly PFD is accessible to a wide audience for use, review, updating and improving. Oversized drawings can be difficult to follow and require expensive printers and paper. Multiple-page PFDs are facilitated by creation of a Master PFD.
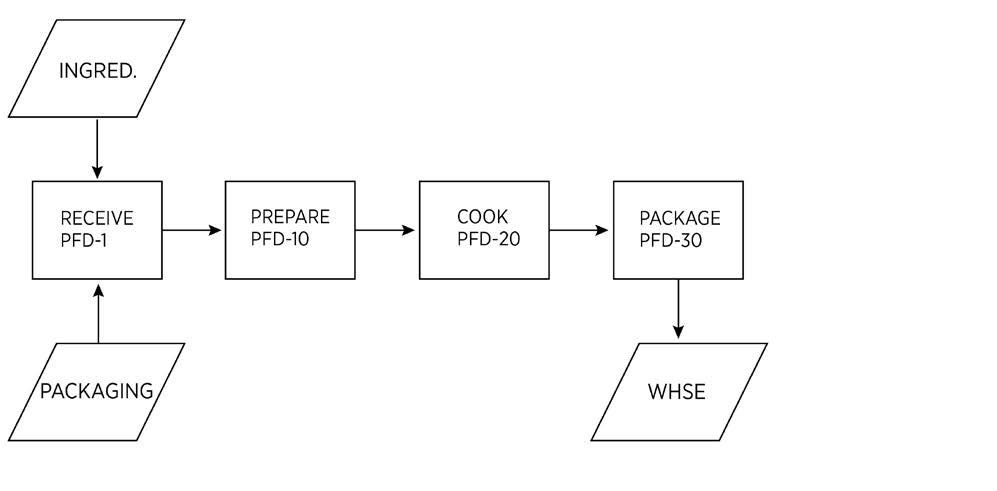
A Master PFD furnishes a means to organize PFDs into multiple pages and serves as an overview of the process. The master PFD is like a table of contents for a document. Process elements identified in a Master PFD may correspond to a group of process steps or specific activity areas in a facility. An example of a Master PFD for an applesauce canning operation is shown in Figure 9. It is organized according to groups of process steps.
Figure 9. Example of a master process flow diagram that provides a means to organize a PFD into multiple pages.
The fist process element, “Receive,” in the Master PFD shown on the left side of Figure 9 refers to a group of operations related to the receiving of goods (packaging and ingredients are listed as inputs). More information on “RECEIVE” would be found on the diagram at the location noted in the process element, “PFD-1.” The location could refer to a single PFD (as in the example case) or multiple PFD’s. It could also refer to another “sub-master” PFD.
A group of optional, stand-alone utility PFDs are shown on the lower right of figure 9. Each of these utility PFDs describes a specific service that is important to the process. Information included on a utility PFD relates to the process or facility (e.g. capacities, distribution and controls). Safety and environmental information can also be include in utility PFDs.
Streams & Components Spreadsheet
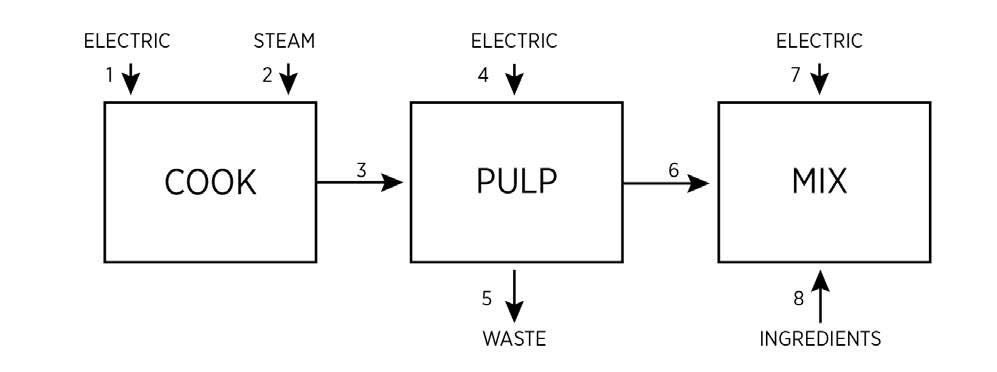
A streams and components spreadsheet may accompany a PFD to provide additional details. An example of a streams and components spreadsheet is provided in Figure 10. Streams shown in Figure 10 correspond to those labeled on three elements of a PFD shown in Figure 11. Streams identify flows or connections on a PFD. They can be used to quantify important details, such as utilities, ingredients, critical control points (CCPs), labor, and environmental conditions. Streams are numbered in a convenient manner and correspond to bubbles on the referenced PFD. Components are used to describe the streams in terms of measurable units and may be customized to suit the purpose of a PFD.
| Steam No. | 1 | 2 | 3 | 4 | 5 | 6 | 7 | 8 | 9 | |
|---|---|---|---|---|---|---|---|---|---|---|
| Components | Description | Electric | Steam | Cooked Apple | Electric | Waste | Pulped Apple | Elextric | Sugar | Spice Mix |
| Operating Flow | gpm | |||||||||
| Operating Flow | lb/hr | 76 | 1,076 | 120 | 956 | 81.3 | 16.73 | |||
| Design Flow | gpm | |||||||||
| Design Flow | lb/hr | |||||||||
| Labor Hours | per shift. | 0.3 | 1.0 | |||||||
| Labor Hours | per lb. | |||||||||
| Temperature | F | 165 | ||||||||
| Pressure | psig | 90 | ||||||||
| Volts/Phase | 40/3 | 240/3 | 480/3 | |||||||
| Electric | kW | 3.7 | 5.6 | 3.7 | ||||||
| Remarks |
Figure 10. Example Streams and Components spreadsheet.
Figure 11. Example portion of a PFD that illustrates use of a Streams and Components spreadsheet (Figure 10).
Hand Drawn or Software?
Should a PFD be drawn by hand or using a software package? There is no set answer to this question. In either case, the method selected to draw a PFD should not be an obstacle to getting the job done. If a computer is not available or there is a personal struggle with the use of software, draw the PFD by hand. Hand drawings are universally accepted and can be made on graph paper using a ruler or an inexpensive drawing stencil. Drawing stencils for flow charts are sold commercially. If graph paper is not on hand, it can be quickly made using ruled tablet paper, a pencil and ruler.
Is there a particular software package that works best? Personal taste, budget and company standards should be considered. A number of high quality, free or inexpensive software options are available. An internet search will reveal several possibilities. Zen Flowchart (free account available at Zenflowchart.com) and Lucid Chart (free account available at Lucidchart.com) are examples. The user should experiment with software packages and ask colleagues for recommendations.
PFD Verification
All PFDs should be verified or checked for accuracy prior to release as a final document and periodically during the life of the process. It is important that verification steps be performed by someone other than the author. A fresh and unbiased viewpoint is needed to examine the diagram for errors and omissions. The reviewer should have knowledge of the process and experience drafting or reviewing PFDs. If the PFD is a new or updated diagram of an existing process, the reviewer should “walk the process” to verify the details of the PFD. Walking the process involves physically observing it in action, and offline, to verify process steps, formatting, special circumstances, inputs, outputs, environmental considerations and other factors.
Updating PFDs
PFD’s that represent active production lines should be updated on a regular basis. A PFD update is essentially the same as the verification process described above. Active production lines are often modified, adjusted, repaired, updated or moved. New and more advanced equipment and controls may be added or installed in place of outdated or worn versions. Prolonged line shutdown for any reason, especially plant rehabilitation, should be a signal to update PFDs. Any of these activities could require changes in the associated PFD.
Common Mistakes in PFDs
Over the years, we have observed many mistakes on PFDs and have assembled them into a list. Use the list below to check your own PFDs and the PFDs you review. Do not be ashamed if you catch yourself making one or more of the mistakes listed. You are in good company! Making PFDs is not an exact procedure as there are often many ways to describe or represent the same process. Try not to be overcritical when reviewing a PFD. As long as the basic purpose and goals are met, the drawing is likely sufficient. Keep the audience in mind when reviewing a PFD.
Common mistakes found in PFDs:
- Does not include title, date, version, author, page numbers or description
- Uses unrecognized or overly complex symbols
- Difficult to follow, overflows onto more than one page
- Is not neat and organized
- Original includes use of colors that do not transfer to black and white renditions
- Contains spelling errors and unknown abbreviations
- Is difficult to read; print too small
- Paper size is too large, cannot be copied on ordinary office machine
- Includes extra information not required for proce
- Has not been reviewed.
Conclusion
PFDs are an essential tool used to communicate process steps, decisions and information. They are a requirement for building and maintaining a recognized and effective food safety plan. PFDs serve as an information source for diverse process users, developers, stakeholders, investors and regulators. A carefully crafted PFD will save time and money for all users and result in tremendous benefits to customers. Make it a goal to improve PFD development and use in your organization. Contact fapc@okstate.edu for assistance or additional information.
PFD Checklist
The following is a checklist of important attributes of any PFD:
- Does it contain proper identification: Title, date, version, author, page numbers?
- Is it constructed using basic symbols that are recognizable and consistent?
- Does it have an intuitive layout?
- Does it fit onto normal-sized paper(Can it be printed using common printers)?
- Does it have a defined start and finish process?
- Is it accompanied by a streams and components table as needed?
- Has it been reviewed and checked by others?


