The Best Time of Year to Conduct Prescribed Burns
When is the best time of year to burn? This is one of the main questions many land owners and managers often ask about prescribed burning. Timing of prescribed burns will vary depending upon specific land management goals and objectives. Timing should also depend upon when the burn can be accomplished safely and under favorable weather conditions. When planning prescribed burns, it is important for fire managers to know and understand the number of days during a specific season or over the entire year that are actually available to conduct prescribed burns. Knowing this allows managers to plan for and execute a finite number of burns during a given year. It is also can aid in determining in which season(s) it may be best to perform them.
Many land managers have numerous prescribed burns to conduct during a specific burn season, and if there are not an adequate number of days available, some burns will not be conducted that year. Burns not conducted are usually postponed until the next year, adding more burns and needed burn days to an already limited schedule the following year. It also changes management plans for interests on that particular burn unit. More often than not, many burn units are not burned regularly or at all because of a finite number of burn days during a restricted or traditional burn season. This can negatively impact resources in numerous ways, along with creating an increased work load and cost on fire managers trying to implement prescribed burns.
Many times, because of the limited number of burn days, a fire manger may try to burn when conditions are marginal. The result is that the fire is not as effective, and management goals are not met. On the other hand, safety may be compromised when prescribed burns are performed under marginal conditions because of the desire to complete all of the planned burns in the traditional season. If fires were conducted year-round, then more days would be available for burning, and the most optimum days for achieving goals and safety could be used.
Weather has a large impact on prescribed burning and fire behavior. The number of days available to burn each year is therefore constrained largely by weather variables, specifically temperature, wind speed, and relative humidity.1,2,3,4,5 Achieving the proper set of weather conditions to conduct a burn during a particular time of the year has always been a dilemma faced by fire managers. If the goals and objectives of the prescribed burn are not extremely specific and safety concerns are maintained, then a wide range of variables for temperature, relative humidity, and wind speed can be used to determine when to conduct the fire. More often than not, however, a narrow window of weather parameters is required due to safety issues, policy, and regulation, reducing the number of available burn days. (see Extension Fact Sheet NREM-2878 “Fire Prescriptions for Maintenance and Restoration of Native Plant Communities” for more information)
Even if the weather conditions are met, the timing of the prescribed burn is often limited to a single season by policy, tradition, or a lack of understanding of fire effects, which further limits the number of available days to conduct burns. We should remember that historically, and even today, fires occur throughout North America at any time of the year. Historical fire accounts show that lightning-set fires in many regions of the United States occurred during the growing season, and fires set by Native Americans occurred in nearly all months, with a majority in the late summer.6,7,8,9,10
So not only are prescribed burn managers faced with a limited number of burn days per year because of inadequate weather conditions,11 but they are also limited to burning during one season of the year. In many areas, this time frame is late winter to early spring, which also coincides with highly variable and changing weather conditions. During this time, conditions are favorable for wildfires and the execution of county and state burn bans, which can further limit the number of burn days.12 Because a lack of a clear understanding of seasonal opportunities for burning might limit the application of prescribed burning, this publication examines weather conditions to understand the time of year in which opportunities are best for conducting burns.
Determining Burn Days
Information for this publication is based on research conducted using the Oklahoma Mesonet hourly weather data recorded at the Marena site west of Stillwater from January 1, 1994 to December 31, 2007.13 The weather data set was restricted to a 10-hour observation window between 8:00 a.m. and 6:00 p.m., which coincides with the time frame in which most prescribed burns are conducted. A burn day was declared when the following conditions were met:
- temperature between 35 F and 110 F,
- relative humidity between 25 percent and 80 percent,
- wind velocity between 4 mph and 15 mph, and
- no precipitation recorded during the time period.
If these conditions existed for a three-hour continuous block (i.e., the burn window) at least once within the observation window of a day, the day was considered a “burn day.” The predominant wind direction for each burn day was determined by averaging the wind direction in degrees. Wind direction was determined from compass headings of north 337.5 to 22.4°, northeast 22.5 to 67.4°, east 67.5 to 112.4°, southeast 112.5 to 157.4°, south 157.5 to 202.4°, southwest 202.5 to 247.4°, west 247.5 to 292.4°, and northwest 292.5 to 337.4°. The total number of hours available per burn day was averaged for each month.
Results
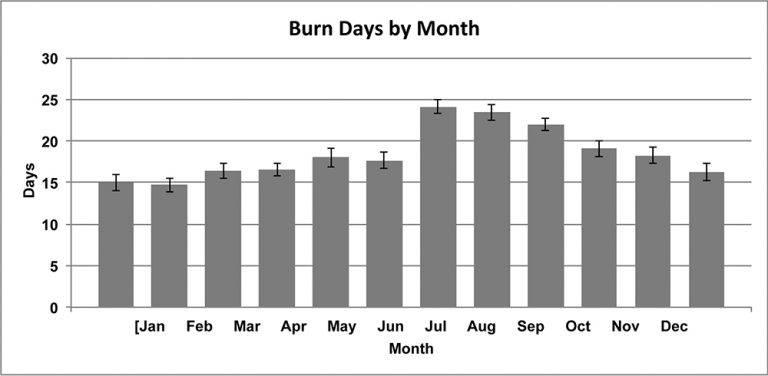
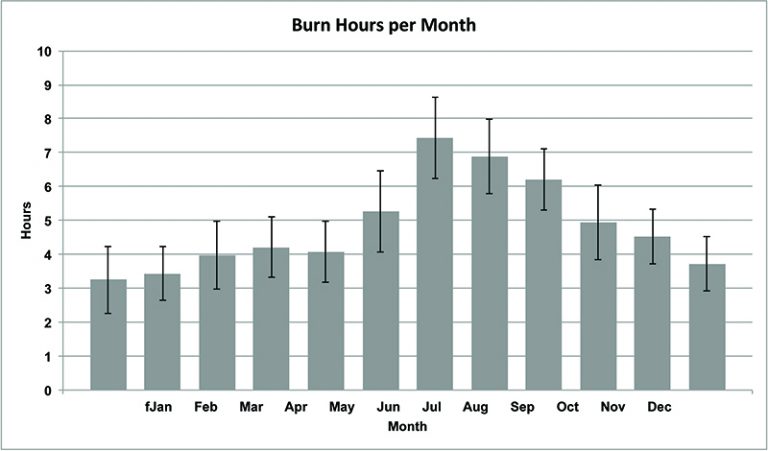
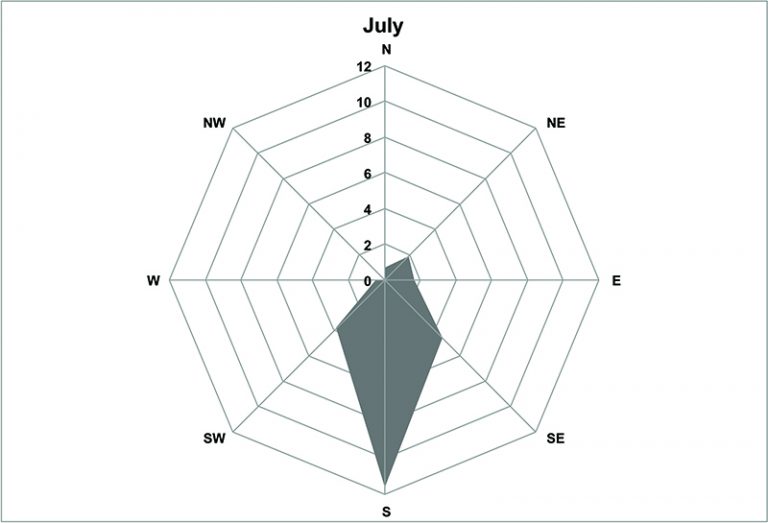
During the 14 years of weather data, there was an average of 222 days per year (range 206 to 338 days) and 18.5 days per month (range 8 to 30 days) available for conducting prescribed fires. Burn days were fewest in February and greatest in July (Figure 1). There was an average window of 4.8 hours per 10-hour burn day (range 1.4 to 9.7 hours) for the entire year in which the weather was consistent enough to conduct a burn. The month of July averaged the most hours per 10-burn day, while January had the least (Figure 2). Wind direction for the 10-hour burn day during the entire study period proved predominantly from the south (157.5 to 202.4°), with a west wind (247.5 to 292.4°) being the least common (Figure 3). A south wind again dominated by month, averaging 6.1 days per month (range 2.6 to 11.6 days), while west was also the least favorable direction by month at 1.0 days per month (range 0 to 3.1 days).
Available burn days in January, February, and March were similar to available burn days reported by a previous study examining late winter-early spring burn season.11 This time period of dormant season burning in late winter-early spring is commonly reported to be the traditional burn season of Oklahoma and the Great Plains.14,15,16 The Mesonet data examined show that this time of year is one of the worst periods to conduct prescribed burns. The months of February, March, and April had some of the fewest available burn days (Figure 1) and the least number of hours per day suitable for burning (Figure 2). Restricting prescribed burning to a narrow window of available days or not burning on most available burn days throughout the year hampers most fire managers’ ability to meet burn objectives. This information shows that burning should be considered an option throughout the year or during nontraditional times to allow for more favorable weather conditions, giving fire managers more hours to conduct burns, and a greater number of burn days.
Figure 1. Average number of days available to conduct prescribed burns by month. Traditional burn season in Oklahoma is from February to April. This shows that these months have some of the fewest available burn days for land managers to accomplish their burns.
Figure 2. Average number of hours per day by month that prescribed burns could be conducted. Again the traditional burn season of February to April has some of the fewest hours per day available to conduct prescribed burns.
Figure 3. Total number of burn days by the eight cardinal wind directions, illustrating that some specific wind directions are more readably available than others. Also if a specific wind direction is required for a burn it reduces the number of burn days.
Wind direction is another component of a burn prescription that will reduce the number of available burn days. Some burn units require a specific wind direction for smoke management or safety reasons. Consequently, the number of burn days can be reduced by half or more.11 Consider a burn unit that requires a west wind during the traditional burn season of February, March, and April. From the Mesonet data, there are on average only three days available during that 89-day season. If the entire year was open for conducting burns, then the number of days would go up to an average of 13 per year. This increase in the number of days with the prescribed wind direction gives the fire manager more opportunities to choose specific days and weather conditions to burn specific units, making the prescribed fire program more effective (Figure 4).
Figure 4. Average number of burn days by wind direction for March and July, demonstrating how different seasons of the year allow for more burn days and more opportunities for specific wind directions than other seasons.
Safety is always a major concern when conducting prescribed burns. If it is safer to burn during one season than another, would it not be beneficial to the fire manager to utilize this time? With environmental conditions favorable for burning during the growing season, high moisture content in green plant tissues impedes fire intensity and produces relatively slow-moving head-fires,17 making burning during the growing season safer. Fire behavior is less intense, the rate of spread is slower, and the risk of escape from spotfires is greatly reduced. All of these factors can benefit fire managers with large fuel loads in or adjacent to their burn units or with units that have volatile fuels. Burning under these conditions in the growing season can still allow land managers to meet the goals and objectives of controlling Eastern redcedar (Juniperus virginiana) and changing the structure of other resprouting brush species.
Wildfire concerns can also impede the execution of prescribed burns. Wildfire season often coincides with the traditional prescribed burn season and in turn drastically reduces the number of available burn days. For instance, in Oklahoma it has been found that March is the month with greatest number of wildfires during the year, which can result in the implementation of county and statewide burn bans.12 For example in March 2009, during the traditional peak of prescribed burning season in Oklahoma, 44 of the 77 counties were under a burn ban, but there were no burn bans from May to December of that same year.
One other issue that burning during different seasons of the year can provide is possible solutions to smoke management concerns. Smoke management is one of the leading issues facing fire mangers today across the nation. In some areas of the country the total smoke load from prescribed fire season is causing concern in large metropolitan areas with air quality compliance regulations. If the burn season can be spread out to multiple seasons of the year, this will reduce the total smoke load in the atmosphere at any one time and cause fewer air quality problems. It has also been shown that burning in one season of the year compared to another can reduce smoke emissions by 50 percent.18
Summary
Fire managers should consider the benefits of burning during all seasons when determining burn days and season of burn, unless specific goals and objectives cannot be achieved. Opening up the burn season gives burn personnel more days with acceptable weather conditions and more hours within those days to conduct the burn. The increased safety of burning during the growing season, with its decrease in flame length and rate of spread while still being just as effective in accomplishing management objectives, is another positive benefit of burning outside the traditional burn season. Having more periods of consistent stable weather with few county or state burn bans is another added advantage. More burn days give fire managers the benefit of choosing the appropriate weather conditions and timing of burn so prescribed fires are more effective and less likely to escape. Although this information is from a single weather station, it should cause fire managers to consider how many days each year are available to conduct prescribed fires, along with specific weather patterns and seasons in their area most favorable for burning.
References
- Davis, K. P. 1959. Forest fire: control and use. New York, NY, USA: McGraw-Hill.
- Lindenmuth, A. W., and J. R. Davis. 1973. Predicting fire spread in Arizona oak chaparral. Fort Collins, CO, USA: Rocky Mountain Forestry and Range Experimental Station. USDA Forest Service Research Paper RM-101.
- Bunting, S. C., and H. A. Wright. 1974. Ignition capabilities of nonflaming firebrands. Journal of Forestry 72:646–649.
- Green, L. R. 1977. Fuel breaks and other fuel modification for wildland fire control. Washington, DC, USA: Department of Agriculture. USDA Handbook No. 499.
- Weir, J. R. 2009. Conducting prescribed fires: a comprehensive manual. College Station, TX, USA: Texas A&M University Press. 194 p.
- Higgins, K. F. 1986. Interpretation and compendium of historical fire accounts in the northern Great Plains. Washington, DC, USA: US Fish and Wildlife Service. US Fish and Wildlife Service Research Report No. 161. 39 p.
- Boyd, R. [ed.]. 1999. Indians, fire and the land in the Pacific Northwest. Corvallis, OR, USA: Oregon State University Press. 313 p.
- Stewart, O. C. 2002. Forgotten fires: Native Americans and the transient wilderness. Edited and with introductions by H. T. Lewis and M. K. Anderson. Norman, OK, USA: University of Oklahoma Press. 364 p.
- Vale, T. R. [ed.]. 2002. Fire, native peoples, and the natural landscape. Washington, DC, USA: Island Press. 315 p.
- Anderson, M. K. 2005. Tending the wild: Native American knowledge and the management of California’s natural resources. Berkeley, CA, USA: University of California Press. 526 p.
- Roberts, K. W., D. M. Engle, and J. R. Weir. 1999. Weather constraints to scheduling prescribed burns. Rangelands 21:6–7.
- Reid, A. M., S. D. Fuhlendorf, and J. R. Weir. 2010. Weather variables affecting Oklahoma wildfires. Rangeland Ecology and Management 63:599–603.
- Weir, J.R. 2011. Are weather and tradition reducing our ability to conduct prescribed burns? Rangelands 33:xx-xx.
- Launchbaugh, J. L., and C. L. Owensby. 1978. Kansas rangelands: their management based on a half century of research. Manhattan, KS, USA. Kansas Agriculture Experiment Station Bulletin No. 622.
- Ohlenbusch, P. D., and D. C. Hartnett. 2000. Prescribed burning as a management practice. Manhattan, KS, USA. Kansas State University Agriculture Experiment Station and Cooperative Extension Service Publication No. L-815.
- Stubbendieck, J., J. Volesky, and J. Ortmann. 1998, revised 2007. Grassland management with prescribed fire. Lincoln, NE, USA. University of Nebraska-Lincoln Extension Publication No. EC148.
- Towne, E. G., and K. E. Kemp. 2006. Long-term response patterns of tallgrass prairie to frequent summer burning. Rangeland Ecology and Management 61:509–520.
- Sandburg, D. V., and F. N. Dost. 1990. Effects of prescribed fire on air quality and human health. In: J. D. Walstad, S. R. Radosevich, and D. V. Sandburg [eds.]. Natural and prescribed fire in Pacific Northwest forestsn Corvallis, OR, USA: Oregon State University Press. p. 191–218.
John R. Weir
Research Associate, Natural Resource Ecology and Management


