Solids Content of Wastewater and Manure
Knowing the solids content of a liquid or slurry is an important first step in understanding its physical properties. But, you might ask, “How can a liquid be solid?” It’s a matter of terminology; “solid” and “solids” are two different things. Solid is a physical state of matter—ice is solid water. Solids are the portion of a liquid or slurry that is left when the water is removed. The amount of solids in wastewater and manure affects nutrient content, treatment processes and handling procedures. This factsheet highlights definitions and relationships among different types of solids in wastewater and manure.
Solids and Moisture Content
The Total Solids (TS) content of a sample is the mass of solids remaining after a sample has been dried in a 103oC oven for 24 hours, divided by the original mass of the sample. TS content of thick slurries are reported on a mass percent (%) basis. For dilute slurries and liquids, TS is usually expressed as mass per volume, most commonly mg/l. Units for solids content are discussed in more detail at the end of this fact sheet.
As TS concentration increases, and slurries start acting as semi-solids, the method of expressing solid/liquid relationship of mixtures switches from solids content to moisture content. Moisture content is defined as the mass of water in semisolid material divided by the wet mass of the material. As long as you stick to a wet mass basis for determining solids and moisture content, the two values add up to 100:
Moisture Content (%) + Solids Content (%) = 100
You will sometimes see solids content referred to as Dry Matter (DM) content.
Solids Fractions
Total solids tell how many solids are in a liquid or slurry. It does not say much about what kind of solids are present. Total solids are broken into seven fractions based on two distinctions:
- Are the solids suspended or dissolved in liquid?
- Are the solids made of organic or inorganic material?
Suspended or Dissolved Solids
Total Dissolved Solids (TDS) only appear as solid material when the sample is dried. For example, solid salt (NaCl) and sugar dissolve in water and appear to be invisible. Dry the sample and crystals reappear. Total Suspended Solids (TSS) are solids that remain intact when added to water.
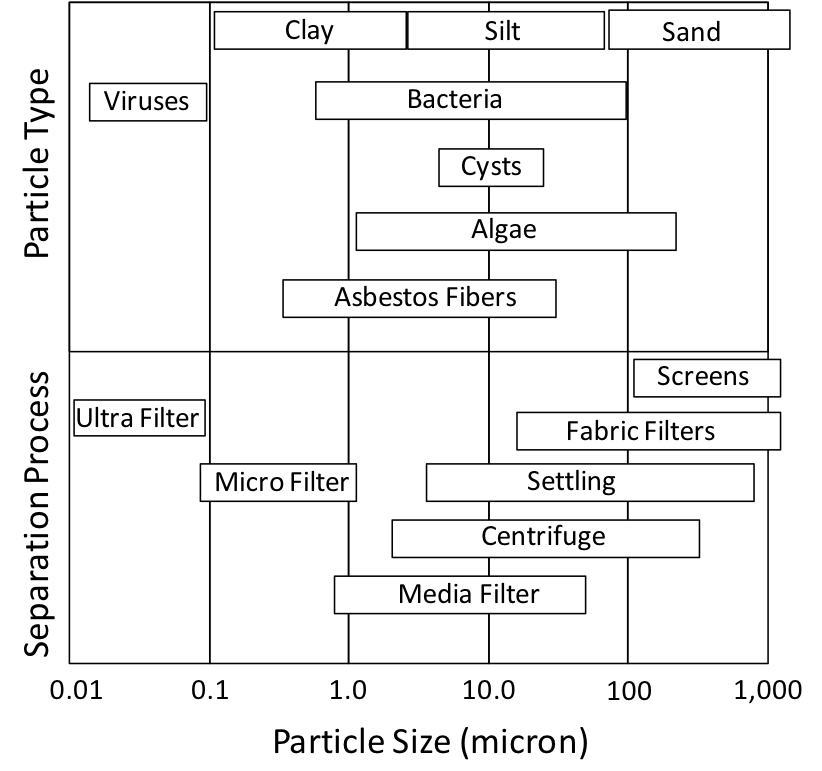
Actually, the distinction between TDS and TSS is a little more complicated. A particle is considered dissolved (TDS) if it can pass through a filter with 1.5 micron openings (1/17,000 inch). If the 1.5 micron filter stops a particle, it is considered to be suspended (TSS). This may seem arbitrary, and many particles smaller than 1.5 microns in size are definitely not dissolved (Figure 1). This division between dissolved and suspended at 1.5 microns is actually quite practical, however. Given the density of natural materials, a particle with a diameter of 2 microns is the smallest size that is easily removed by settling.
Figure 1. Size of common particles found in liquids and slurries.
Organic or Inorganic Solids
To the layman, organic matter is material that is living or was once alive. Chemists determine whether a substance is organic or inorganic based on its carbon content. The organic portion of wastewater or manure solids is the part that burns.
The portion of TS that remains after heating at 550 C for 1 hour is called Total Fixed Solids (TFS); the portion lost during heating is Total Volatile Solids (TVS).
Sometimes the fixed solids content is called the Ash Content. Volatile Solids is a measure of the organic matter content of a liquid or slurry, but you need to be careful; most organic materials have some ash content. For instance, fresh manure is usually 80 percent volatile and 20 percent fixed.
Relationship Between Solids Fractions
The two distinctions can be defined mathematically as:
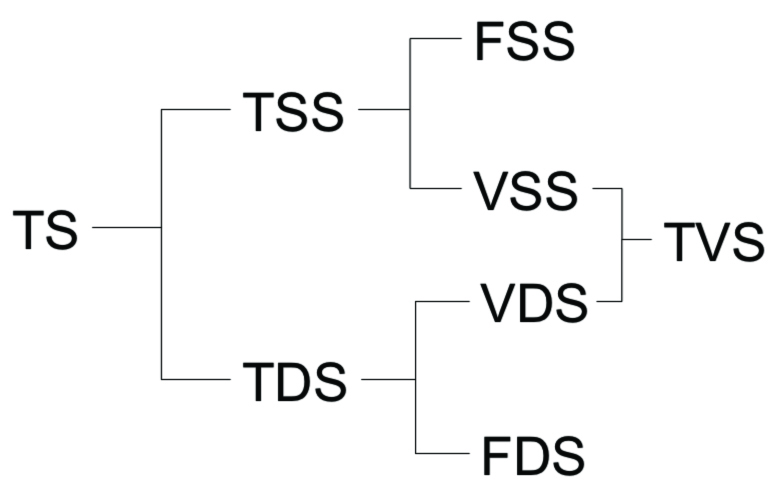
- TS = TDS + TSS
- TS = TFS + TVS
But, we also could place the solids left on the filter used to determine TSS and the liquid passing through the filter into a 550oC furnace and divide them into fixed and volatile fractions:
TSS = FSS (Fixed Suspended Solids) + VSS (Volatile Suspended Solids)
TDS = FDS (Fixed Dissolved Solids) + VDS (Volatile Dissolved Solids)
And the fixed and volatile fractions add up to give:
TVS = VSS + VDS
TFS = FSS + VSS
The relationship between solids fractions is shown visually in Figure 2. The nice thing about relationship between fractions is if you know any four measurements, you can figure out the other four. This is routinely done in the lab using the analyses TS/TVS and TSS/TVS:
TS/TVS: A sample is placed into a crucible, dried in an oven at 103 C for 24 hours (TS), then placed in a furnace for one hour at 550oC (TVS).
TSS/VSS: A sample is filtered through a glass fiber filter with 1.5 micron openings. The filter is dried in an oven at 103 C for 24 hours (TSS), and then placed in a 550 C furnace for 1 hour (VSS).
With TS, TVS, TSS and VSS in hand; numbers for TDS, TFS, FSS and FDS fall into place.

Figure 2. Relationship between solids fractions.
Solids Species
TS are divided into four characteristic fractions, sometimes called solids species:
TS = VSS + FSS + VDS + FDS
These four fractions are called species because they define the nature of a liquid or slurry.
VSS are the volatile portion of settleable organic particles. FSS are inorganic particles suspended in the liquid; such as undissolved salt crystals and silt particles. VDS are organic compounds dissolved in the liquid; such as sugars, fatty acids, and organic colloids. FDS are inorganic compounds dissolved in the liquid.
FDS and, more commonly, TDS are used to represent the salt content of a liquid. Remember, FDS also may contain clay particles and the fixed portion of some microbial bodies.
Species Visualization
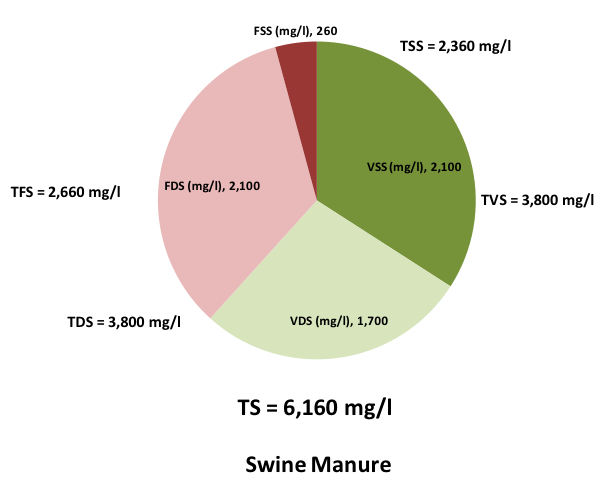
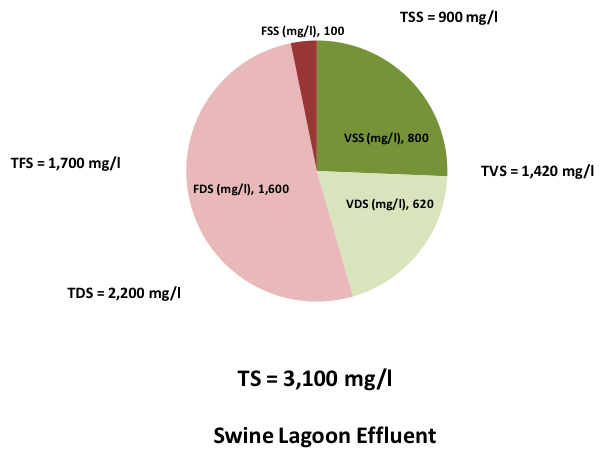
Figure 3 shows a method of visualizing the character of a liquid or slurry sample using solids species. TS content is represented by the size (the area) of the circle. The circle is broken into four pie pieces representing VSS, VDS, FDS and FSS. Concentration of each species is represented by size of the slice. Volatile solids are represented by green. Fixed solids are red. Suspended solids are dark, and dissolved solids are light colored.
Figure 3 contains graphics of two samples: thin slurry of swine manure and liquid swine lagoon effluent. Notice the circle of the manure sample is larger, since its TS concentration is nearly twice that of the effluent. Volatile solids dominate the manure, while more than half of the effluent solids are fixed. The effluent sample is almost all dissolved solids.
Think of these two as a pair. Swine manure is treated by the lagoon to become effluent. Volatile solids are converted to carbon dioxide and methane. Undigested manure TSS and flocculated microbes settle as sludge. The net result is effluent with lower total solids, higher salt content and lower organic matter than the manure.
Figure 3. Graphic visualization of solids contents and species.
Units of Solids Content
The solids contents of liquids and slurries are expressed on either a volume or mass basis.
Mass per Volume Basis
Milligrams per liter (mg/l): The mass of solids contained in a sample are divided by the volume of the sample. The most common units are mg/l, although in extra thick slurries, units are sometimes given in g/l.
Mass per Mass Basis
Parts per Million (ppm): If the density of the sample is assumed to be 1,000 g/l (this is the density of water), then units of mg/l convert directly to ppm – there are 1 million mg in a liter of water. These units may not be valid for slurries, since the density of slurry may be greater than 1,000 g per liter.
Percent Solids on Wet Basis (% wb): The mass of solids in a sample are divided by the original weight of the sample and multiplied by 100. This is usually the more accurate method for reporting solids contents of slurries. An easy conversion to remember is: % wb = ppm x 10,000.
Percent Solids on Dry Basis (% db): These units are sometimes used when reporting the volatile solids content of a sample. Essentially, this gives the percentage of TS that are volatile, since the dry content of the sample is, by definition, TS.
Units of Moisture Content
Moisture content is almost always reported on a mass per mass basis, but there are two ways of reporting: percent wet basis and percent dry basis.
Percent Moisture Content on Wet Basis (% wb): The mass of liquids in a sample is divided by the original mass of the sample and multiplied by 100. This is the most common method of reporting moisture content of food and agricultural products.
Percent Moisture Content on Dry Basis (% db): The mass of liquids in a sample is divided by TS content and multiplied by 100. These units are rarely used for food and agricultural products, but widely used in soil analyses. Dry basis moisture content divided by dry bulk density gives the volumetric moisture content of a sample.
Reference
American Public Health Association. 1998. 2540 Solids, pp 2-54 – 2-60 in Standard Methods for the Examination of Water and Wastewater, 20th ed. Washington DC: APHA.
Doug Hamilton
Waste Management Specialist
Biosystems and Agricultural Engineering
Hailin Zhang
Waste Nutrient Management Specialist
Plant and Soil Sciences


