Oklahoma’s Recovery from the Great Recession: Trends in Rural vs. Urban Areas
Introduction
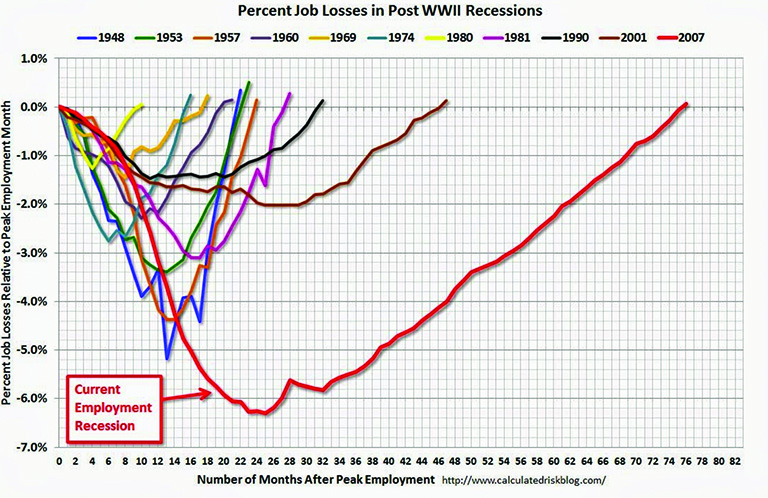
A recession is typically defined by economists as two consecutive quarters of negative economic growth, as measured by Gross Domestic Product (GDP). The most recent recession, often referred to by economists as “The Great Recession,” began in late 2007 and continued until June 2009. Although national GDP growth turned positive at that point, the effects of this economic downturn would be felt for almost 80 months. National employment levels dropped by more than six percent of their pre-recession peak numbers, and did not return to their pre-recession levels until 2014 (Figure 1). This is by far the longest recovery time for any recession since WWII.
Figure 1. Percent job loss in Post WWII Recessions.
Source: www.calculatedriskblog.com
This report will document Oklahoma’s experience with the Great Recession, focusing
on differences between rural and urban areas. It will demonstrate that in terms of
employment, Oklahoma was not hit nearly as hard as most other states, and that rural
areas of the state have bounced back particularly quickly.
Nationally, urban and rural employment levels were affected similarly with a drop
of slightly more than five percent from 2008-2009 (ERS, 2013). National signs of recovery
began in 2010 in both metro and non-metro counties. However, the non-metro recovery
slowed promptly as metro areas continued to improve. From the second quarter in 2011
to the second quarter in 2012, metropolitan counties saw a 1.6 percent rise in employment
(measured by number of jobs) compared to only a 0.5 percent increase in non-metropolitan
counties. National unemployment rates for metro and non-metro counties rose together
to approximately 10 percent by late 2009, but fell slightly more rapidly for non-metro
counties in 2010 and 2011 – mostly due to a decline in labor force participation (ERS,
2012).
“Rural” vs. “Non-metropolitan”
Rural is defined at the community level and denotes a population of less than 2,500.
Non-metropolitan is defined at the county level and denotes counties without any cities of population more than 50,000 (Metropolitan Statistical Areas, or MSAs). Counties where more than 25 percent of the workforce commutes to an MSA are also considered Metropolitan. Non-metropolitan counties are split into two distinct categories:
- Micropolitan counties contain a community with a population more than 10,000
- Noncore counties do not have a core community of more than 10,000
How Does Oklahoma Compare?
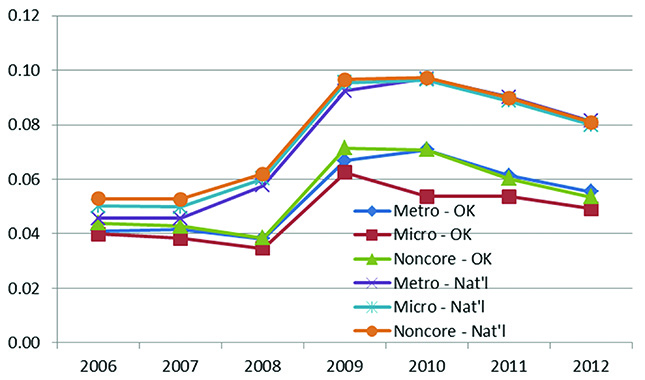
Oklahoma had a late entry into the recession, as evidenced by unemployment rates that were on a downward trend into 2008 before spiking in 2009. National rates of unemployment, on the other hand, began to rise in 2008 (Figure 2). Interestingly, unemployment rates in micropolitan counties within the state began to recover as early as 2010, while rates for noncore and metropolitan counties continued to increase. Overall unemployment rates never rose above 7 percent for any part of Oklahoma, much lower than the nearly 10 percent rates seen for the nation. After 2010, unemployment rates dropped evenly across the nation’s metro / micro / noncore counties; however in Oklahoma, the recovery was more pronounced in the micropolitan areas.
Figure 2. Unemployment rates during the Great Recession by metro / micro / noncore status.
According to Bureau of Economic Analysis data, Oklahoma had completely recovered to
2008 peak job levels (2.2 M jobs) by 2012, significantly faster than the nation as
a whole (Figure 1).
As an alternative to unemployment rates (which includes only those individuals who
identify themselves as being in the work force), many economists argue that employment-to-population
ratios are a better measure of labor market conditions (Appelbaum, 2014). This measure
includes all individuals in the working age population (age 16 and older) as opposed
to only those in the workforce. For the Great Recession in particular, long-term
unemployment was strikingly high, leading many discouraged individuals to stop looking
for work. Once these people stopped looking for work, they were no longer included
in the unemployment rate. Employment-to-population ratios essentially measure the
shares of adults with jobs – a different measure than only those in the work force.
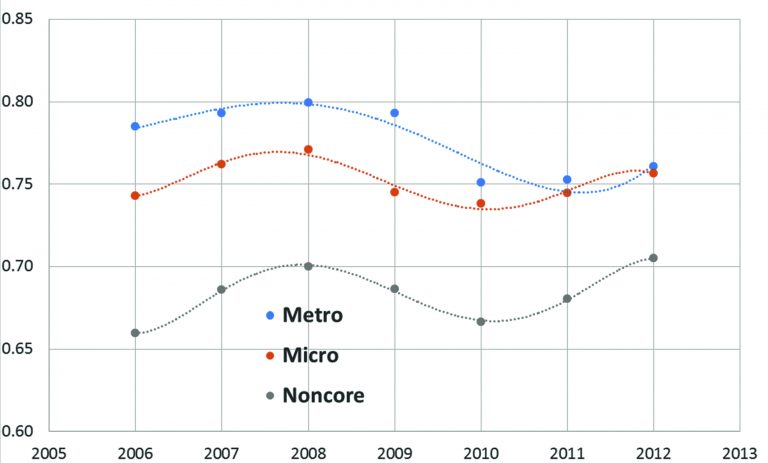
Figure 3 demonstrates that the employment-to-population ratios were improving for all Oklahoma counties going into 2008. While all types of counties experienced a decline between 2008 and 2010, noncore counties rebounded quite rapidly and showed higher ratios for 2012 than in 2008. Micropolitan and metropolitan counties, on the other hand, had not quite recovered to their 2008 levels by 2012. Metropolitan areas, in particular, still had employment-to-population ratios nearly five percentage points lower than 2008 levels. This chart also demonstrates that noncore counties have significantly lower employment-to-population ratios in general, in part because of the higher proportion of senior citizens (age 65+).
Figure 3. Comparison of Oklahoma employment-to-population ratios.
Overall, Figures 2 and 3 demonstrate that non-metropolitan counties (micropolitan and non-core) generally fared better than their metropolitan counterparts in terms of returning to previous levels of employment in Oklahoma.
Shifting Industries?
Some industries across the nation were particularly hit hard by the Great Recession,
including construction and manufacturing. Others survived, and even thrived, as the
recovery began, including a rush into oil and gas extraction fueled by hydraulic fracturing.
To explore whether the Great Recession resulted in meaningful industrial shifts for
Oklahoma counties, we explored measures of industrial concentration known as “Location
Quotients” (LQs). LQs compare the concentration of a particular industry or occupation
within a local area (like a county) to a state or national measure.
LQs can reveal what makes a particular region “unique” in comparison to the state
level of concentration. This type of analysis is important because it shows what
industries are blooming in specific areas. An LQ of greater than one implies that
an area / county has proportionally more of the workforce employed by a specific industry
than the region/state as a whole. Note that LQs do not necessarily measure the ‘dominant’
industry within a county – it is entirely possible to have a sector with a large amount
of employment, but a small LQ or vice versa. Instead, LQs measure what the competitive
advantage of that county might be.
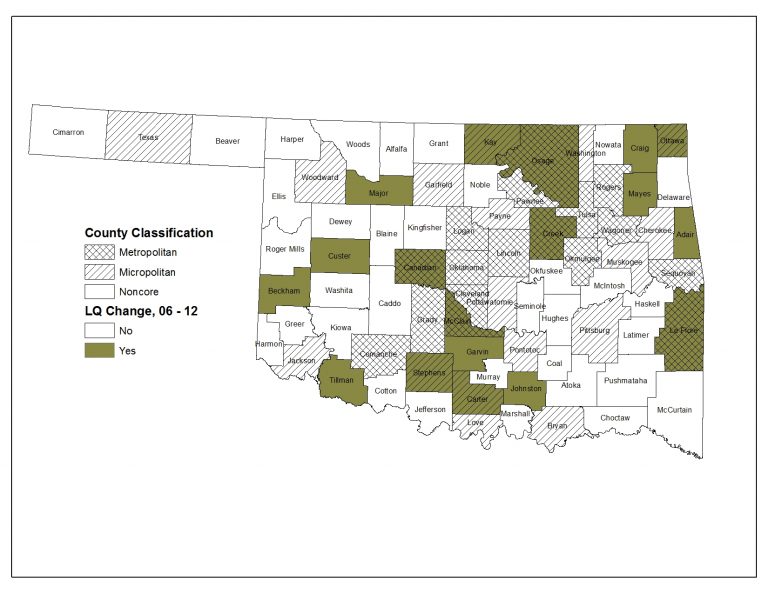
The primary interest is whether the highest-LQ industry in any Oklahoma county shifted between 2006 and 2012 – that is, if the recession or some other force caused a major change in a county’s competitive advantage. Eighteen of Oklahoma’s 77 counties (24 percent) changed to a new highest-LQ industry during this time (Figure 4). The average for the highest location quotient in each county of Oklahoma in 2006 was 3.91, meaning the proportion of employment in that industry was nearly four times the state average. This average dropped to 3.80 in 2012. The highest location quotients in both 2006 and 2012 were in Comanche County (11.1 and 11.3 for military employment). This was expected, given the dominance of Ft. Sill as an employer in the area.
Figure 4. Oklahoma counties that changed industries with highest Location Quotient between 2006 and 2012.
A Closer Look
Oklahoma has 17 metropolitan counties, and five of them changed their highest LQs
during this period (29 percent). Oklahoma also has 17 micropolitan counties, and
four experienced a change in their highest LQ (24 percent). Nine out of the 43 noncore
counties saw a similar shift (21 percent). (Note that these metro / micro designations
changed in 2013.) As Figure 4 makes clear, there does not seem to be a geographic
pattern to where the changes occurred, although there is some clustering in the northeast
and southern portions of the state.
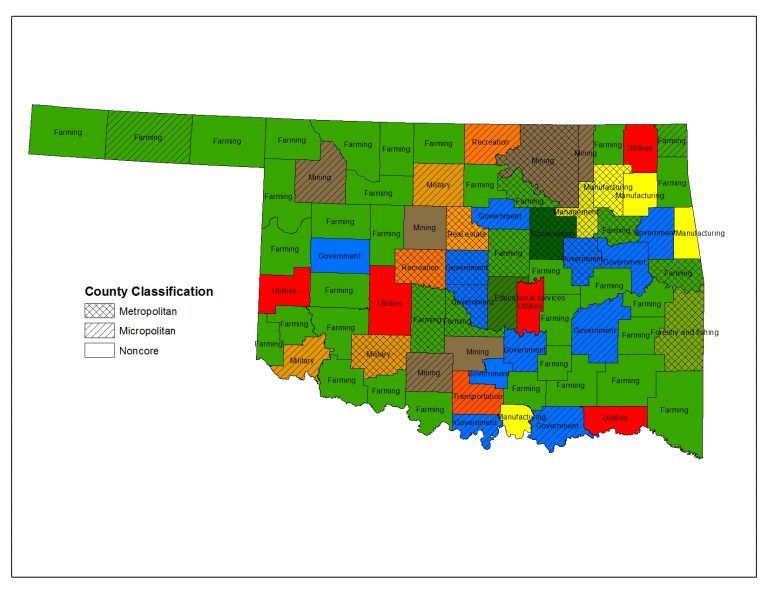
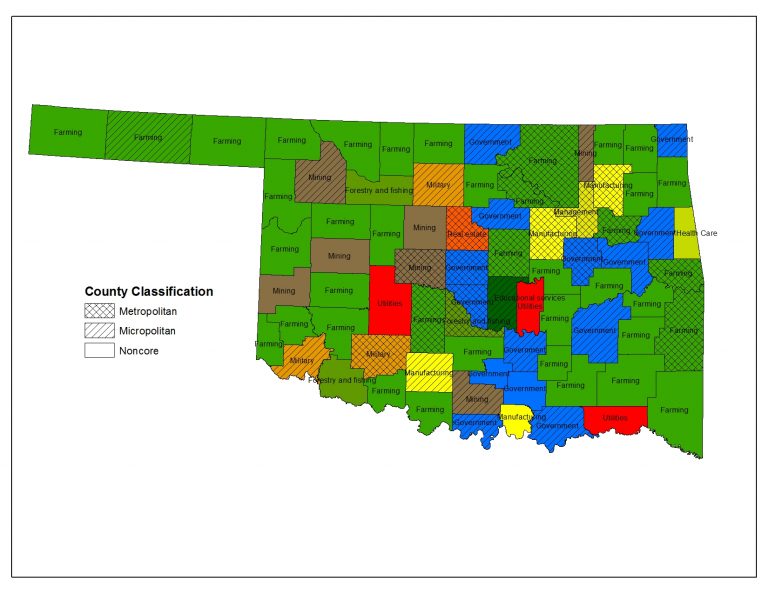
Figures 5 and 6 show the industries with the highest LQs in 2006 and 2012, respectively. Out of the 18 counties that shifted, five moved to farm employment; four shifted to mining; three shifted to forestry, fishing and related activities; three shifted to government; two shifted to manufacturing and one shifted to health care. This is a fairly diverse realm of industry change, showing that there wasn’t a single industry that became the new focus for competitive advantage across the state. The industries that had previously demonstrated the highest concentrations were just as diverse, showing this shift wasn’t the result of the failure of a single industry. The two industries with the highest number of changes were farm employment and mining, showing a change in four counties each.
Figure 5. Highest Location Quotients in 2006.
Figure 6. Highest Location Quotients in 2012.
Conclusion
Oklahoma was late coming into the Great Recession, with signs of economic decline
not becoming apparent until 2009. This is interesting to note because the rest of
the nation began to have higher unemployment rates as early as 2008. There could
be several reasons for this, including the insulated nature of the financial industry
in the state (many small, local/regional banks with conservative management practices),
or a greater dependency on industries not dramatically affected by the recession.
Unlike the national trends, nonmetro counties (both micro and noncore) in Oklahoma
showed a better recovery rate than their metropolitan counterparts. This is likely
due to the success of both the farming and mining industries in Oklahoma, along with
relatively well-diversified economies in many nonmetro counties.
The majority of counties (76 percent) did not change industries with the largest location
quotient between 2006 and 2012, demonstrating that the Great Recession did not dramatically
alter the competitive advantage for most Oklahoma counties. Interestingly, while
some counties benefited from newly found jobs in the oil and gas industry, others
went away from the mining industry during this time frame (four counties – mostly
in the west – switched to mining as their highest-LQ industry, and four counties –
mostly in the east – switched from mining to some other industry). Farming remains
a dominant industry in many noncore counties across the state, with 31 of 43 counties
having farming as their highest LQ industry in 2012 (72 percent).
As the Oklahoma economy moves forward, it will be important to continue to monitor growing and shrinking industries. Future county- or state-level policies should take into consideration the history of economic growth in the area and how local labor markets have responded to shocks such as those seen during the Great Recession.
Sources and More Information
Appelbaum, Binyamin. 2014. “Measuring recovery? Count the employed, not the unemployed.”
http://www.nytimes.com/2014/06/17/upshot/measuring-recovery-count-the-employed-not-the-unemployed.html
U.S. Department of Commerce. Bureau of Economic Analysis. 2006-2012. Regional Economic
Accounts at: http://www.bea.gov/regional/index.htm
Hertz, Thomas, Kusmin, Lorin, Marre, Alexander, and Parker, Timothy. 2014. “Rural
Employment Trends in Recession and Recovery.” USDA-ERS Report No. ERR-172.
United States Department of Agriculture. Economic Research Service. Rural America
at a glance. 2013 edition
United States Department of Agriculture. Economic Research Service. Rural America at a glance. 2012 edition
Jeremiah Taylor
Undergraduate Research Assistant
Associate Professor and Extension Economist

