Oklahoma Lawn and Garden Soil Test Summary 2015-2019
The OSU Extension’s Soil, Water and Forage Analytical Laboratory (SWFAL) analyzes soil samples and archives testing results for all 77 Oklahoma counties. This document is a statewide and county summary of all lawn and garden soil samples taken from 2015-2019. The summary from 2015-2019 consists of 25,274 samples with results presented in Tables 1 and 2. Samples identified as agriculture, consultant, campus or research were excluded in the summary, since most of them do not represent typical residential environments. Soil samples were analyzed for pH, buffer index (BI) if pH was less than 6.3, nitrate-nitrogen (NO3-N, pounds per acre), soil test phosphorus (STP) index, and soil test potassium (STK) index. Methods used for the tests can be found in PSS-2901, Procedures Used by OSU Soil, Water and Forage Analytical Laboratory.
Medians are given along with the average because most of the data do not have normal distributions, and sometimes averages give a false impression about where the center of the distribution lies. Outliers were also removed from the database (NO3-N>1000, STP>2000, and STK>2000) because some samples marked as lawn or garden but might be from fertilizer disposal sites or composts.
This summary is a valuable index of the soil fertility status of Oklahoma home lawns and gardens. However, soil samples still need to be collected and analyzed for an individual gardener to better manage soil fertility and pH. Similar summaries for individual counties are also available. To request a copy for a specific county, please contact the authors at (405) 744-6630, soiltesting@okstate.edu or hailin.zhang@okstate.edu.
Soil pH and Lime Requirements
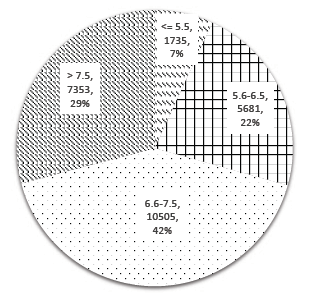
The pH of Oklahoma lawn and garden soils tends to be near neutral with a median of 7.1. That means 50% of the lawns and gardens tested had a pH less than 7.1 and 50% tested were above 7.1. Soil pH of all samples is divided into four groups, as shown in Figure 1. Nearly 64% of soils tested are in the pH range 5.6 to 7.5. The remaining 36% are outside this range, with 29% above 7.5 and only 7% are below 5.5. Many plants will begin to show signs of reduced vigor with
Table 1. Median, average, and ranges of nitrate-nitrogen (NO3-N), soil test phosphorus (STP) and soil test potassium (STK) for all lawn and garden soil samples tested by SWFAL between 2015-2019.
| Soil pH | NO3-N Soil pH (lbs./A) |
STP Index | STK Index | |
|---|---|---|---|---|
| Count | 25,274 | 25, 274 | 25,274 | 25,274 |
| Average | 7.0 | 28 | 205 | 403 |
| Min | 3.1 | 0 | 0 | 4 |
| Max | 9.9 | 986 | 1995 | 1999 |
| Median | 7.1 | 14 | 127 | 344 |
Table 2. Distributions of soil pH, NO3-N (pounds per acre), Soil Test P Index (STP) and Soil Test K (STK) Index analyzed from 2015-2019.
| Soil pH | <= 5.5 | 5.6-6.5 | 6.6-7.5 | >7.5 | ||
|---|---|---|---|---|---|---|
| Count | 1.735 | 5.681 | 10,505 | 7,353 | ||
| Percent | 6.86% | 22.48% | 41.56% | 29.09% | ||
| NO3-N (lbs./A) | <10 | 10-25 | 26-40 | >40 | ||
| Count | 9,403 | 8,429 | 2,923 | 4,519 | ||
| Percent | 37.20% | 33.35% | 11.57% | 17.88% | ||
| STP Index | <65 | 65-120 | 121-300 | >300 | ||
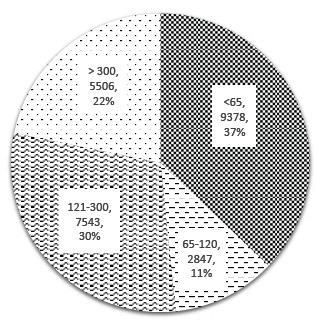
| Count | 9,378 | 2,847 | 7,543 | 5,506 | ||
| Percent | 37.11% | 11.26% | 29.84% | 21.79% | ||
| STK Index | <200 | 200-300 | 301-450 | >450 | ||
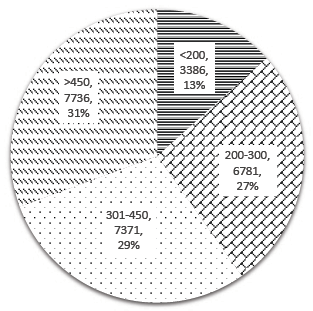
| Count | 3,386 | 6,781 | 7,371 | 7,736 | ||
| Percent | 13.40% | 26.83% | 29.16% | 30.61% |
Figure 1. Distribution of pH values of Oklahoma lawn and garden soil samples tested from 2015-2019.
soil pH levels below 6.0 and over 7.5. Strong soil acidity not only lowers the availability
of phosphorus, but also increases the level of toxic elements present, such as aluminum
and manganese. Lime must be used to neutralize the acidity and sustain a healthy garden
and landscape. Liming rates should be determined by the buffer index, not the pH value.
A buffer index value is provided for all soil pH values below 6.3.
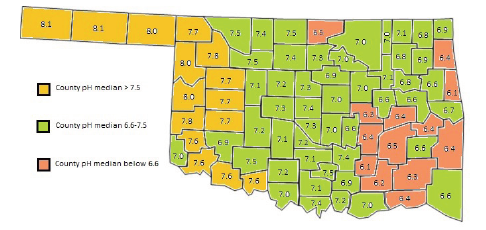
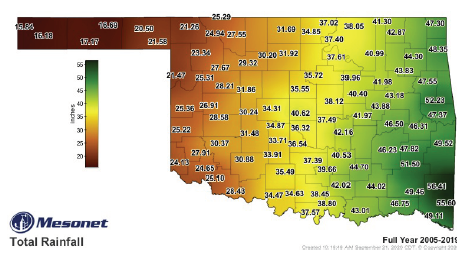
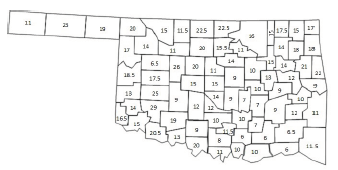
In general, Oklahoma soils have a gradient pH value from the calcareous soils in the
panhandle and western Oklahoma, which experiences less rainfall, to eastern Oklahoma,
where more rainfall creates soils that are more acidic. Note the similarity in the
color gradient when looking at Figure 2 and Figure 3. While it is possible to have
acidic soils throughout our state, more counties in central to eastern Oklahoma had
soil reports with pH values below 5.5.
Available Nitrogen in the Soil
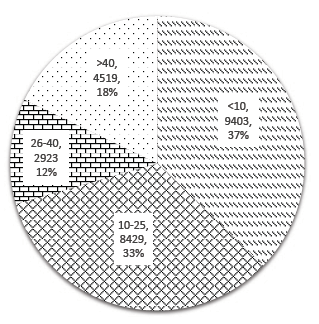
The distribution of NO3-N (available N) is shown in Table 2. Eighty-two percent of total soils tested were deficient (<40 pounds per acre) in N, with a median of 14 pounds per acre, and only 4,519 of the 25,274 (18%) lawns and gardens sampled had soil NO3-N greater than 40 pounds per acre as seen in Figure 4. This indicates that most gardeners need to
Figure 2. Median pH values of soil samples tested from 2015-2019 for Oklahoma counties.
Figure 3. Average annual rainfall for Oklahoma from 2005-2019.
Figure 4. Distribution of NO3 -N (pounds per acre) in Oklahoma lawn and garden soil samples tested from 2015-2019.
apply nitrogen fertilizer for improved plant production, based on soil tests alone. While there were 4,519 individual reports that had greater than 40 pounds per acre of NO3-N, Figure 5 shows not one county in Oklahoma had a median NO3-N above 40 pounds per acre and the highest county median was 26 pounds per acre of NO3-N. This is because nitrate leaches and generally does not accumulate in the soil in very high amounts.
Figure 5. Median NO3 -N (pounds per acre) of lawn and garden soil samples tested from 2015-2019 for Oklahoma Counties.
Plant Available Phosphorus
The phosphorus soil test estimates the availability of soil phosphorus during the whole growing season. For intensively cultivated landscapes, phosphorus fertilizer needs to be added if the soil test phosphorus (STP) index is less than 65 (100% sufficient level). The reported STP index values are graphed in Figure 6 and the county median STP index values are shown in Figure 7. About 63% of the soils tested had sufficient levels of phosphorus, while 37% were deficient and needed amendments. As phosphorus builds up in the soil, more phosphorus will be lost to surrounding waterbodies, resulting in water quality problem. Therefore, better management of phosphorus fertilization is needed in the state.
Figure 8. Distribution of soil test potassium index of Oklahoma lawn and garden soils tested from 2015-2019.
Figure 6. Distribution of soil test phosphorus (STP) index in Oklahoma lawn and garden soils tested from 2015-2019.
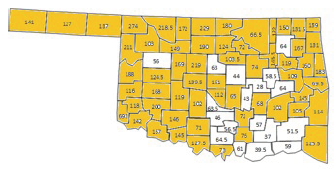
Soil Test K Index
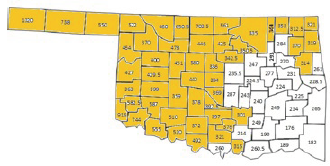
Most Oklahoma soils are high in potassium. This can be attributed to the parent materials and low rainfall conditions under which our soils have developed. Data in Figure 8 confirms this tendency with 60% soil test potassium (STK) index above 300, or 100% sufficiency, while 40% are showing a deficiency with a STK below 300. As with the Oklahoma soil pH gradient, the STK index decreases from western to eastern Oklahoma along the precipitation gradient, as shown in Figure 9.
Figure 9. Median Soil Test potassium (STK) index values of soil samples tested from 2015-2019 for Oklahoma Counties. Shaded counties had an STK index 300 and greater.

