Oklahoma Cropland Rental Rates: 2020-21
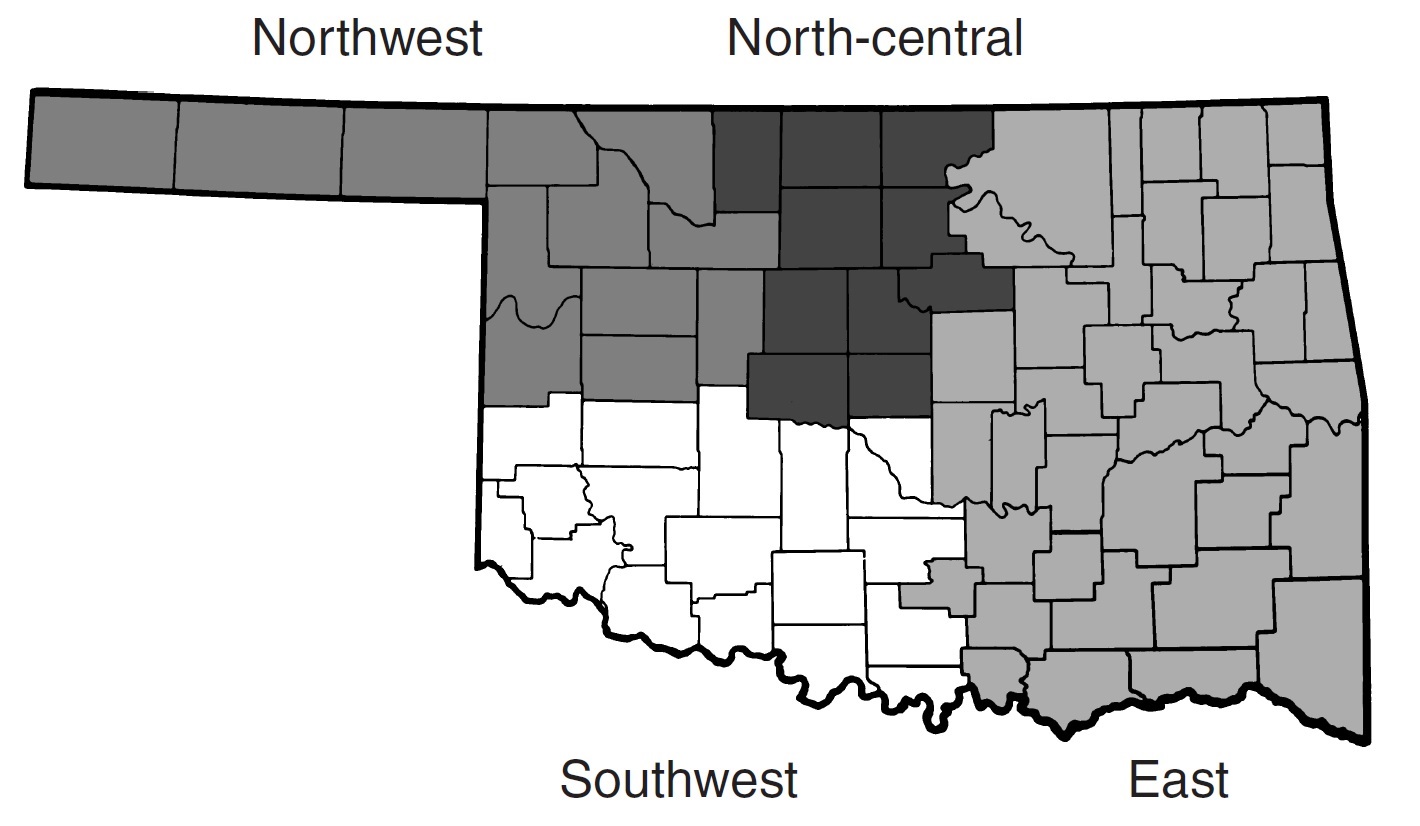
Rental agreements and rates are influenced by the landowner’s costs, the tenant’s expected earnings, previous rates charged, competition for land, government programs, tax laws and the non-agricultural economy. The results of a statewide farmland leasing survey conducted in 2020 are reported here. Respondents were recipients of a survey mailing by the Oklahoma Agricultural Statistics Service. Approximately 265 surveys were returned with usable data. The cooperation and assistance of the landowners and agricultural producers who responded to this survey are greatly appreciated. Figure 1 shows the regions of the state used in reporting survey results: northwest, southwest, north-central and east.
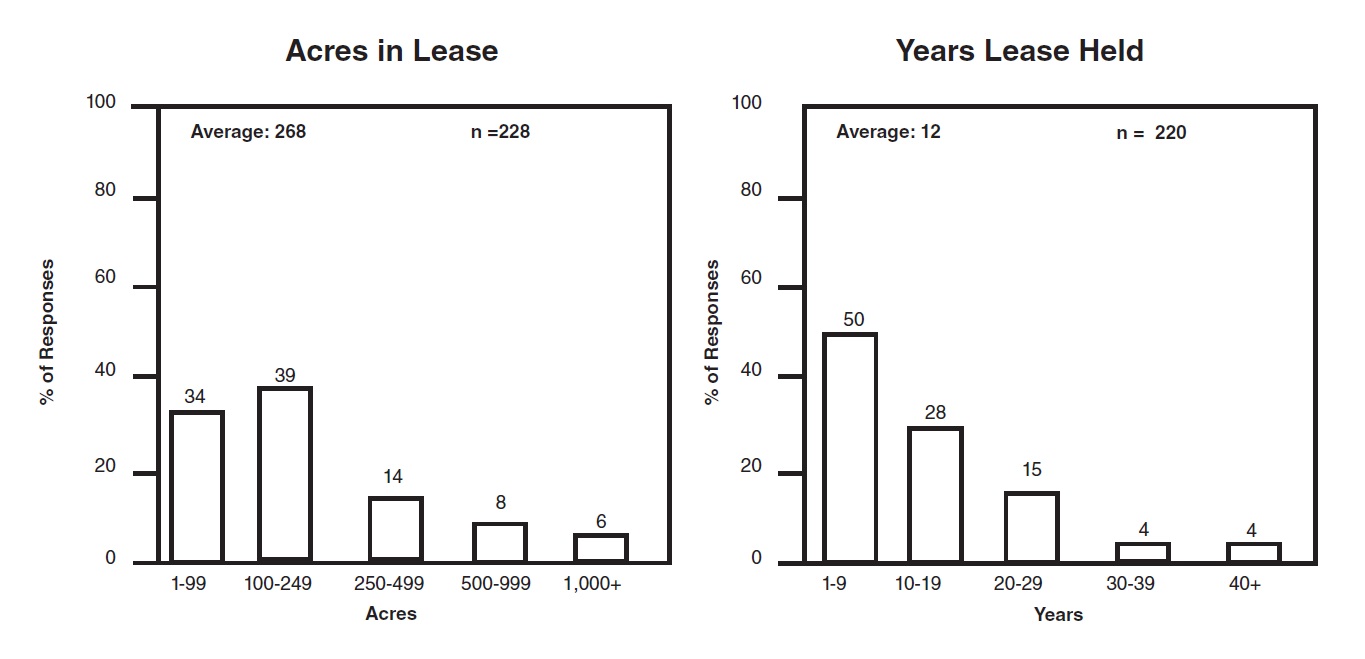
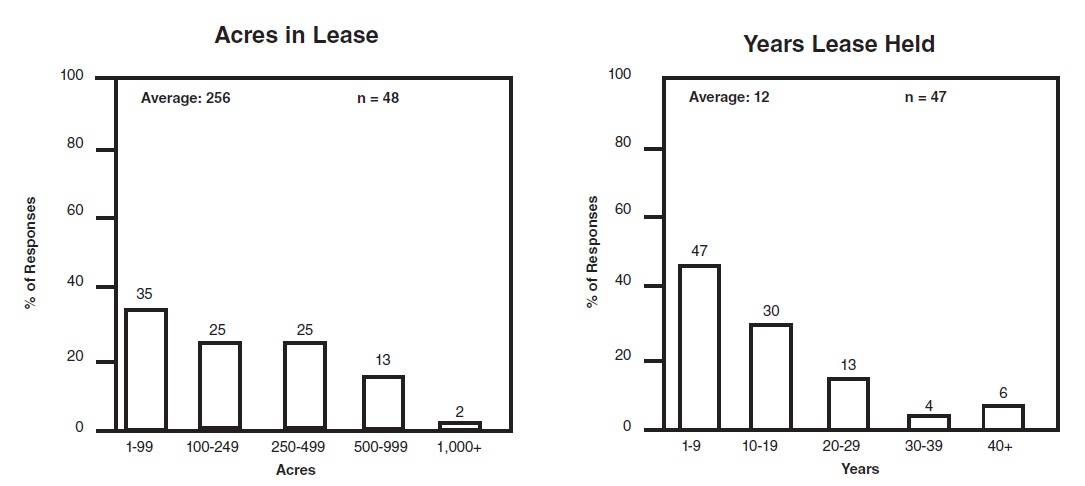
On average, both crop cash and crop share lease agreements had been in effect for 12 years (Table 1 and Table 3). The statewide average lease size was 268 acres for cash rentals and 256 acres for share rentals. Median values are provided as an additional measure of the central tendency of the survey response distribution. The median is the value at the midpoint of the survey responses. Figures 1a and 3a show the distribution of responses regarding acres and the years held for cash leases and share leases, respectively.
Most tenants and landlords in Oklahoma appear to be satisfied with their lease agreements. Sixty-five percent of respondents with cash lease agreements and 70% of respondents with crop share agreements classified their leasing agreements as either good or excellent from a standpoint of fairness in the most recent survey. These levels appear to have improved since the 2018 survey. In addition, 20% of respondents with cash lease agreements and 15% of respondents with crop share agreements classified their leasing arrangements as adequate from the standpoint of fairness in the most recent survey.
Cropland Cash Rental Rates
Cash leases require a fixed payment, typically cash (or infrequently, a specified yield such as 10 bushels of wheat). Survey results document some regional differences in rental rates as cash rentals vary across the state. Typically, cropland rentals are highest in the most productive regions in Oklahoma where soil types and seasonal rainfall are most favorable for crop production. As in prior surveys, cash rental rates for dryland wheat were highest in the north-central region of the state, averaging $36.53 per acre, compared to $29.20 to $31.63 in other regions of the state (Table 2). The state average of $32.54 declined marginally from the 2018 average of $32.90.
Figure 2 shows the distribution of responses (123) for dryland wheat cash rental rates. Seven percent of the respondents reported a rental rate between $10 and $19 per acre, 27% reported a rental rate between $20 and $29 per acre, 39% reported a rental rate between $30 and $39 per acre, 19% reported a rental rate between $40 and $49 per acre and 8% of the respondents reported a rental rate of $50 or more per acre.
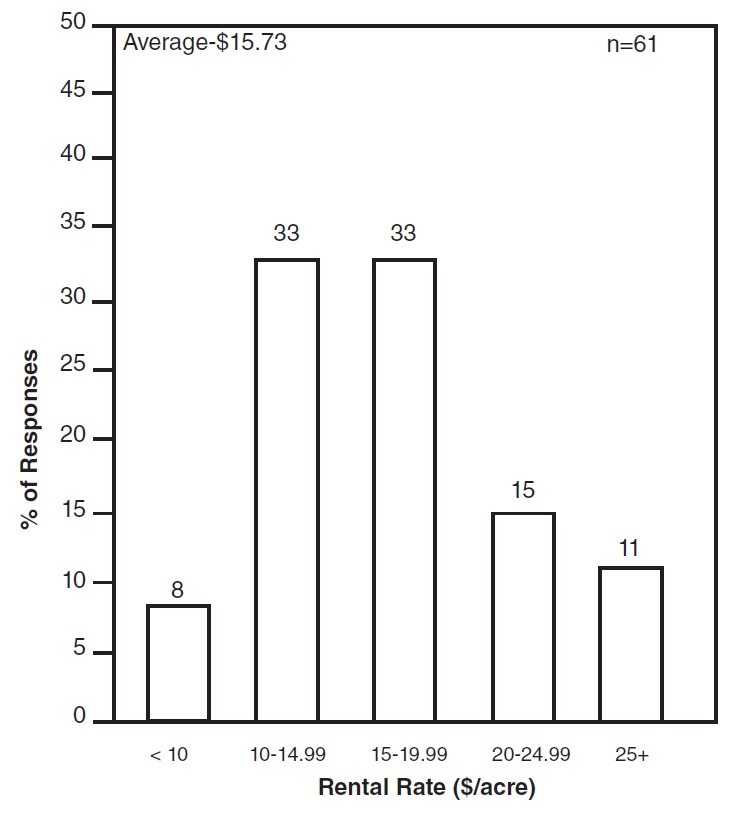
Statewide average rental rates for dryland grain sorghum, alfalfa, and soybeans were higher than wheat. It is important to note that since there were less than 10 responses for these crops, the averages are less reliable than they would be with more observations. As expected, rentals for native grass hay were higher in eastern Oklahoma than levels reported for rangeland in the western region of the state. A distribution of responses for native grass hay is shown in Figure 2b.
Cropland Share Rental Rates
Crop-share arrangements refer to a method of leasing cropland where production is
shared between the landowner and the operator. Other income items, such as government
payments and crop residue, often are shared as are some of the production expenses.
Many lease arrangements are based on customary methods of sharing production and associated
expenses in a community or geographic region. In crop share leases statewide, the
tenant commonly receives around 2/3 of dryland wheat, grain sorghum, cotton and soybeans
(Table 4). On the expense side, the tenant customarily pays that or more of the fertilizer,
herbicide, insecticide and pesticide application expenses and nearly all of harvesting
expenses (combining and hauling) for row crops and small grains. According to the
survey results, there appears to be an increased willingness by the landlord to share
cotton ginning expense with the tenant. Despite isolated reports of haying expense
(cutting, raking and baling) paid by the landlord, it is still common practice that
the tenant is responsible for most of the haying operations. Because lime has multi-year
benefits, landowners may share in the cost of lime application if a multi-year lease
agreement is not in place.
Figure 4a shows the distribution of survey responses regarding the tenant’s share
of production. Figure 4b shows the distribution of responses for the tenant’s share
of crop inputs and expenses. These graphs indicate the tenant typically pays either
2/3 or all of the seed, fertilizer, pesticides and chemical application costs. As
mentioned, harvesting and hauling operations for row crops and small grains are often
paid entirely by the tenant. Compared to 2018 survey, fewer tenants paid 100 percent
of ginning expenses. Figure 4c shows the distribution of responses for hay inputs
and expenses. Once again, there appears to be an increased willingness by the landlord
to share some of the haying expense with the tenant.
Other Lease Terms
Many lease agreements specify terms and conditions beyond the rental rate, which affect the value of the lease and the “real” rental rate. For instance, tenants may or may not be allowed to hunt, harvest pecans, graze cattle, cut timber, use buildings, improvements and lease out hunting privileges. Lime application costs or similar costs for improvements in which the benefits are shared over a number of years may be shared by the landlord and tenant, or if the tenant pays for them initially, repaid by the landlord at a fixed rate per year. Tenants may be required to maintain fences, spray weeds annually, provide liability insurance, share oil field damages, maintain terraces and leave strips of grain in the field for game. Landlords may provide a well and water, fencing material or land for a mobile home. Tenants may ask for several months notice if the landlord wishes to terminate the lease agreement. In some cases, leases contain an option to buy with rental payments applied to the purchase price.
Historical and Regional Perspective
Table 5 provides historical data on cropland rental rates for Oklahoma, Kansas, Arkansas and Texas for 2011-2020 as reported by the USDA National Agricultural Statistics Service (NASS). County level cropland rental rate data.
Results from the next annual USDA Cash Rent Survey will be available with the 2021
release in September 2021.
Concluding Comments
“Fair” rents must be negotiated between tenant and landlord. Regional or state average rental rates may be used as a beginning point for discussion and negotiation of rental rates. However, differences in land quality, improvements and restrictions on land use can greatly impact the value of potential leases. Likewise, differences in family living expenses and hired labor costs can be substantial for different operations, affecting maximum rental bids.
New legal restrictions and liability factors may instigate changes in future farm lease agreements. Some farm management firms include language that explicitly requires the tenant to be a good steward of the land. The tenant is expected to follow label restrictions in the use of pesticides, to remain compliant with the farm’s conservation plan and to dispose of wastes in a manner approved by the Environmental Protection Agency. Some leases already stipulate precisely what fertilizers, pesticides and seed should be used on the property. Both landlords and tenants must be aware of changing environmental laws and regulations to avoid potentially costly liabilities.
Related Publications and Other Resources
To help educate landlords and tenants with equitable lease agreements and current best management practices, visit the Oklahoma State University (OSU) Ag Land Lease website. A joint effort between OSU’s Plant and Soil Sciences and Agricultural Economics Departments, the website contains a wide assortment of farm management spreadsheet tools, lease information and forms, rental rate and land value resources, legal and tax considerations plus the latest production practices in Oklahoma.
The AgLease101.org website hosts several North Central Farm Management Extension Committee
(NCFMEC) publications on leasing including these titles:
• Crop Share Rental Arrangements For Your Farm, NCFMEC-2
• Fixed and Flexible Cash Rental Arrangements For Your Farm, NCFMEC-1
• Pasture Rental Arrangements, NCFMEC-3
In addition to publications, worksheets and free downloadable sample lease forms are available on the site.
Recent Oklahoma school land lease auction information also is available through the Real Estate Management Division of Commissioners of the Land Office.
Table 1. Crop cash agreement statistics by region, 2020-21.
| Northwest | Southwest | North-central | East | State | |
|---|---|---|---|---|---|
| Acres in Lease | |||||
| Average | 369 | 232 | 301 | 144 | 268 |
| Median | 202 | 160 | 147 | 95 | 150 |
| Count | 61 | 61 | 58 | 48 | 228 |
| Years Lease Held | |||||
| Average | 12 | 15 | 10 | 10 | 12 |
| Median | 10 | 10 | 5 | 7 | 10 |
| Count | 57 | 60 | 57 | 46 | 220 |
Figure 1a. Relative frequency of crop cash agreement statistics, 2020-21.
Table 2. Crop cash rental rates, 2020-21.
| No. of Observations |
Average | Median | ||
|---|---|---|---|---|
| Dryland Alfalfa | 5 | 38 | (D) | |
| Dryland Grain | ||||
| Sorghum | 7 | 43.36 | (D | |
| Dryland Native Hay | ||||
| Northwest | 10 | 14.5 | (D) | |
| Southwest | 11 | 12.55 | 15 | |
| North-central | 13 | 15.69 | 15 | |
| East | 27 | 17.5 | 15 | |
| State | 61 | 15.73 | 15 | |
| Dryland Soybeans | 8 | 36.13 | (D) | |
| Dryland Wheat | ||||
| Northwest | 40 | 29.2 | 29.5 | |
| Southwest | 41 | 31.63 | 30 | |
| North-central | 38 | 36.53 | 35 | |
| East | - | - | - | |
| State | 123 | 32.54 | 31 | |
- Insufficient observations
(D) Median values that reflect less than 11 observations or single observations are excluded.
Figure 2a. Relative frequency of responses for dryland wheat cash rental rates, 2020.
Figure 2b. Relative frequency of responses for native hay cash rental rates, 2020.
Table 3. Crop share agreement statistics by region 2020-2021.
| Northwest | Southwest | North-central | East | State | |
|---|---|---|---|---|---|
| Acres in Lease | |||||
| Average | 179 | 370 | 327 | 76 | 256 |
| Median | 136 | 280 | (D) | (D) | 177 |
| Count | 14 | 16 | 10 | 8 | 48 |
| Years Lease Held | |||||
| Average | 13 | 18 | 6 | 8 | 12 |
| Median | 10 | 11 | (D) | (D) | 10 |
| Count | 14 | 16 | 10 | 7 | 47 |
Figure 3a. Relative frequency of sharecrop agreement statistics, 2020-2021.
Table 4. Relative frequency of crop share agreement statistics, 2020-2021.
| No. of Observations |
Average | Median | ||
|---|---|---|---|---|
| ———Tenant’s Share of Receipts (Percentage) ——— | ||||
| Dryland Wheat | 30 | 62 | 66 | |
| Grain Sorghum | 5 | 67 | (D) | |
| Cotton | 7 | 69 | (D) | |
| Soybeans | 7 | 67 | (D) | |
| ———Tenant’s Share of Expenses (Percentage)——— | ||||
| Crop | ||||
| Seed | 24 | 88 | 100 | |
| Fertilizer | 30 | 78 | 67 | |
| Herbicide | 27 | 78 | 84 | |
| Insecticide | 24 | 84 | 92 | |
| Chemical Application | 22 | 88 | 100 | |
| Hauling | 15 | 93 | 100 | |
| Harvest | 17 | 97 | 100 | |
| Lime Application | 13 | 89 | 100 | |
| Ginning | 7 | 61 | (D) | |
| Hay and Other | ||||
| Fertilizer | 5 | 57 | (D) | |
| Hauling | 5 | 62 | (D) | |
| Cutting | 13 | 70 | 100 | |
| Raking | 13 | 70 | 100 | |
| Baling | 14 | 69 | 88 | |
(D) Median values that reflect less than 11 observations or single observations are excluded.
Figure 4A, 4B & 4C. Relative frequency of responses for items in cropland share agreements, 2020-21.
Table 5. Average gross cash rent (dollars per acre) for cropland, selected states, 2011-2020
| State | Cropland | 2011 | 2012 | 2013 | 2014 | 2015 | 2016 | 2017 | 2018 | 2019 | 2020 |
|---|---|---|---|---|---|---|---|---|---|---|---|
| Oklahoma | |||||||||||
| Dryland | 28 | 31 | 32 | 32 | 32 | 30 | 31 | 32 | 32 | 32.5 | |
| Kansas | |||||||||||
| Dryland | 44 | 52.5 | 53 | 54 | 58 | 56 | 56 | 58 | 57 | 56 | |
| Irrigated | 105 | 119 | 137 | 126 | 124 | 129 | 128 | 131 | 128 | 129 | |
| Missouri | |||||||||||
| Dryland | 101 | 103 | 113 | 127 | 127 | 122 | 121 | 125 | 122 | 124 | |
| Texas | |||||||||||
| Dryland | 28 | 25 | 24 | 27 | 29 | 27 | 28 | 30 | 30 | 30 | |
| Irrigated | 77 | 79 | 82 | 87 | 82 | 90 | 87 | 90 | 92 | 95 | |
Source: USDA/NASS, Quick Stats, https://quickstats.nass.usda.gov.
Roger Sahs
Associate Extension Specialist


