Introduction to Groundwater Hydrology and Management
Most of the fresh water in the continental U.S. is groundwater, including approximately half of all water used in Oklahoma. According to the Oklahoma Water Resources Board (OWRB, 2014), Oklahoma contains more than 390 million acre-feet (AF) of groundwater. More than 80 percent of the total water used for crop irrigation is extracted from groundwater resources and this number could be above 90 percent in drier years. With such an important resource available to the state, the objective of this fact sheet is to review the fundamentals of groundwater flow and hydrology, and introduce key terms necessary for adequately understanding groundwater use and management. A key factor influencing groundwater retrieval and use is its value to the user. Investment in recovery, distribution and maintenance can range from minimal to relatively expensive. The economics of such investments will be elaborated upon in other fact sheets.
Aquifer and Aquifer Properties
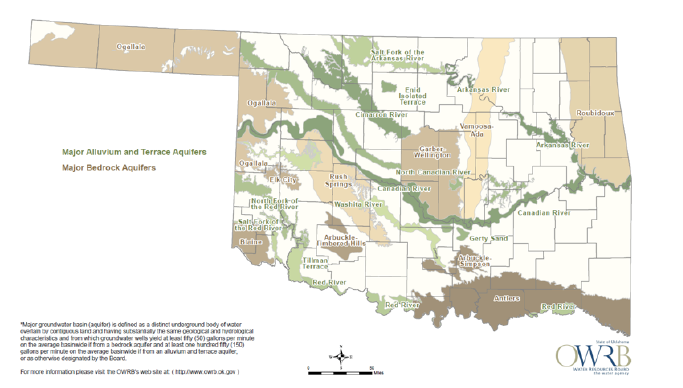
Aquifers are underground layers of permeable rock or unconsolidated material that contain water in the pore spaces. To be considered an aquifer, the layer must contain and transmit useable quantities to wells and/or springs. Oklahoma is underlain by 22 major groundwater aquifers (Figure 1).
Figure 1. Major groundwater aquifers in Oklahoma. Source: Mapping – OWRB (2014).
The exact depth at which the saturated zone occurs varies by location (spatially)
and through time (temporally). The depth to the saturated zone can vary from zero
at the soil surface to several hundred feet. In some areas, it is difficult to locate
the saturated zone because of rock formations or the extreme depths at which groundwater
is located. Typically, there is a region above the saturated zone that contains some
water in smaller pores, but larger pore spaces are not filled with water. The water
in this zone is typically not available for pumping because it generally is held more
tightly by the soil (under tension) and the practical yield is very low. However,
water can move through this unsaturated zone by gravity drainage and become part of
the saturated zone in a process called recharge.
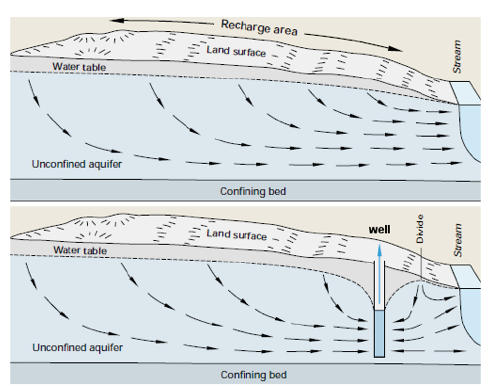
In general, there are three types of aquifers (see Figure 2): confined, unconfined and perched. A confined aquifer contains both an upper and lower confining layer. A confining layer is also sometimes called an aquitard and is a relatively water-restricting layer, preventing water from moving through it. In fact, the confining layer may be restrictive or only slightly restrictive. An example of a confined aquifer in Oklahoma includes the Garber-Wellington aquifer in central Oklahoma.
Figure 2. Depiction of typical confined and unconfined aquifers in a geologic formation.
Source: https://www.douglas.co.us/water/water-supply/ , Credit: Denver Basin Aquifers, Colorado Geological Society.
In a confined aquifer, water is held under pressure from recharge areas that may be
long distances away. Water levels can be checked using an observation well that penetrates
and is screened in a confined aquifer. The water level in an observation well will
rise because the water is held under pressure. The water level in this observation
well is referred to as the piezometric surface. If the piezometric surface rises to
a level above the ground surface, then a flowing artesian well is created, which discharges
water to the surface without the need for a groundwater pump (Figure 2).
An unconfined aquifer, also known as a water table aquifer, has a confining layer only at the bottom of the aquifer and the free water surface as its upper boundary. The water level in an observation well that penetrates and is screened in an unconfined aquifer rises to a level called the water table. For a water table aquifer, water being pumped actually comes from the pore spaces of the aquifer. In an unconfined aquifer, the thickness of the saturated zone decreases as the water table drops due to pumping or discharge. At a later time, as the water table rises, the thickness of the saturated zone may increase again due to recharge. In fact, this gives rise to an important distinction between confined and unconfined aquifers in that the saturated zone in an unconfined aquifer is variable.
Many unconfined aquifers are alluvium or terrace aquifers, meaning they were formed in alluvial deposits and interact closely with adjacent streams and rivers. Examples in Oklahoma include alluvium or terrace aquifers adjacent to the Cimarron, North Canadian and Arkansas rivers. A stream may be classified as “gaining” if water from the alluvial aquifer is discharging to the stream (Figure 3), “losing” if stream water is recharging the alluvial groundwater or “disconnected” when the groundwater table has dropped below the streambed. Groundwater pumping wells, especially those that are screened in alluvial aquifers and positioned near streams, not only extract water from the groundwater, but also deplete adjacent stream flow in what is called stream depletion (Fox et al., 2011; Fox, 2015).
Figure 3. Depiction of flow between an aquifer and stream and the cone of depression formed by a groundwater pumping well.
Source: Winter et al. (1998): US Geological Survey’s (USGS) Circular 1139 titled Ground
Water and Surface Water: A Single Resource, U.S. Department of the Interior.
A perched aquifer is an unconfined aquifer of limited aerial extent that retains water against gravity
because of an underlying restrictive layer, such as clay. Perched aquifers may be
seasonal or permanent.
Water movement in all types of aquifers is characterized through the hydraulic conductivity, which depends on the size, shape and connectivity of pores in the aquifer. Groundwater flow velocities are typically small (less than 1 foot per day), except near wells and springs, and almost always much smaller than stream velocities. However, groundwater flow in locations that contain limestone caverns or rock fractures may be very fast.
Well Hydraulics
Groundwater pumping wells can provide a range of available water flow rates, called the well yield. For example, many of the formations in western Oklahoma in the Ogallala or Rush Springs aquifers can provide as much as 250 to 1,000 gallons per minute. Average well yields in central Oklahoma aquifers are typically around 200 gallons per minute, and in eastern Oklahoma approximately 100 gallons per minute. Well yields can vary substantially even within an aquifer as a function of the aquifer’s saturated thickness, hydraulic conductivity, the extent of the well screen throughout the aquifer thickness and the efficiency of the pump.
As a well removes water from the aquifer, a drawdown or cone of depression is formed (Figure 3), where drawdown is the difference between the initial height of the piezometric surface in a confined aquifer or water table in an unconfined aquifer and the height of the piezometric surface or water table at a certain location around the well (Winter et al., 1998). Pumping a groundwater well may influence nearby wells in what is called “pumping influence.” In Oklahoma, groundwater permits only consider pumping influence in basins, where the maximum annual yield (MAY) has been determined. The pumping influence depends on numerous factors, such as the distance between the pumping wells, the well characteristics (depth of the well and screened section), aquifer properties and pumping rates (Figure 3). Equations are available for determining influence.
Groundwater Recharge
Groundwater becomes surface water when it emerges as a spring or seep or when it directly enters a stream, pond or lake. Groundwater discharge to streams, springs and seeps generally forms the baseflow for many streams between precipitation events. The pathway taken by water, as it infiltrates and percolates to recharge the saturated zone and emerge as baseflow to become surface water, has a major impact on the quality of the water. The interchange between groundwater, water stored in the soil profile and surface water points to the need to consider the integration of the hydrologic system (Winter et al., 1998).
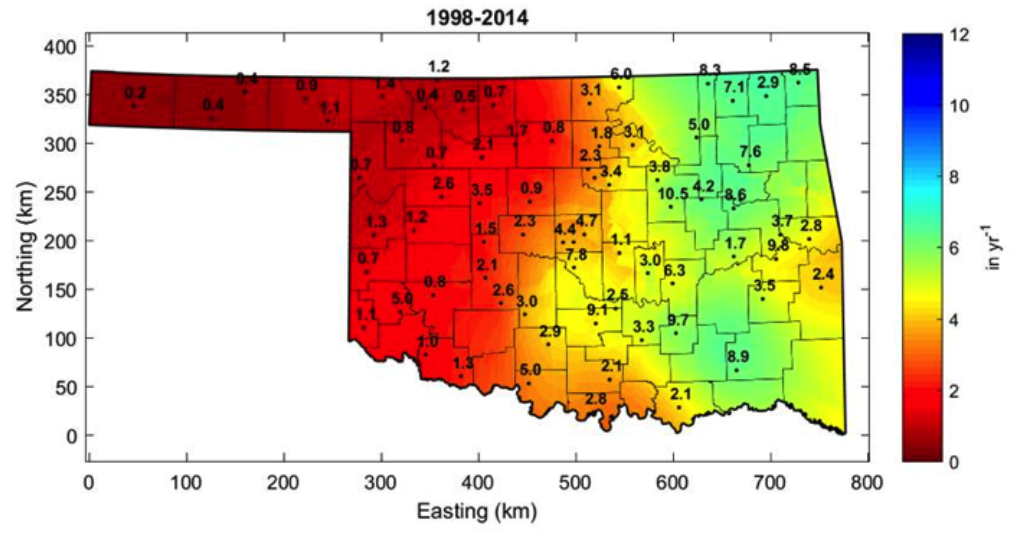
Natural recharge occurs as a result of the natural movement of water through the hydrological cycle. In Oklahoma, (Ochsner et al. 2014) shallow recharge rates range between 0.2 and 10 inches per year (Figure 4). Recharge rates to deeper groundwater are expected to be smaller. As a result, there has been considerable interest in the concept of providing artificial recharge to increase groundwater supplies and provide storm water control by reducing surface runoff. Artificial recharge occurs when water is added to the groundwater reservoir that would not have naturally reached the reservoir. Artificial recharge can result from recharge basins, artificial impoundments, recharge wells, applying water to the land surface through irrigation, waste disposal and other means. Aquifer storage and recovery (ASR) is artificial recharge into groundwater aquifers with the goal of later extracting the recharged water. Care must be taken to ensure artificial recharge or ASR does not pollute the aquifer.
Figure 4. Statewide mean annual soil moisture-based drainage rates for the years 1998-2014 in inches per year. Drainage rate labels for the Stillwater, Oklahoma City East, Porter, and Marena sites were excluded for clarity, but were 8.4, 3.2, 6.5, and 2.6 in yr-1, respectively.
Source: Ochsner et al. (2014)
When water tables exhibit long-term declines, this is commonly referred to as “mining
the resource.” This is not a trivial point with respect to the economics of recovery.
When water tables are relatively stable, normal maintenance and upgrading of the infrastructure
is the primary expense to consider (assuming no quality degradation). However, when
water tables decline steadily over time, managers must make new decisions on the efficiency
and net benefits of drilling deeper and investing in more expensive infrastructure.
The decision to drill deeper or add additional wells because ‘that’s where the water
is’ may be a fast path to economic losses. Also, basing decisions on outlays that
may be very expensive up front in return for anticipated gain at a later time requires
careful consideration of the associated markets. For example, a decision to drill
a new well or dig deeper to provide water for agriculture or the oil and gas industry
needs to consider the likely future downturns in those markets.
Groundwater Law
In Oklahoma, groundwater rights are private property rights: landowners or lessees can obtain a permit for uses other than domestic use (which does not require a permit), to use groundwater based on the number of acres that overly a groundwater basin, typically and by default 2.0 AF per acre of land each year (Fox, 2015). Sometimes this amount is adjusted to an equal proportionate share (EPS) when a study has indicated a specific water volume for a minimum 20-year basin life. For example, in 2014, the EPS was reduced by OWRB from 2.0 to 0.2 AF per acre per year in the Arbuckle-Simpson aquifer. More than 4.7 million acre-feet of groundwater were used in Oklahoma through permits in 2014, and about 2 percent of that water was used by the oil and gas activity. Most of that oil and natural gas water use occurred in the central and western parts of Oklahoma (Peek et al., 2016). In general, groundwater pumping is not metered in Oklahoma. The groundwater policy in Oklahoma authorizes the OWRB to require meters be placed on pumping wells to monitor extraction rates, but only in cases where a majority of the landowners request the meter.
Conclusions
Groundwater is currently and will continue to be a critical resource for the state of Oklahoma. It is important research continues to assess the current and future status of our groundwater resources. Appropriate policy decisions regarding groundwater use and management can only occur when supported by sound, scientific information regarding our groundwater supplies.
References
Fox, G.A., D.M. Heeren, and M.A. Kizer. 2011. Evaluation of a stream-aquifer analysis test for deriving reach-scale streambed conductance. Transactions of the ASABE 54(2): 473-479.
Fox, G.A. 2015. Groundwater in Oklahoma. Video series part of the Foundations of Oklahoma Water Video Series, https://www.youtube.com/watch?v=iSkQSbclEos&index=3&list=PLZ9mRgbbuBUg36cd-em7-Oeq9jwofNzsD. Accessed March 3, 2016.
Ochsner, T., C. Friebrich, and C. Neel. 2014. Estimating groundwater recharge using the Oklahoma Mesonet. Interim Study Report on http://water.okstate.edu, Accessed November 9, 2015.
Oklahoma Water Resources Board (OWRB). 2014. http://www.owrb.ok.gov/util/waterfact.php. Accessed November 9, 2015.
Peek, G., L.D. Sanders, D. Shideler, T. Halihan, S. Ferrell, C. Penn. Forthcoming 2016. Evaluating the Impacts of Oil and Gas Activity: Hydraulic Fracturing in Selected Oklahoma Counties”, Oklahoma Cooperative Extension Service Circular E-1041.
Winter, T.C., J.W. Harvey, O.L. Franke, and W.M. Alley. 1998. Ground water and surface water: A single resource. U.S. Geological Survey Circular 1139, U.S. Geological Survey: Denver, CO.
Garey A. Fox
Professor and Buchanan Endowed Chair, Director and Thomas Berry Endowed Professor of Oklahoma Water Resources Center
Saleh Taghvaeian
Assistant Professor and Extension Specialist
Biosystems and Agricultural Engineering
Larry Sanders
Professor and Extension Specialist
Agricultural Economics


