Impact of Child Nutrition Programs Offered in Schools on Daily Nutrition and Dietary Quality
Dietary Quality
Dietary Quality is a way of seeing how healthy a diet is compared to government and
scientific suggestions. A popular DQ scoring tool is the Healthy Eating Index. A HEI
score of 100 means that the diet fully meets diet suggestions (Food and Nutrition
Service U.S. Department of Agriculture [USDA], 2022c).A national report found that
the average HEI score for children (ages 2-17) is 54 out of 100. This means that children’s
diets are far from what is suggested (USDA, 2022c). Child Nutrition Programs may offer
a solution.
Child Nutrition Programs
CNPs are food assistance programs offered by the USDA (USDA, 2022a). There are 9 total. These voluntary programs provide meals to students during the school year and summer. Schools can participate in 4 of the CNPs regularly and all at once each school day:
- School Breakfast Program
- National School Lunch Program
- Fresh Fruit and Vegetable Program
- Afterschool Snack Program (USDA, 2022a)
Child Nutrition Program's Possible Impact on Dietary Quality
Many children in the United States eat 2 to 3 meals each day at school during the school year. For example, in 2019, 28% of children ate breakfast at school and 55% ate lunch at school (Kids Count Data Center: The Annie E. Casey Foundation, 2021; USDA, 2022b). For that reason, CNPs likely have a large influence on DQ. If schools serve meals through all 4 CNPs, they can increase the nutrition provided to and the DQ scores of the children they serve (Simmons et al., 2022).
The Data
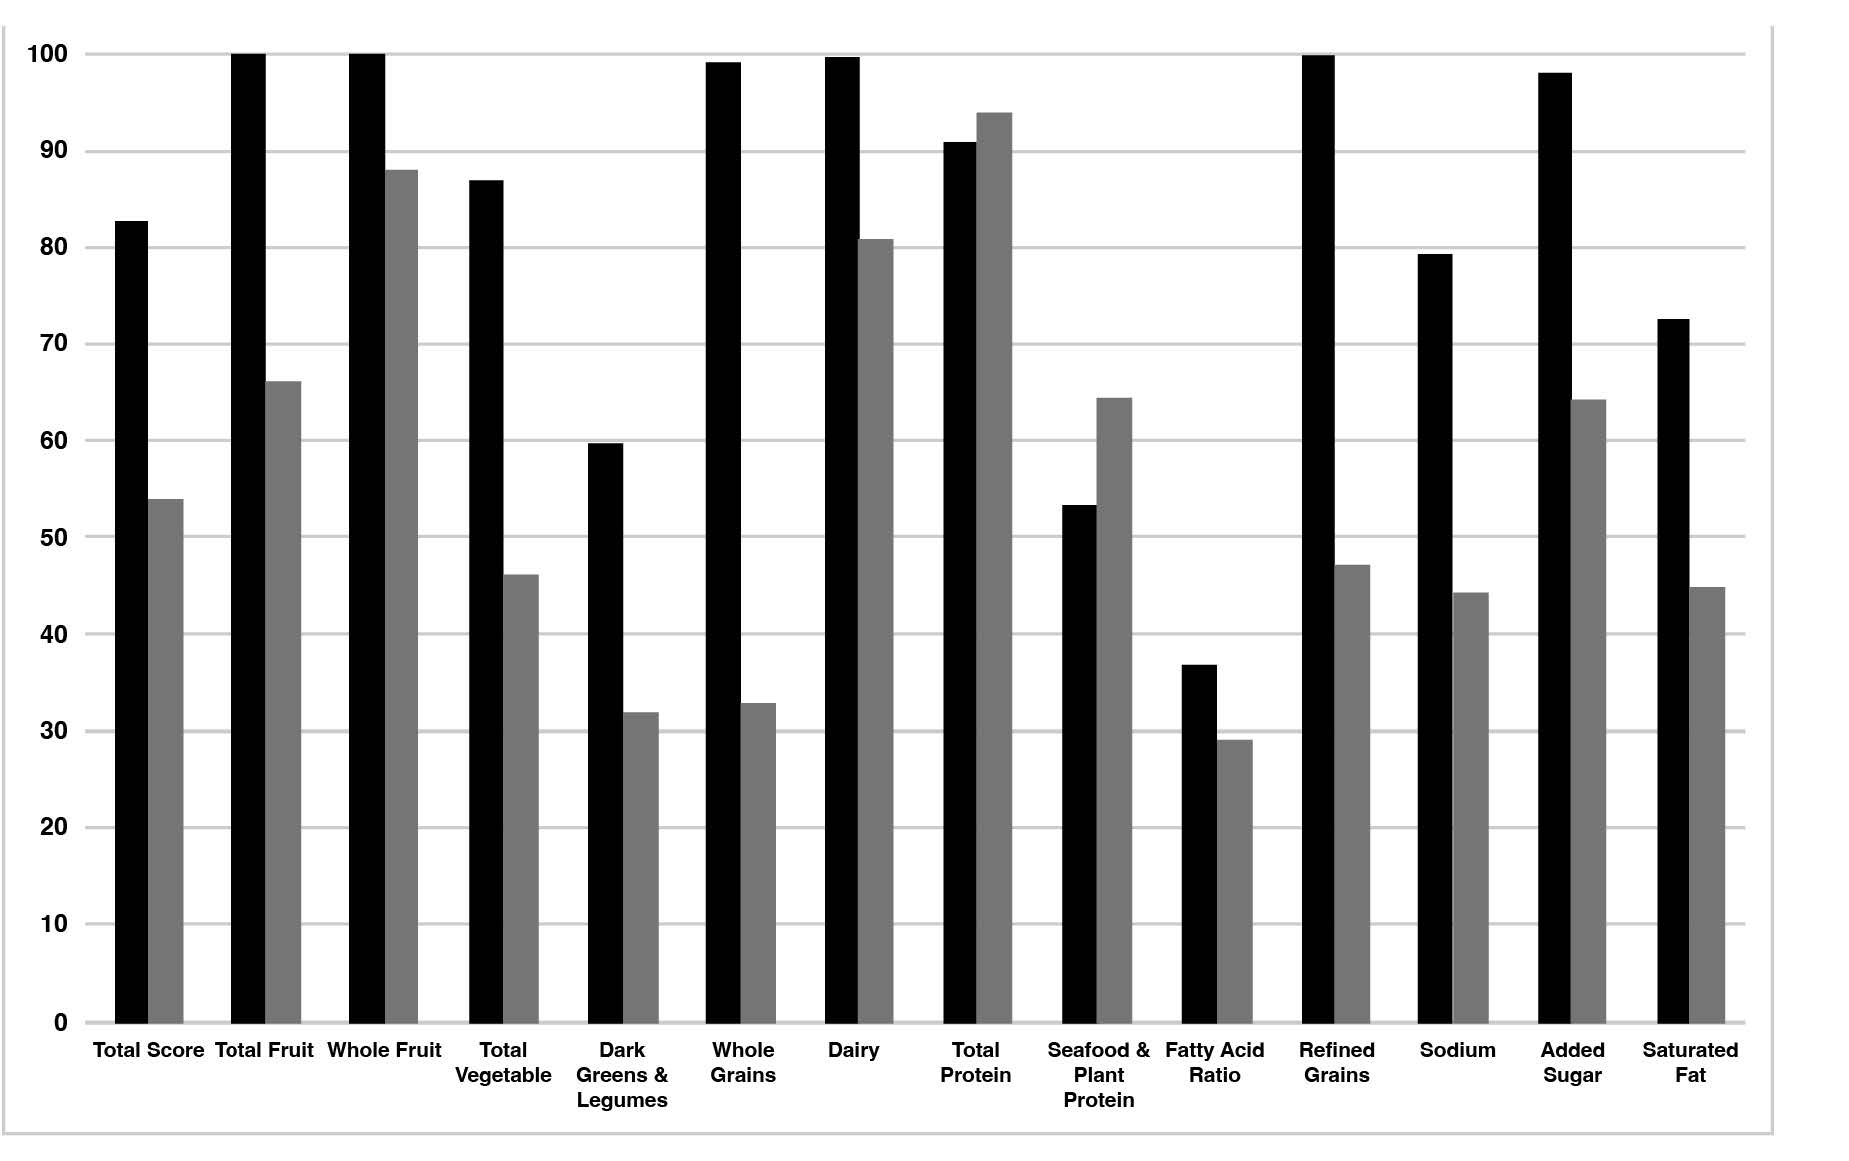
A study looked at the nutrient content and DQ of combined CNP menus that included the School Breakfast Program, National School Lunch Program, Fresh Fruit and Vegetable Program and the Afterschool Snack Program (Simmons et al., 2022). The menus were portioned following CNP meal patterns for elementary-aged children for 20 school days. The menus had a HEI score of 83.3 out of 100. This is important because the score is higher than the score of the average U.S. child’s diet. This higher score was due to increased whole grains and dairy and less added sugar. The combined menus also met an average of 124% of daily child nutrient needs (Simmons et al., 2022). Figure 1 (page 2) compares HEI scores of the combined menus, in black, to the average diet of U.S. children, in gray. This information is presented as the % of the maximum score possible. Higher scores for HEI items 2-10 reflect higher intakes. This is because higher intakes of these items are more favorable. Higher scores for HEI items 11-14 reflect lower intakes. This is because lower intakes of these items are more favorable.
Why is Nutrition and Dietary Quality Important?
Research supports that improving nutrition and DQ scores directly and positively impact children's health, academic per-formance and their futures (Dahm et al., 2016; Golley et al., 2010; Perry et al., 2015). It has been found that:
- Lower DQ is associated with higher prevalence of child overweight (Perry et al., 2015)
- School lunches with higher DQ can increase child classroom alertness (Golley et al., 2010)
- High DQ in adolescence can decrease risk of chronic disease later in life (Dahm et al., 2016)
Next Steps
Data shows the impact that DQ has in childhood and that the average diets of children are far from what is sug-gested (Dahm et al., 2016; Golley et al., 2010; Perry et al., 2015; USDA, 2022c). CNPs may offer a solution. Some ideas on how to improve child DQ through CNPs can be found in Figure 2 (Page 2).
Figure 1. Comparison of HEI scores of the combined menus to the average diet of U.S. children.
Figure 2. Possible solutions to increasing child DQ for school nutrition professionals, administrators and parents.
References
Dahm, C. C., Chomistek, A. K., Jakobsen, M. U., Muka-mal, K. J., Eliassen, A. H., Sesso, H. D., Overvad, K., Willett, W. C., Rimm, E. B., & Chiuve, S. E. (2016). Adolescent diet quality and cardiovascular disease risk factors and incident cardiovascular disease in middle-aged women.Journal of American Heart Association, 5(12).
Food and Nutrition Service U.S. Department of Agriculture. (2022a). Child nutrition programs.
Food and Nutrition Service U.S. Department of Agriculture. (2022b). Child nutrition tables.
Food and Nutrition Service U.S. Department of Agriculture. (2022c). HEI scores for Americans.
Golley, R., Baines, E., Bassett, P., Wood, L., Pearce, J., & Nelson, M. (2010). School lunch and learning behaviour in primary schools: An intervention study. European Journal of Clinical Nutrition, 64, 1280-1288.
Kids Count Data Center: The Annie E. Casey Foundation. (2021, September). Child population by age group in the United States.
Perry, C., Keane, E., Layte, R., Fitzgerald, A., Perry, I., & Harrington, J. (2015). The use of a dietary quality score as a predictor of childhood overweight and obesity. BMC Public Health, 15(581).
Simmons, M., Hildebrand, D., & Joyce, J. (2022). Impact of Child Nutrition Programs offered in schools on daily nutrition and dietary quality.Journal of Child Nutrition & Management, 46(1).


