

Differences in Feedlot Profitability Between Angus Cattle and Wagyu-Angus Cross Cattle
Introduction
Wagyu beef is popular with U.S. consumers for its dense marbling, tenderness and unique flavor, as well as its high levels of healthy fats believed to reduce the risk of heart disease. Wagyu beef commands higher prices than beef from traditional U.S. breeds, giving cow-calf producers and small to mid-sized feedlots incentives to enter this growing market. U.S. producers wanting to sell Wagyu-branded beef must have cattle that meet the USDA Agricultural Marketing Service’s (USDA-AMS) program specifications at one of three levels: Wagyu fullblood (100% Wagyu), Wagyu purebred (93.75% minimum Wagyu), or American Wagyu (46.875% minimum Wagyu, i.e., an F1 cross). However, Wagyu-cross cattle with less than the American Wagyu standard still tend to grade USDA Prime at higher rates than traditional breeds (Radunz et al., 2009), increasing the probability of carcass quality premiums.
Cattle producers considering incorporating Wagyu genetics into production or feeding systems need to consider both the revenue and cost sides of the profit equation. Wagyu cattle typically have lower average daily gains (ADG) and longer days on feed (DOF) to reach slaughter weight compared to English and Continental breeds. As a result, feedlot cost of gain (COG) is higher for Wagyu and Wagyu-influenced calves, though crossbreeding Wagyu with high-performance breeds has resulted in better growth and efficiency relative to Wagyu and improved carcass characteristics relative to traditional U.S. breeds. From a cattle feeding perspective, producers should ask: 1) Does the added revenue from Wagyu-influenced carcasses offset the added production cost, and 2) how do fed cattle returns compare between Wagyu-influenced cattle returns and fed cattle returns to traditional breeds?
Data
Baxter et al (2024) used data on 15,137 cattle from a mid-sized Midwest cow-calf/feeder operation to compare the feedlot profitability of Angus cattle and Wagyu-Angus crossbred cattle with different degrees of Wagyu influence. The data included sex, receiving weight, slaughter weight, receiving and slaughter dates, ADG, sale price per head, feed ration and cost and breed composition. Breed composition included purebred Angus, 12.5% Wagyu, 25% Wagyu, and 50% Wagyu, labeled in this study as Angus, W12.5, W25, and W50, respectively. Data included feedlot cattle from 2012 to 2020. Summary statistics for the data can be found in Baxter et al. (2024). Since the calves were moved from the operation’s cow-calf enterprise directly into their own feedlot, USDA-AMS feeder cattle price reports from a nearby market were used to assign an incoming price for calves based on their feedlot entry date and weight. Feedlot net returns (NR) per head were calculated as sale price (SP) minus calf value when transferred to the feedlot (TP), feed cost during the calf’s feeding period (FC) and yardage cost (YC), which represents the feedlot’s non-feed costs per head, such as labor, health inputs and feedlot overhead. Yardage cost is typically assessed as a daily charge, so it will vary according to DOF for a specific animal, as does feed cost. Since the data span multiple years, cattle prices and feed costs were adjusted to 2022 values to ensure consistent comparisons of real value across those years. Additional details on pricing, cost calculations and adjustments are reported in Baxter et al. (2024).
Average feedlot start weight was 598 pounds, and harvest weights averaged 1,386 pounds. As in other studies, ADG and DOF vary across breed composition. Figure 1 shows that the average ADG is highest for Angus cattle at approximately 3.5 pounds and is also the least variable among Wagyu crossbred cattle. ADGs for W12.5 and W25 cattle are similar at 3.2 pounds and 3.1 pounds, respectively. W50 cattle have the lowest ADG at approximately 2.75 pounds and have the highest variability in ADG.
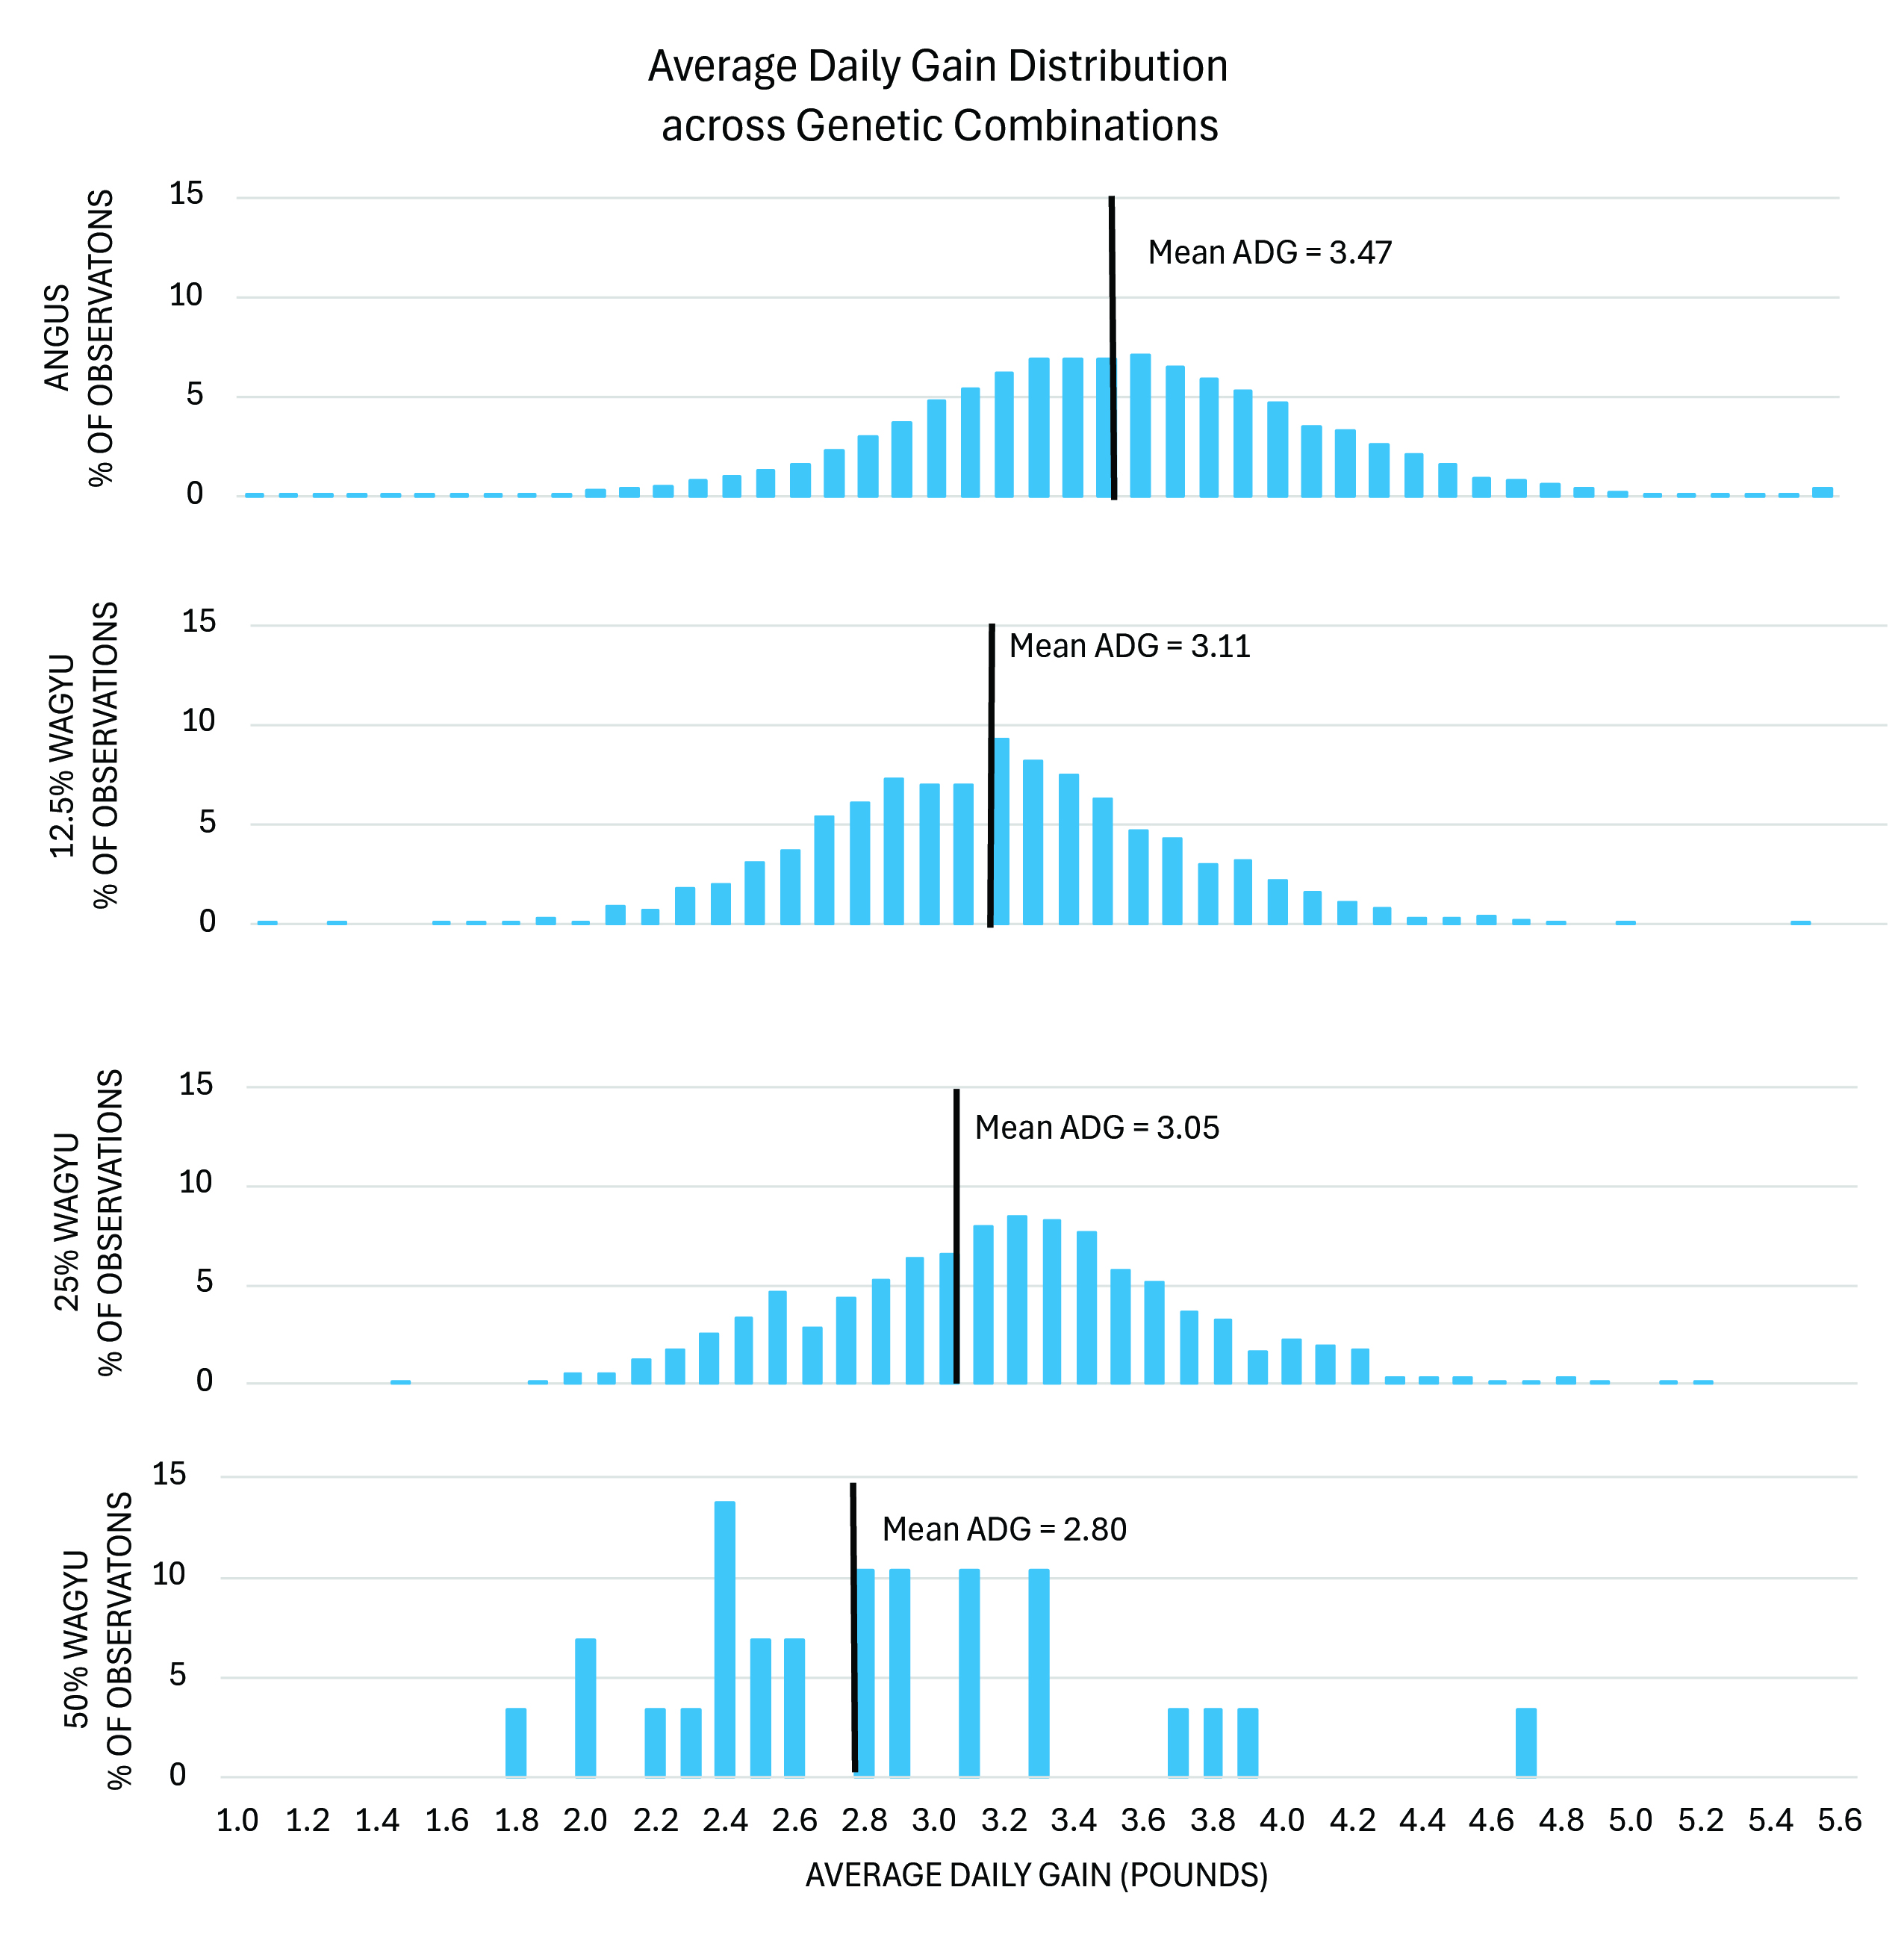 Figure 1. Average daily gain (lbs) distribution across breed composition.
As expected, Angus cattle had the lowest average DOF at 230 days as well as the lowest variability in DOF across cattle. Average DOF for Wagyu-influenced cattle ranged from 287 days for W25 cattle to 263 days for W12.5’s, with W50 cattle averaging 276 DOF. Variability in DOF is highest for W50 and W12.5 cattle.
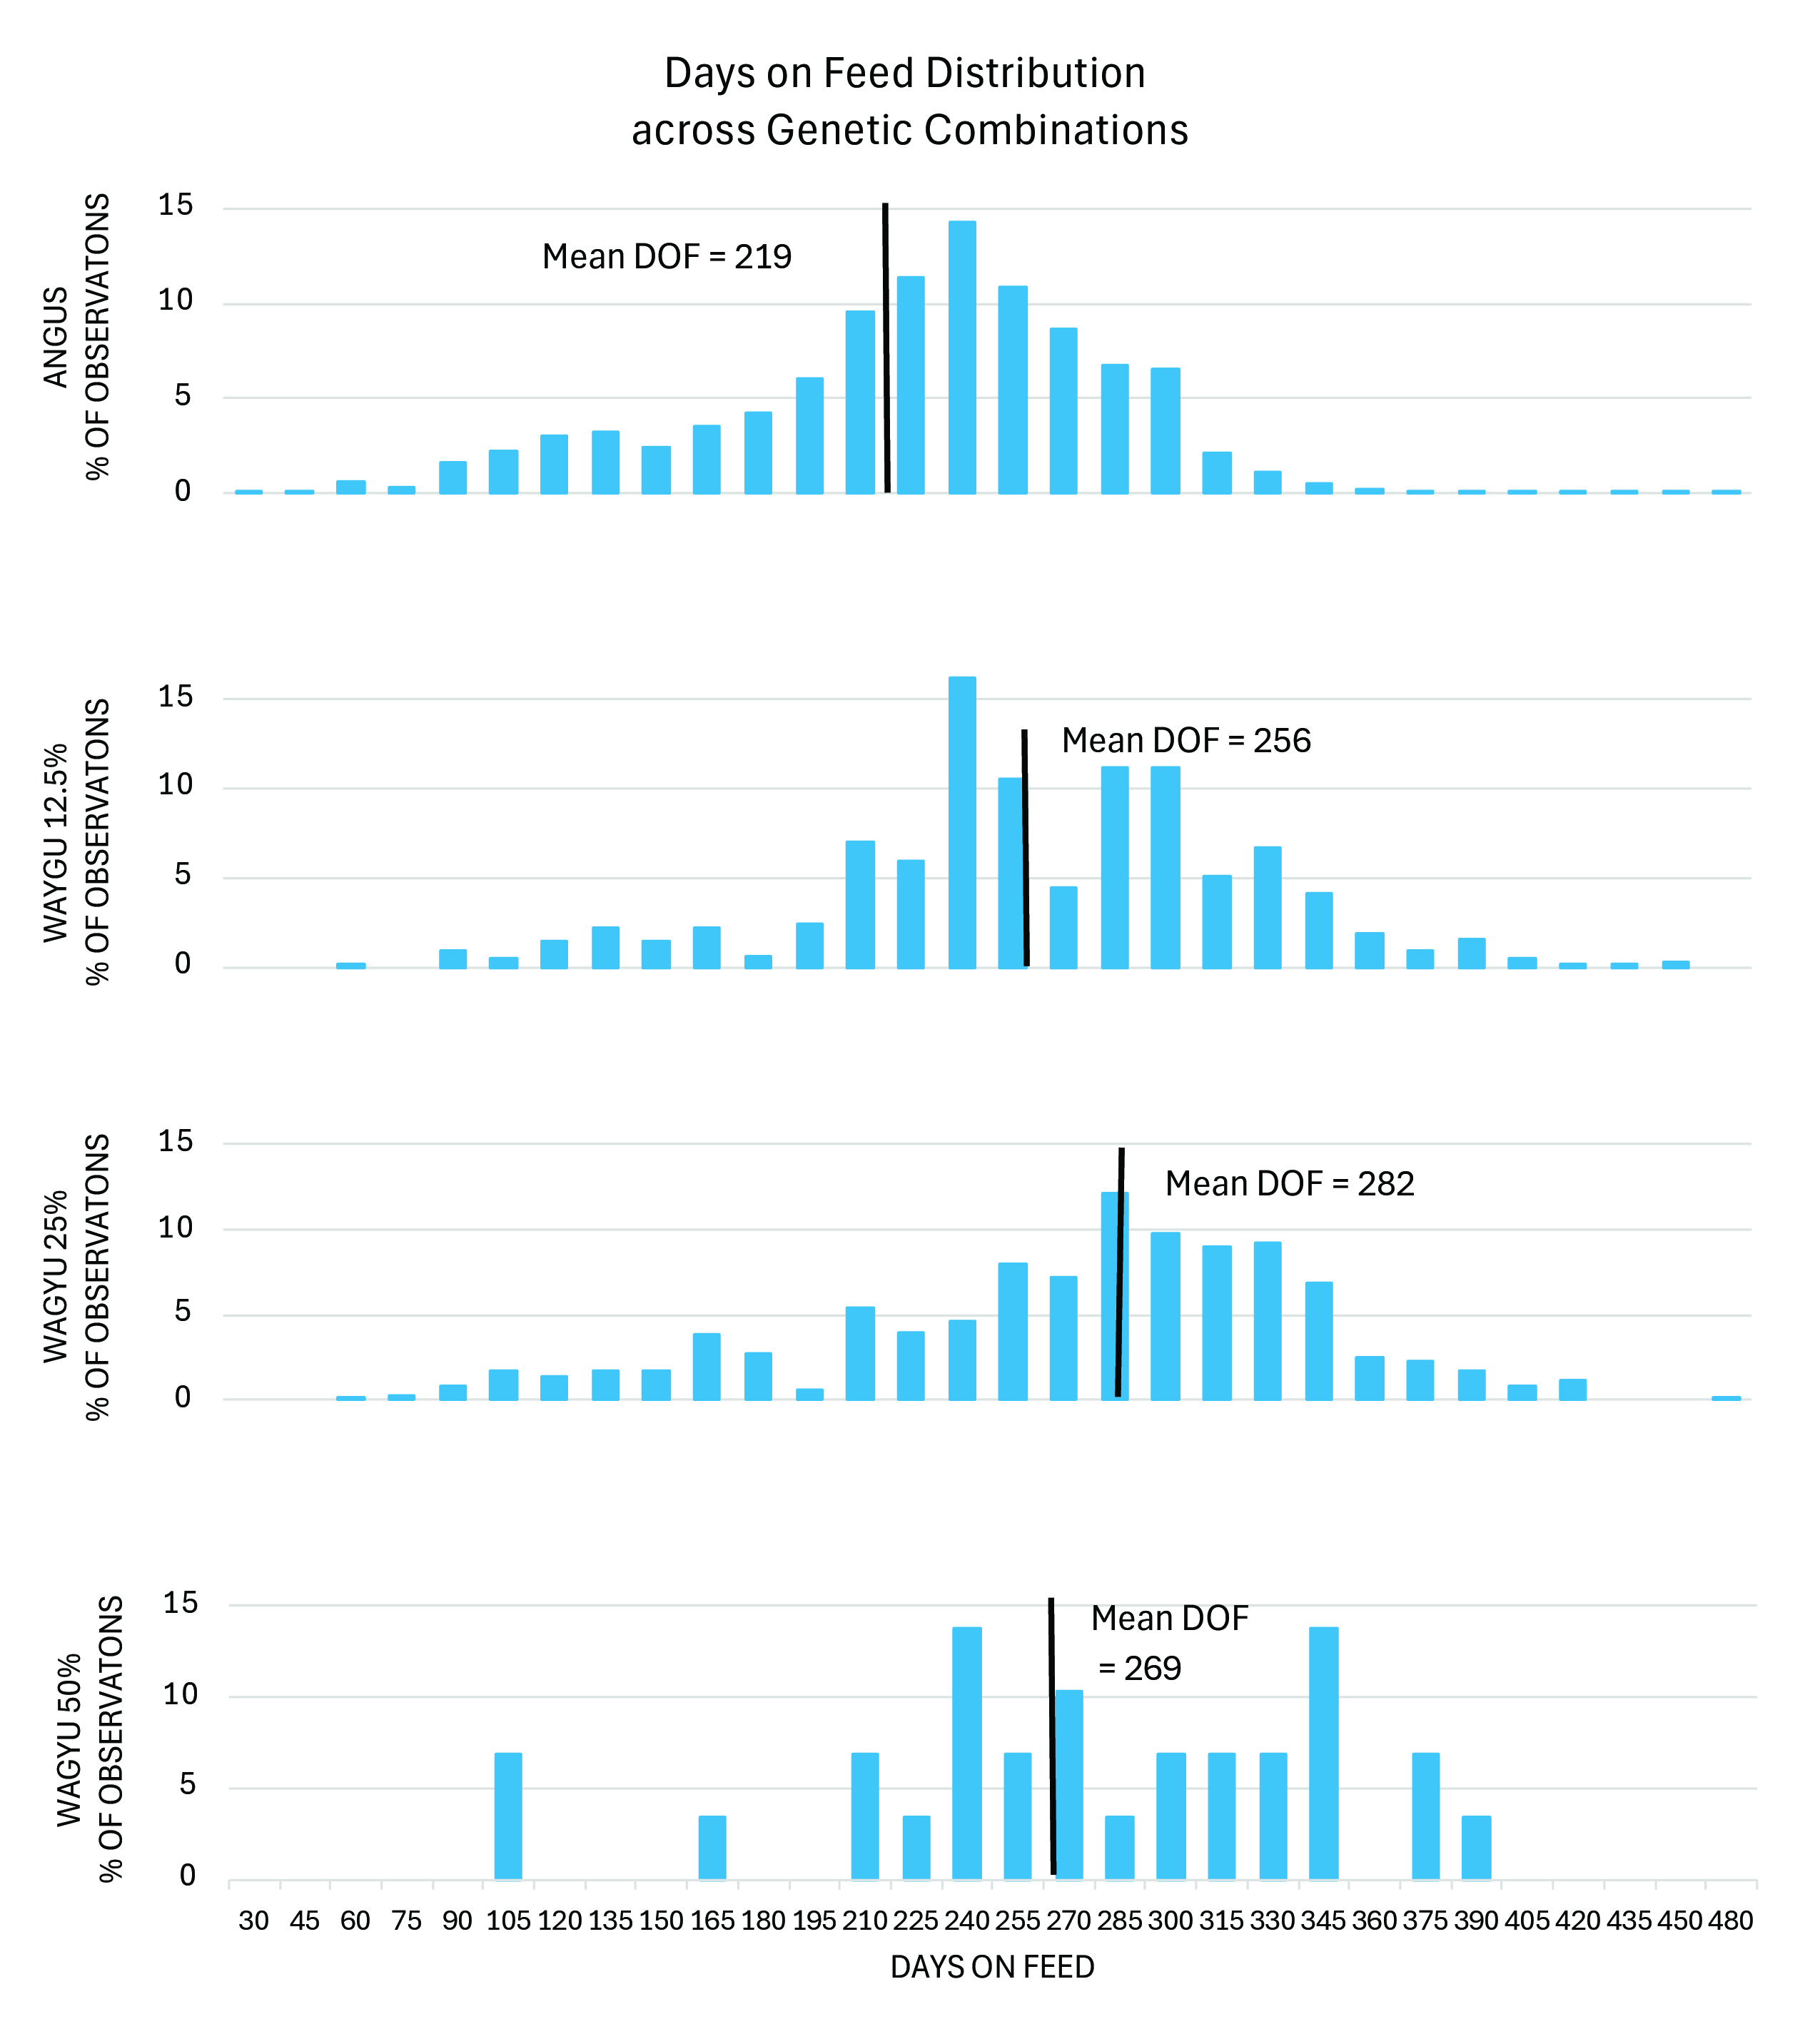 Figure 2. Days on feed distribution across breed composition.
Since the impact of Wagyu genetics on carcass quality is of interest, given its positive influence on price received by both cow-calf producers and feedlots, the percentage of cattle grading USDA Prime was calculated by breed composition and reported in Figure 3. Similar to Radunz et al. (2009), the percentage of carcasses grading USDA Prime increases as the Wagyu percentage of breed composition increases. This is relevant information for producers considering incorporating Wagyu genetics to increase carcass quality potential and market value of their calf crops, as well as for feedlots considering purchases of Wagyu-influenced cattle. In fact, this feedlot’s stated goal for the incorporation of Wagyu genetics was to increase the percentage of fed cattle that grade USDA Prime at slaughter.
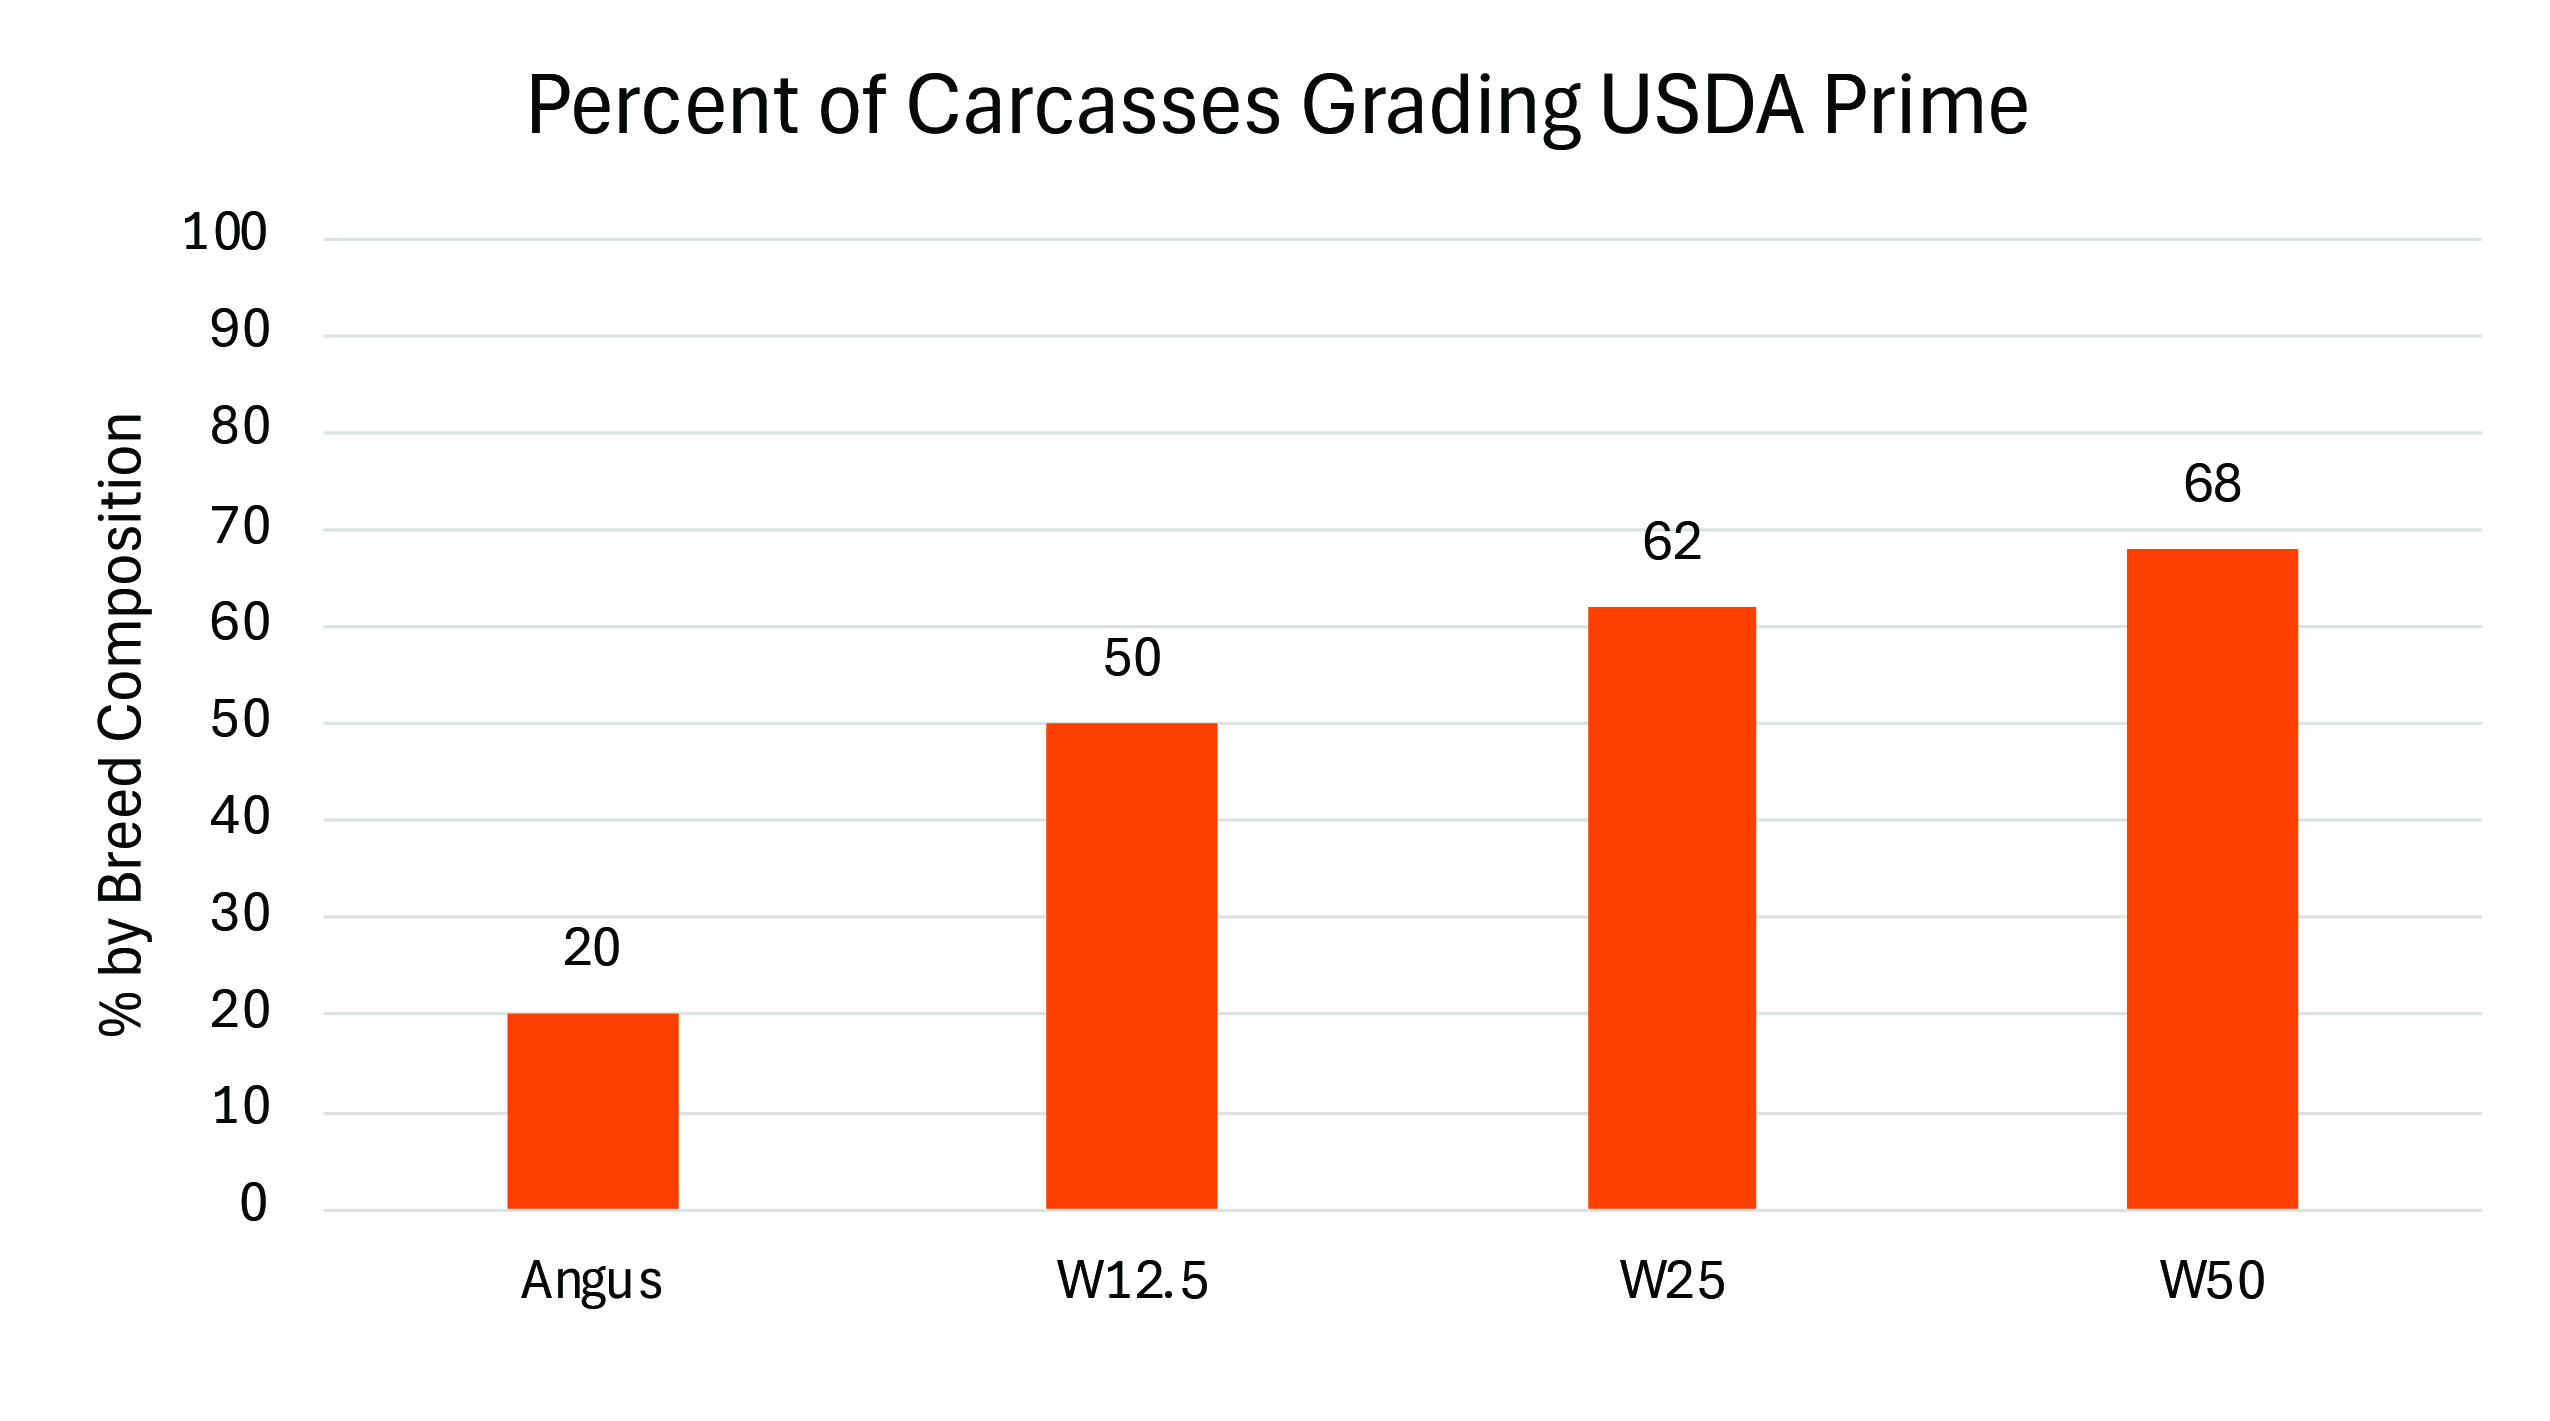 Figure 3. Percent of carcasses grading USDA Prime by Angus-Wagyu composition
Results
Within a genetic composition category, differences among all cattle, steers and heifers are relatively small, as indicated by the maximum difference between average net returns in Figure 4 below.
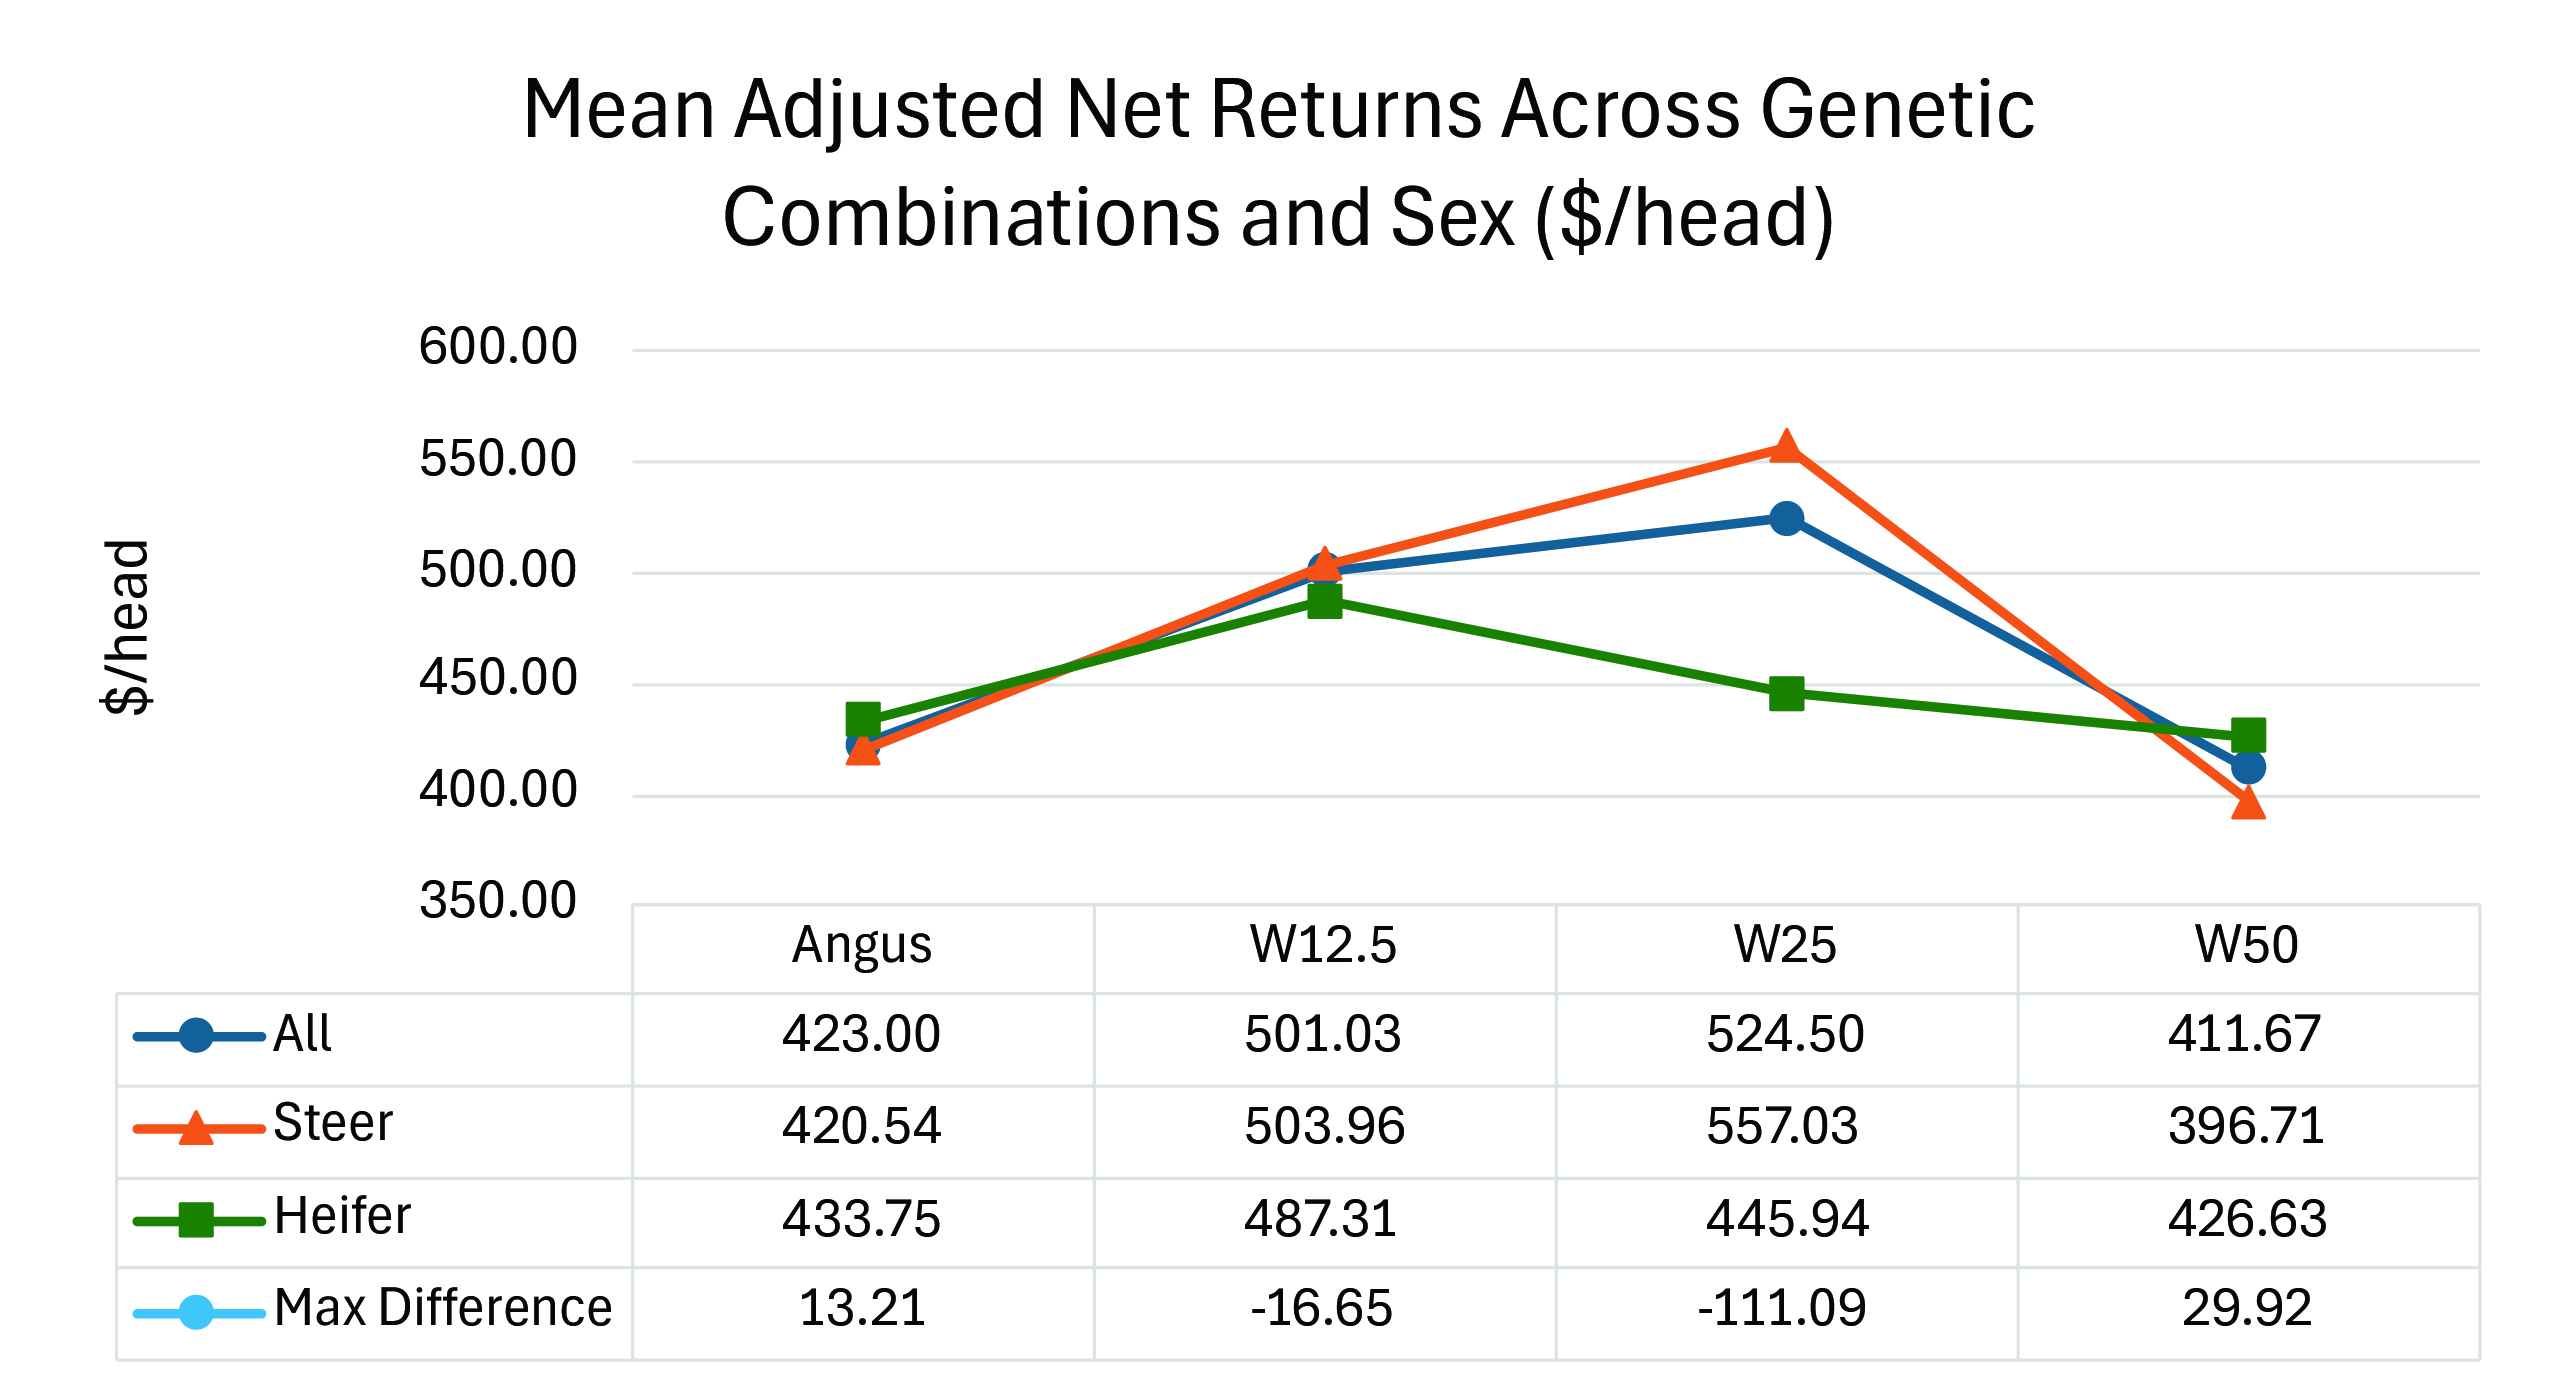 Figure 4. Average net returns across genetic composition and sex.
The exception is W25 cattle, which exhibit a significantly larger range of average net returns than the other genetic composition categories, with heifers having the lowest, a difference of $111.09 per head compared to steers. When steers and heifers are combined into an all cattle category, average net returns indicate that W25 cattle had the highest average net returns, followed by W12.5, Angus and W50 cattle in that order. Steers follow the same pattern. However, the pattern is slightly different when heifers are considered alone, with W12.5 heifers averaging higher returns than W25 heifers.
Figure 4 shows mathematical averages; to assess whether average net returns in a category differ statistically when compared pair by pair, we use Tukey’s pairwise test. For the all cattle category, W25 cattle average returns are statistically higher than those of Angus and W50 cattle, but there is no statistical difference between average returns for W25 and W12.5 cattle. For steers, average net returns for W25 steers were statistically higher than all other genetic categories. Finally, for heifers, test results indicate that the only statistically significant difference in averages is between W12.5 and Angus heifers.
Overall, lower-percentage Wagyu cattle had good carcass merit without extended DOF, resulting in higher average returns than W50 and Angus cattle. The W25 genetic combination dominates average returns for All Cattle and Steers, while there is little statistically significant difference in Heifer returns across genetic combinations.
The feedlot data contained a wide range of feedlot start weights, which impacts net returns. Figure 5 illustrates differences in average net returns across breed compositions and start weights.
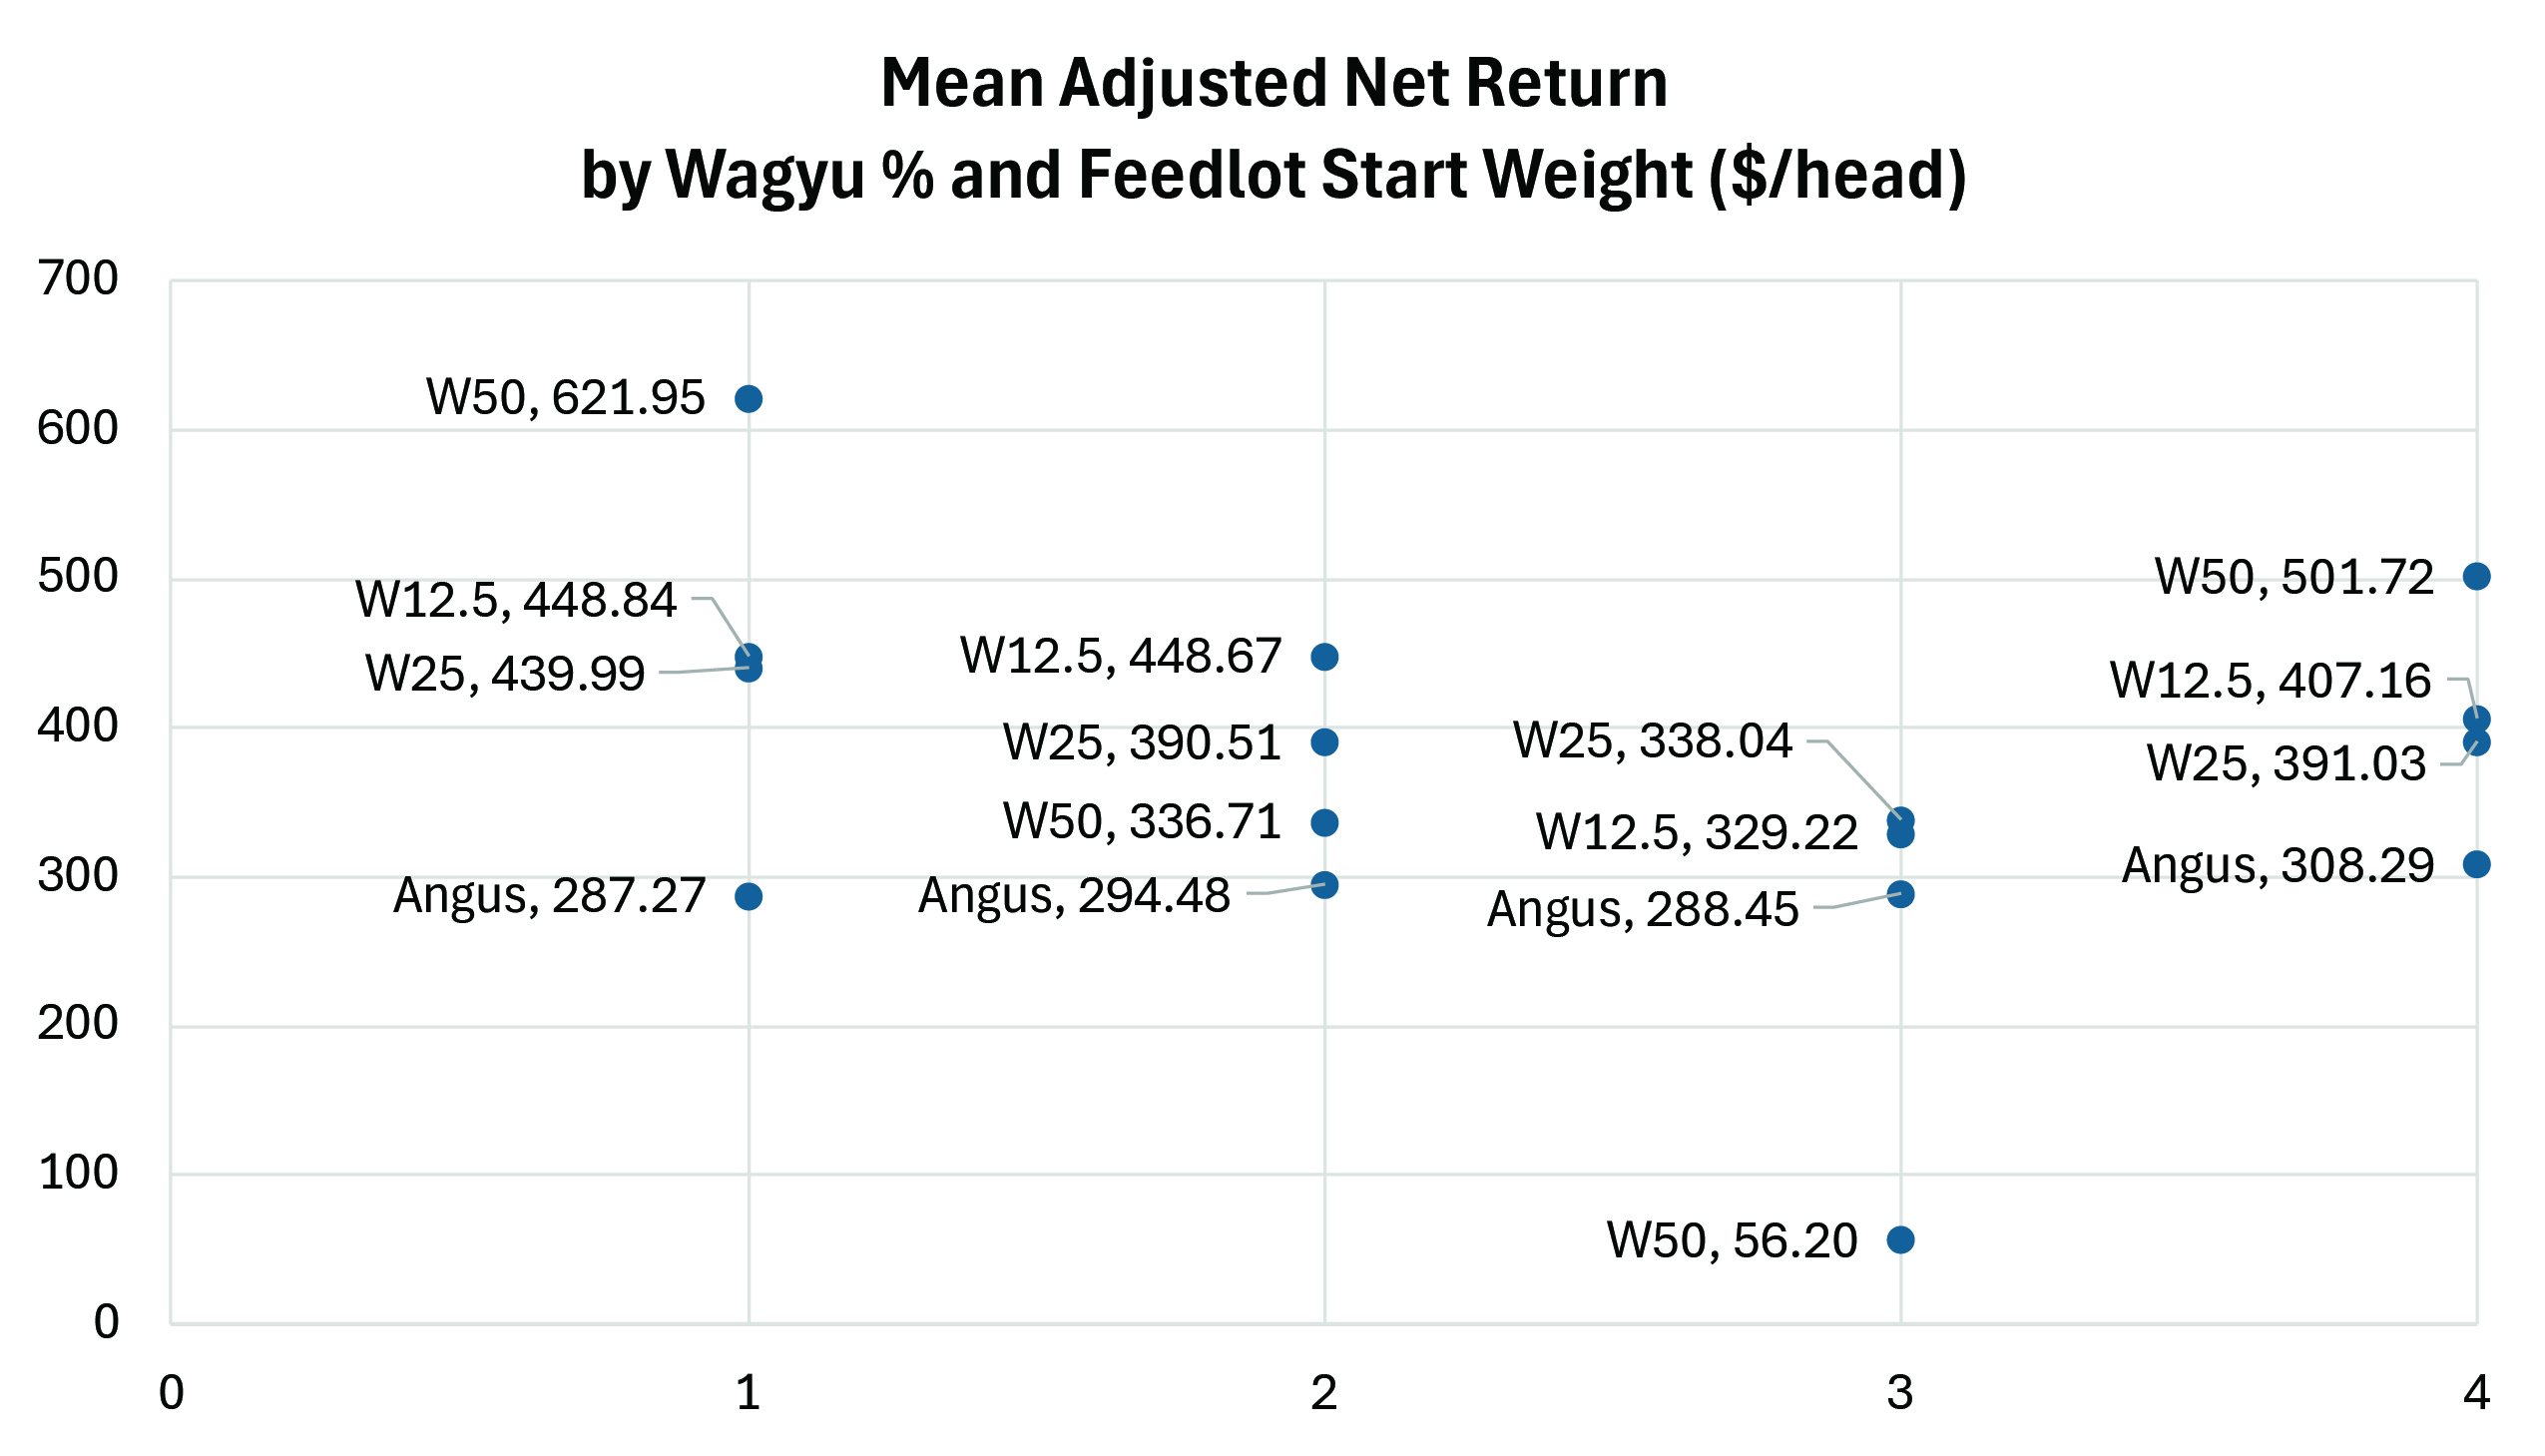 Figure 5. Average adjusted net return by Wagyu % and feedlot start weight. Note: 1=Lights (200 – 499 pounds); 2=Medium-Lights (500 – 699 pounds); 3=Mediums (700 – 899 pounds); and 4=Heavys (900 – 1,299 pounds).
First, average net returns exhibit a wider range across genetic combinations for cattle placed as Lights than for other start weights. Note that since the relatively few W50 cattle are now further divided across four weight categories, our confidence in the statistical reliability of W50 averages here is low, and they are included here for interest only. Except for W50 cattle in the Medium start weight category, Angus cattle exhibit the lowest average adjusted net returns in every weight category but still have strongly positive returns. Angus average returns as a group are statistically different from all Wagyu-influenced groups, including W12.5 (p=0.016), W25 (p=0.038) and W50 (p=0.0002). The same is true for W50 cattle as compared to other Wagyu-influenced categories of W12.5 (p=0.038) and W25 (p=0.015). W50 cattle exhibit the lowest average net returns when in the Medium start weight category, which interestingly represents a weight class where a high proportion of feeder cattle enter the feedlot. Statistically, F-tests indicate that W12.5 and W25 means are not different from each other across feedlot start weights (p=0.631). Note that the feedlot’s annual capacity and the impact of DOF on turnover rate are not considered in the evaluation of net returns here.
Conclusion
Wagyu-influenced cattle earn premiums due to carcass merit and niche marketing opportunities. However, Wagyu cattle gain more slowly than traditional beef breeds, including Angus, setting up an economic tradeoff. Results from Baxter et al. (2024) indicate that low-percentage (12.5% and 25%) Wagyu steers have higher feedlot returns than higher percentage (50%) Wagyu steers and Angus steers. Few differences in returns were found for heifers. Crossbreeding Wagyu with Angus can result in higher value carcasses with only slightly increased feed costs, but that advantage disappears with a higher percentage Wagyu influence, as relative efficiency decreases. While Wagyu-influenced cattle of over 50% Wagyu can potentially be marketed as American Wagyu to garner additional premiums, these results suggest that without the niche marketing advantage, cattle of lower Wagyu percentages generate relatively higher feedlot returns due to higher rates of USDA Prime carcasses and increased efficiency.
References
Baxter, G.A., K.C. Raper, D.S. Peel, and E.A. DeVuyst. 2024. “Feedlot Profitability in Wagyu-influenced Cattle,” Western Economic Forum 22(1). Available at: https://waeaonline.org/western-economics-forum/.
Radunz, A.E., S.C. Loerch, G.D. Lowe, F.L. Fluharty, and H.N. Zerby. 2009. “Effect of Wagyu-versus Angus-sired Calves on Feedlot Performance, Carcass Characteristics, and Tenderness.” Journal of Animal Science 87(9): 2971-2976.
United States Department of Agriculture, Agricultural Marketing Service. “Live Animal Specification American Wagyu Association’s Specification for Characteristics of Cattle Eligible for Approved Programs Claiming Wagyu Influence.” May 23, 2025. Available at: https://www.ams.usda.gov/sites/default/files/media/AWA_WagyuLiveAnimalSpec_05232025.pdf