

Comparison of Methods to Estimate Forage Intake in Beef Cows
Introduction
Feed intake is a major driver of both cow performance and cow-calf enterprise profitability. Feed and forage costs typically account for 40% to 50% of annual production expenses, representing the highest variable cost in a cow-calf operation. Consequently, accurate estimates of forage intake are essential for determining cow costs, calculating nutrient requirements, developing supplementation programs and establishing appropriate stocking rates.
The importance of intake prediction extends beyond day-to-day nutritional management. Breed associations use feed intake estimates when calculating economic selection indexes, and beef cattle nutrition models rely on intake predictions to estimate the supply of energy, protein, vitamins and minerals available to the animal. Because stocking rate is ultimately based on forage demand, errors in intake prediction can affect pasture utilization, grazing management and long-term sustainability of the grazing resource.
Research has consistently demonstrated that forage intake is influenced by factors such as body weight, forage quality, stage of production and milk production potential. Historically, beef cows were assumed to consume approximately 2.6% of their body weight daily on a dry-matter (DM) basis, which formed the foundation of the Animal Unit (AU) system. However, modern beef cows are larger, produce more milk and graze forage that varies in quality throughout the year. As a result, fixed intake assumptions do not reflect forage demand within a season or a production stage.
Comparison of Feed Intake Prediction Systems
Several approaches are currently used to estimate forage intake in beef cows, ranging from simple body-weight-based calculations to biologically derived prediction equations that account for forage quality and production stage. Estimated annual forage demand may differ by as much as 2,000 pounds per cow, depending on the intake equation used, resulting in different stocking-rate recommendations and cow-cost estimates.
The AU system remains one of the most widely accepted methods for estimating forage demand and establishing stocking rates in U.S. grazing systems. However, because it assumes a relatively constant intake level, it differs from biological intake prediction models that account for factors such as forage quality, stage of production and milk yield. According to the NRCS “National Range and Pasture Handbook,” the AU system standardizes a 1,000-pound cow with a calf consuming about 26 pounds of DM daily (2.6% of body weight). Animal Unit Equivalents (AUE) adjust intake proportionally by body weight and lactation status. For example, a 1,200-pound lactating cow equals 1.2 AU and is expected to consume about 32 pounds of DM daily. A dry cow is assumed to consume about 92% that of a lactating cow with her calf. While simple and practical, this approach assumes intake increases directly with body weight and does not account for variation in forage quality or herd-average milking ability over time.
In the “Nutrient Requirements of Beef Cattle” publication (NASEM, 2016), cow intake is determined using body weight, diet energy concentration, production stage and estimated milk yield. Research used to develop this system was largely conducted in the 1980s and 1990s. The data set used included a significant number of experiments in which cow feed intake was measured indirectly using indigestible markers. In general, forage or feed intake increases with increasing body weight, dietary energy density and lactation demand. For lactation, the intake estimate is adjusted by multiplying the approximate milk yield by a standard coefficient (0.2). For example, if a herd’s average milk yield is 15 pounds, then forage intake is expected to increase by 3 pounds per day during lactation.
In 1992, Hibbard & Thrift developed a table estimating cow feed intake based on the cows’ stage of production, forage quality and cow body weight. These guidelines have been widely used in Extension publications for many years. Like the AU system, this method originally expressed intake as a percentage of cow body weight. The intake values vary depending on the stage of production (lactating or dry) and forage quality (high, medium, and low). Lalman and others converted the tabular values into a multiple regression equation in 2019.
Gross et al. (2024) developed a new intake prediction equation using research conducted between 2003 and 2022. Beyond using more recent data, another distinguishing feature of this equation is that it was developed entirely from studies in which feed intake was measured directly rather than estimated indirectly from indigestible markers. Like previous models, it incorporates effects of body weight and dietary energy, but it improves prediction across production stages (Figures 1 and 2). On average, forage intake increased by 7.2 pounds per day (3.27 kg) during lactation. The estimate of increased forage intake during lactation was associated with an average estimate of milk yield of 14.4 pounds (6.56 kg). There was not sufficient data available to generate an adjustment for milk yield when cows produce less than or greater than 14.4 pounds of milk per day. Other recent experiments conducted at Oklahoma State University suggest that intake increases by approximately 0.4 pound for each additional pound of milk produced. Therefore, in the Gross equation, feed intake is adjusted by 0.4 pound for each pound of milk produced above or below 14.4 pounds per day.
Figure 1 compares estimates of feed intake (pounds per day) for gestating 1,200-pound cows across a range of diet energy concentration often encountered throughout the year. All three equations predict similar intake when forage digestibility (TDN) is low. However, as forage quality increases, the Hibberd and Thrift equations and the Gross equations predict a more aggressive increase in forage intake compared to the NASEM equation.
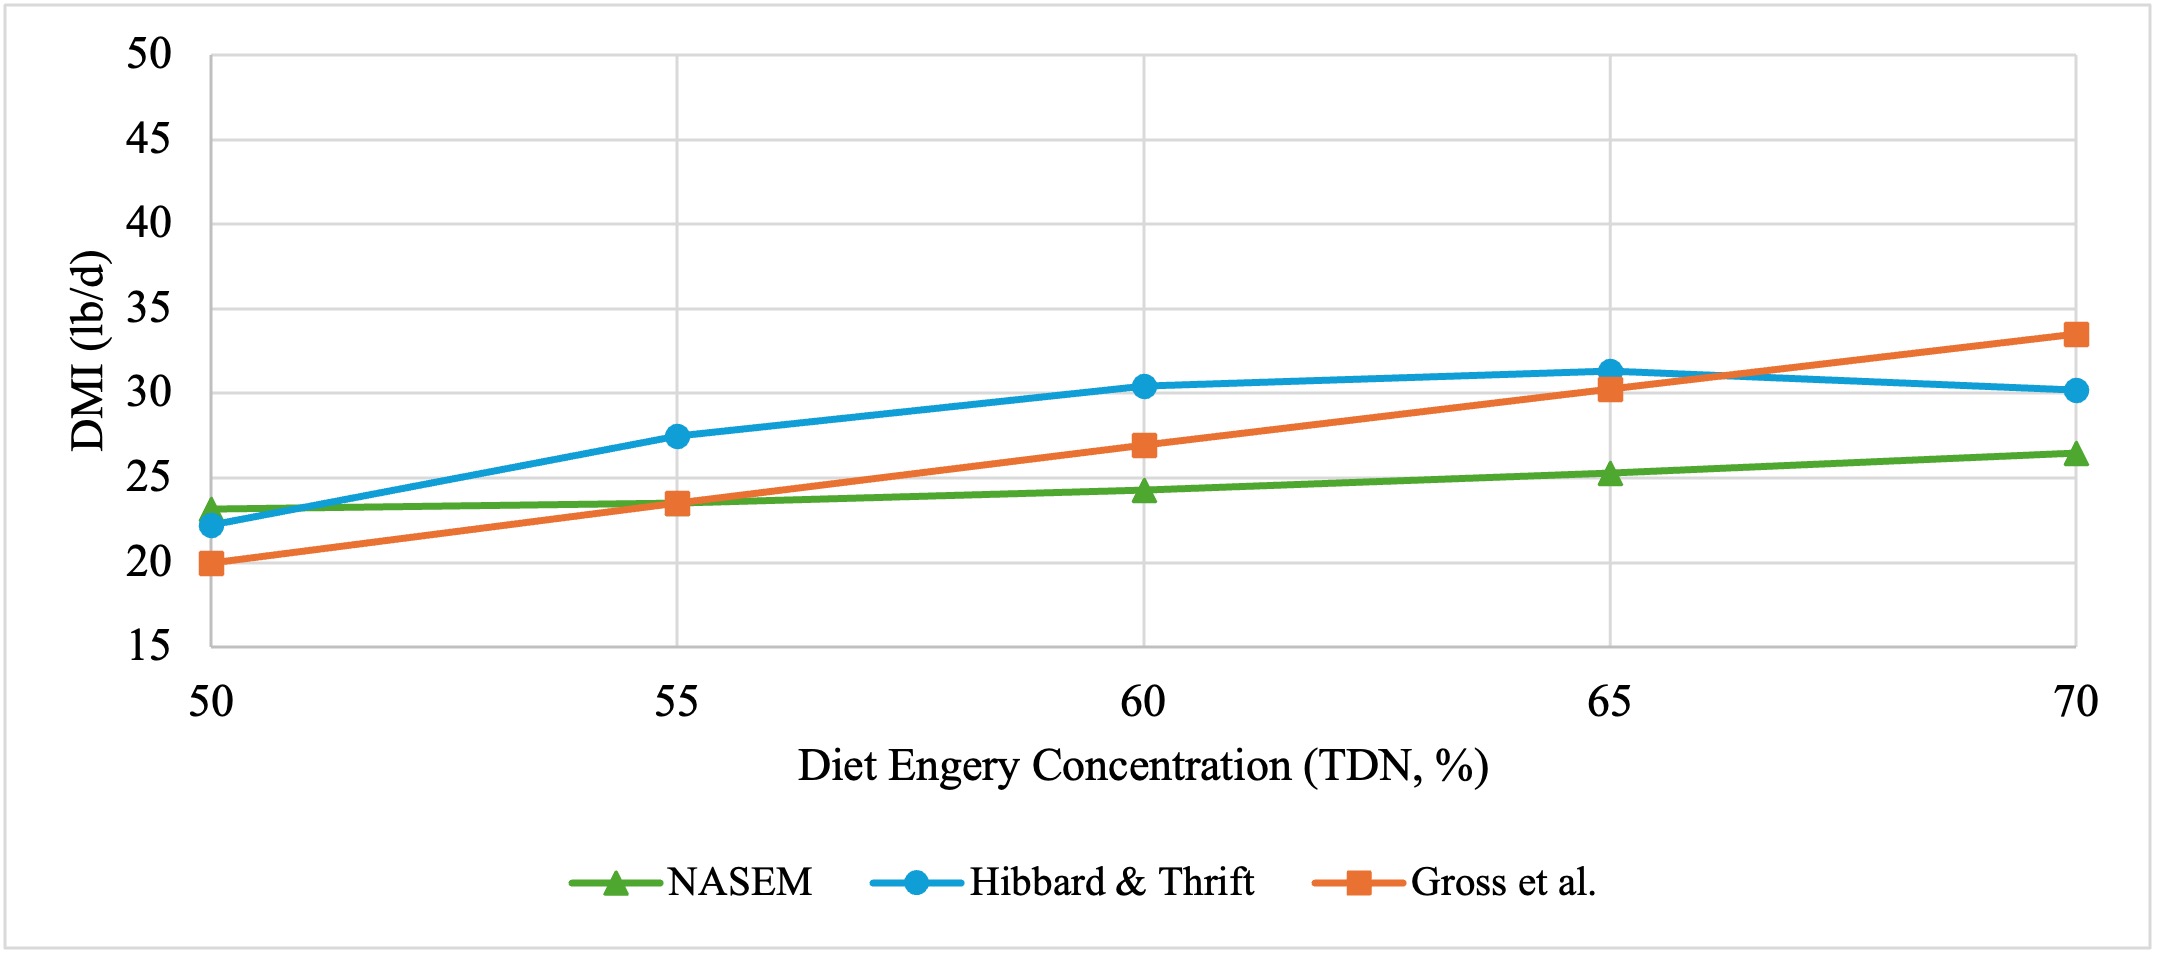 Figure 1. Predicted dry matter intake for a 1,200-pound gestating beef cow across increasing forage quality (TDN, %) using three intake predication equations:
- NASEM: DMI, kg/d = (SBW0.75 x [0.04997 x NEm2 + 0.04631])/ NEm
- Hibbard & Thrift: DMI, kg/d = (-0.0323 x NEm2 +_0.0944 x NEm – 0.0418) x SBW
- Gross et al.: DMI, kg/d = (9.21 x NEm + 0.133 x SBW0.75) – 14.38
Figure 2 compares estimates of feed intake (pounds per day) during lactation for 1,200-pound cows across a range of diet energy concentration. All three equations predict similar intake when forage digestibility (TDN) and milk yield are low, but vary as these factors increase.
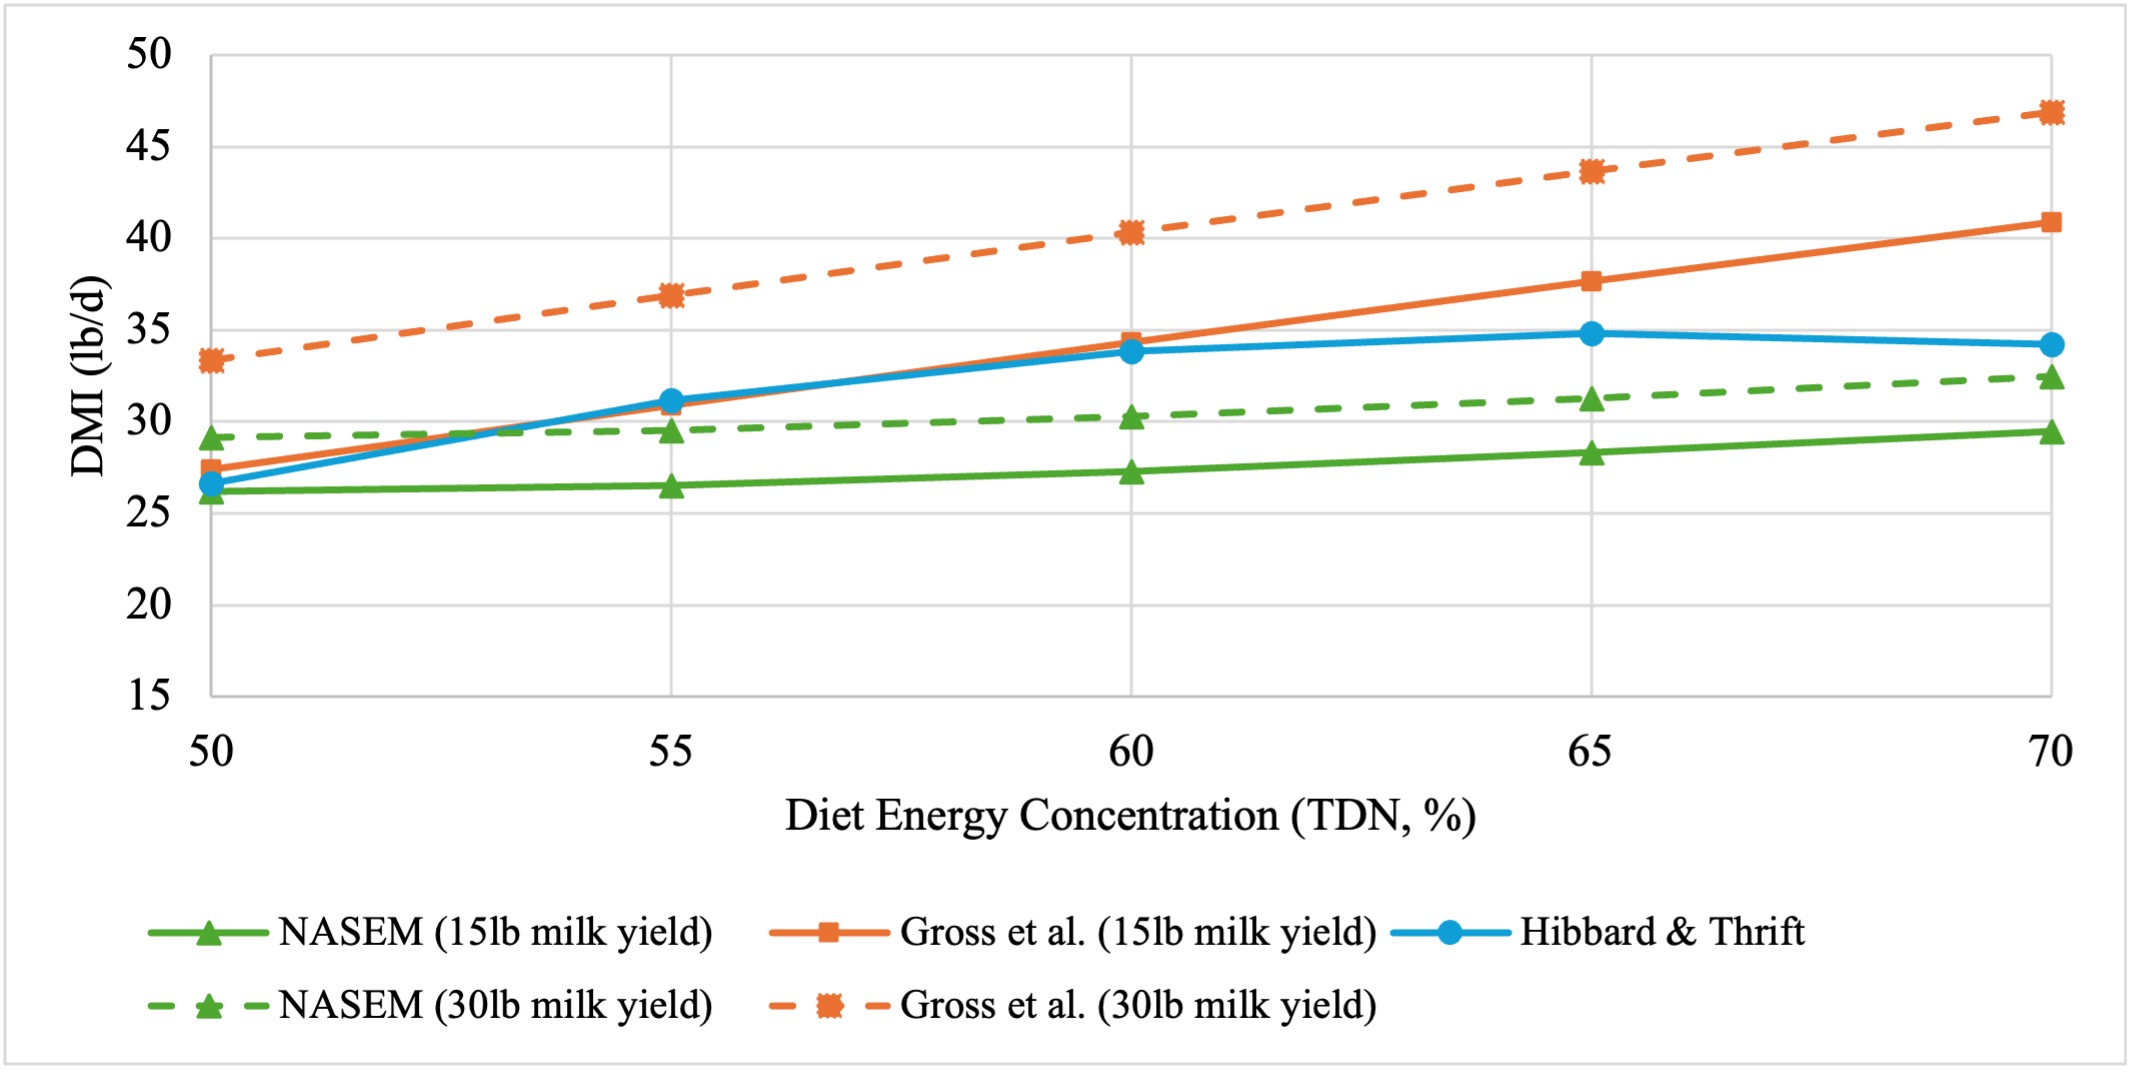 Figure 2. Predicted feed intake for a 1,200-pound beef cow producing 15 or 30 pounds of milk/day across increasing forage quality (TDN, %) using the three predication equations with consideration of milk yield:
- NASEM (15-pounds milk yield): DMI, kg/d = (SBW0.75 x [0.04997 x NEm2 + 0.04631]/ NEm + (0.2 x 6.8)
- Gross et al. (15-pound milk yield): DMI, kg/d = [(3.27 + 9.21 x NEm + 0.133 x SBW0.75) – 14.38] + (6.8 - 6.6) x 0.4
- Hibbard & Thrift: DMI, kg/d = (-0.0261 x NEm2 +_0.07777 x NEm – 0.0277) x SBW
- NASEM (30-pound milk yield): DMI, kg/d = (SBW0.75 x [0.04997 x NEm2 + 0.04631]/ NEm + (0.2 x 13.6)
- Gross et al. (30-pound milk yield): DMI, kg/d = [(3.27 + 9.21 x NEm + 0.133 x SBW0.75) – 14.38] + (13.6 – 6.6) x 0.4
Effects on Estimated Annual Forage Demand and Stocking Rate
Annual forage intake requirements and stocking rates were calculated for 1,200-pound beef cows in the spring- and fall-calving systems (Table 1) using each of the intake equations with an adjustment for forage consumed by the calf. In the AU system, calf forage consumption is accounted for 6 months, and therefore, no additional adjustments were made in the spring-calving system. We assumed a 770-pound calf forage consumption in the AU system to account for the 90-day delay in weaning date and heavier calf weight. For the NASEM, Hibberd and Thrift and the Gross equations, calf intake was assumed to equal 760 pounds prior to weaning in spring-calving systems (7 months of age) and 1,530 pounds prior to weaning in fall-calving systems (10 months of age).
| Prediction system | Forage demand | Native range | Bermudagrass |
|---|---|---|---|
| AU System | 11,001 | 10.5 | 3.1 |
| NASEM (2016) | 10,152 | 9.7 | 2.9 |
| Hibberd & Thrift | 11,972 | 11.4 | 3.4 |
| Gross et al. | 11,809 | 11.2 | 3.4 |
| Prediction system | Forage demand | Native range | Bermudagrass |
|---|---|---|---|
| AU System | 11,996 | 11.4 | 3.4 |
| NASEM (2016) | 11,207 | 10.7 | 3.2 |
| Hibberd & Thrift | 13,110 | 12.5 | 3.7 |
| Gross et al. | 13,111 | 12.5 | 3.7 |
Native range = 3,500 pounds of annual forage production and 30% harvest efficiency.
Bermudagrass = 5,000 pounds of annual forage production and 70% harvest efficiency.
Monthly forage quality (TDN, %) ranges from a low of 50% during winter to 70% during spring. Unshrunk cow weight = 1,200 pounds and shrunk cow weight = 1,152 pounds.
Average milk yield = 15 pounds/day and is used to adjust intake in the NASEM and Gross equations.
*Spring-calving systems were modeled assuming seven months of lactation and a five-month dry period. Calf forage intake was assumed to total 760 pounds.
+Fall-calving systems were modeled assuming 10 months of lactation and a two-month dry period. Calf forage intake was assumed to total 1,540 pounds in the NASEM, Hibbard and Thrift and the Gross systems. Because the AU system includes a cow with an unweaned calf, an additional 770 pounds of forage demand was added to account for the calf remaining with the cow for an additional 90 days prior to weaning.
Predicted annual forage demand (Table 1 and 2) varied among intake models and between calving systems. Fall-calving systems generally resulted in greater annual forage demand because cows remained lactating for a longer portion of the year and because calves consumed forage for an additional four months prior to weaning. Consequently, both the intake prediction method and calving management influenced the stocking-rate calculations.
In spring-calving systems, the NASEM equation predicted the lowest annual forage demand. The AU system produced intermediate estimates, whereas the Hibbard and Thrift and the Gross equations were remarkably similar and predicted the greatest forage demand regardless of calving season. In fall-calving systems, the Hibbard and Thrift and the Gross equations projected approximately 1 ton more annual forage demand per cow-calf pair than either the AU or NASEM systems. Under the forage production assumptions used here, this difference equates to approximately two additional acres of native rangeland or 0.5 acre of bermudagrass pasture per cow-calf pair while maintaining moderate grazing pressure.
The AU system remains a practical and widely accepted method for estimating forage demand and stocking rate. However, biological prediction systems provide additional information regarding how forage demand changes throughout the year in response to forage quality, stage of production, milk production and calf age. As a result, these approaches are useful when evaluating seasonal forage availability, supplementation needs and alternative calving-season management strategies.
References
Gross, M. A., A. L. Holder, A. N. Moehlenpah, H. C. Freetly, C. L. Goad, P. A. Beck, E. A. DeVuyst, and D. L. Lalman. 2024. Predicting feed intake in confined beef cows. Trans Anim Sci. 8:txae001. doi:10.1093/tas/txae001.
Lalman, D. L., C. E. Andresen, A. L. Holder, R. R. Reuter, and A. P. Foote. 2019. Application of the California Net Energy System to grazed forage: feed values and requirements. Trans Anim Sci. 3:962–968. doi:10.1093/tas/txz034.
NASEM, 2016. Nutrient Requirements for Beef Cattle.
U.S. Department of Agriculture, Natural Resources Conservation Service, 2022. National range and pasture handbook.