Broadband Infrastructure and Adoption in Oklahoma – 2015 Edition
Introduction
Broadband or high-speed Internet access has become an increasingly important part of the lives of most Americans. This current report uses the latest available data to assess how broadband infrastructure and adoption is progressing across Oklahoma, and how the state compares to its neighbors and the nation as a whole.
Historically, broadband access has been defined as at least 200 kilobytes per second (kbps) of data transfer in at least one direction. However, the Federal Communications Commission has updated that definition on more than one occasion, with the current definition (as of 2015) being 25 megabytes per second (mbps) download and 3 mbps upload. This is more than 100 times faster than the historical 200 kbps definition. Unless noted otherwise, this document will use the original definition of 200 kbps to define broadband, since most of the data collected on this topic still uses that threshold.
Broadband Adoption
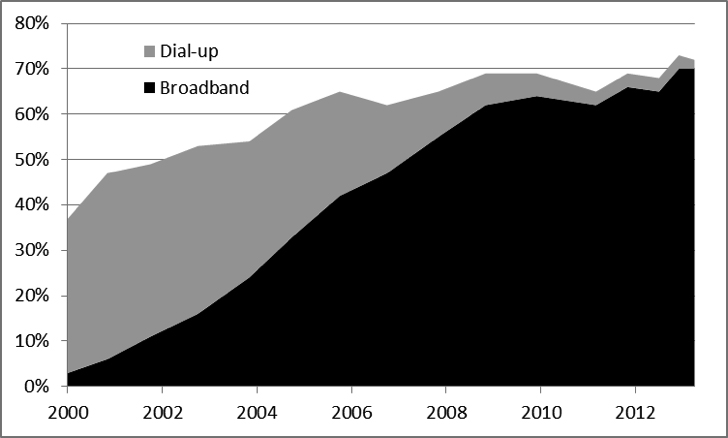
Rates of residential broadband adoption increased dramatically during 2000 to 2014 for the nation as a whole. Figure 1 shows that the U.S. rate of household broadband adoption was around 70 percent in 2014, with another 2 percent still using dial-up. This leaves slightly less than 30 percent of all households with no type of Internet connection at home. For this report, the term ‘adoption’ refers to a household actually subscribing to a monthly broadband connection, while ‘access’ denotes that broadband is available where the household is located.
Figure 1. Residential Broadband and Dial-up Adoption in the U.S., 2000 – 2014. Source: PEW Internet and American Life Surveys 2000 – 2014.
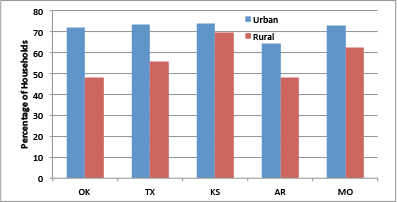
In Oklahoma, the rate of residential broadband adoption was 68 percent in 2013, mirroring the national rate that year. However, this masks a significant “digital divide” between rural and urban parts of the state, with 72 percent of urban households having a broadband connection, compared to only 48 percent of rural households (ESA and NTIA, 2014). Figure 2 displays rural/urban broadband adoption rates for Oklahoma and some neighboring states in 2013. In this instance, rural refers to non-metropolitan areas, which are areas not containing a metropolitan or micropolitan statistical area and have at least 10,000 people. The rural/urban broadband adoption gap of 24 percentage points in Oklahoma is the largest among the states shown. The low rates of broadband adoption in rural Oklahoma are cause for concern, given recent research showing rural areas with high broadband adoption rates have higher growth in income levels, more firms and employment, and lower growth in unemployment rates (Whitacre et al., 2014a; 2014b).
Figure 2. Residential Broadband Adoption Rates by Rural/Urban Status in five States, 2013. Source: U.S. Census Bureau, Current Population Survey Internet Use Supplement, July 2013.
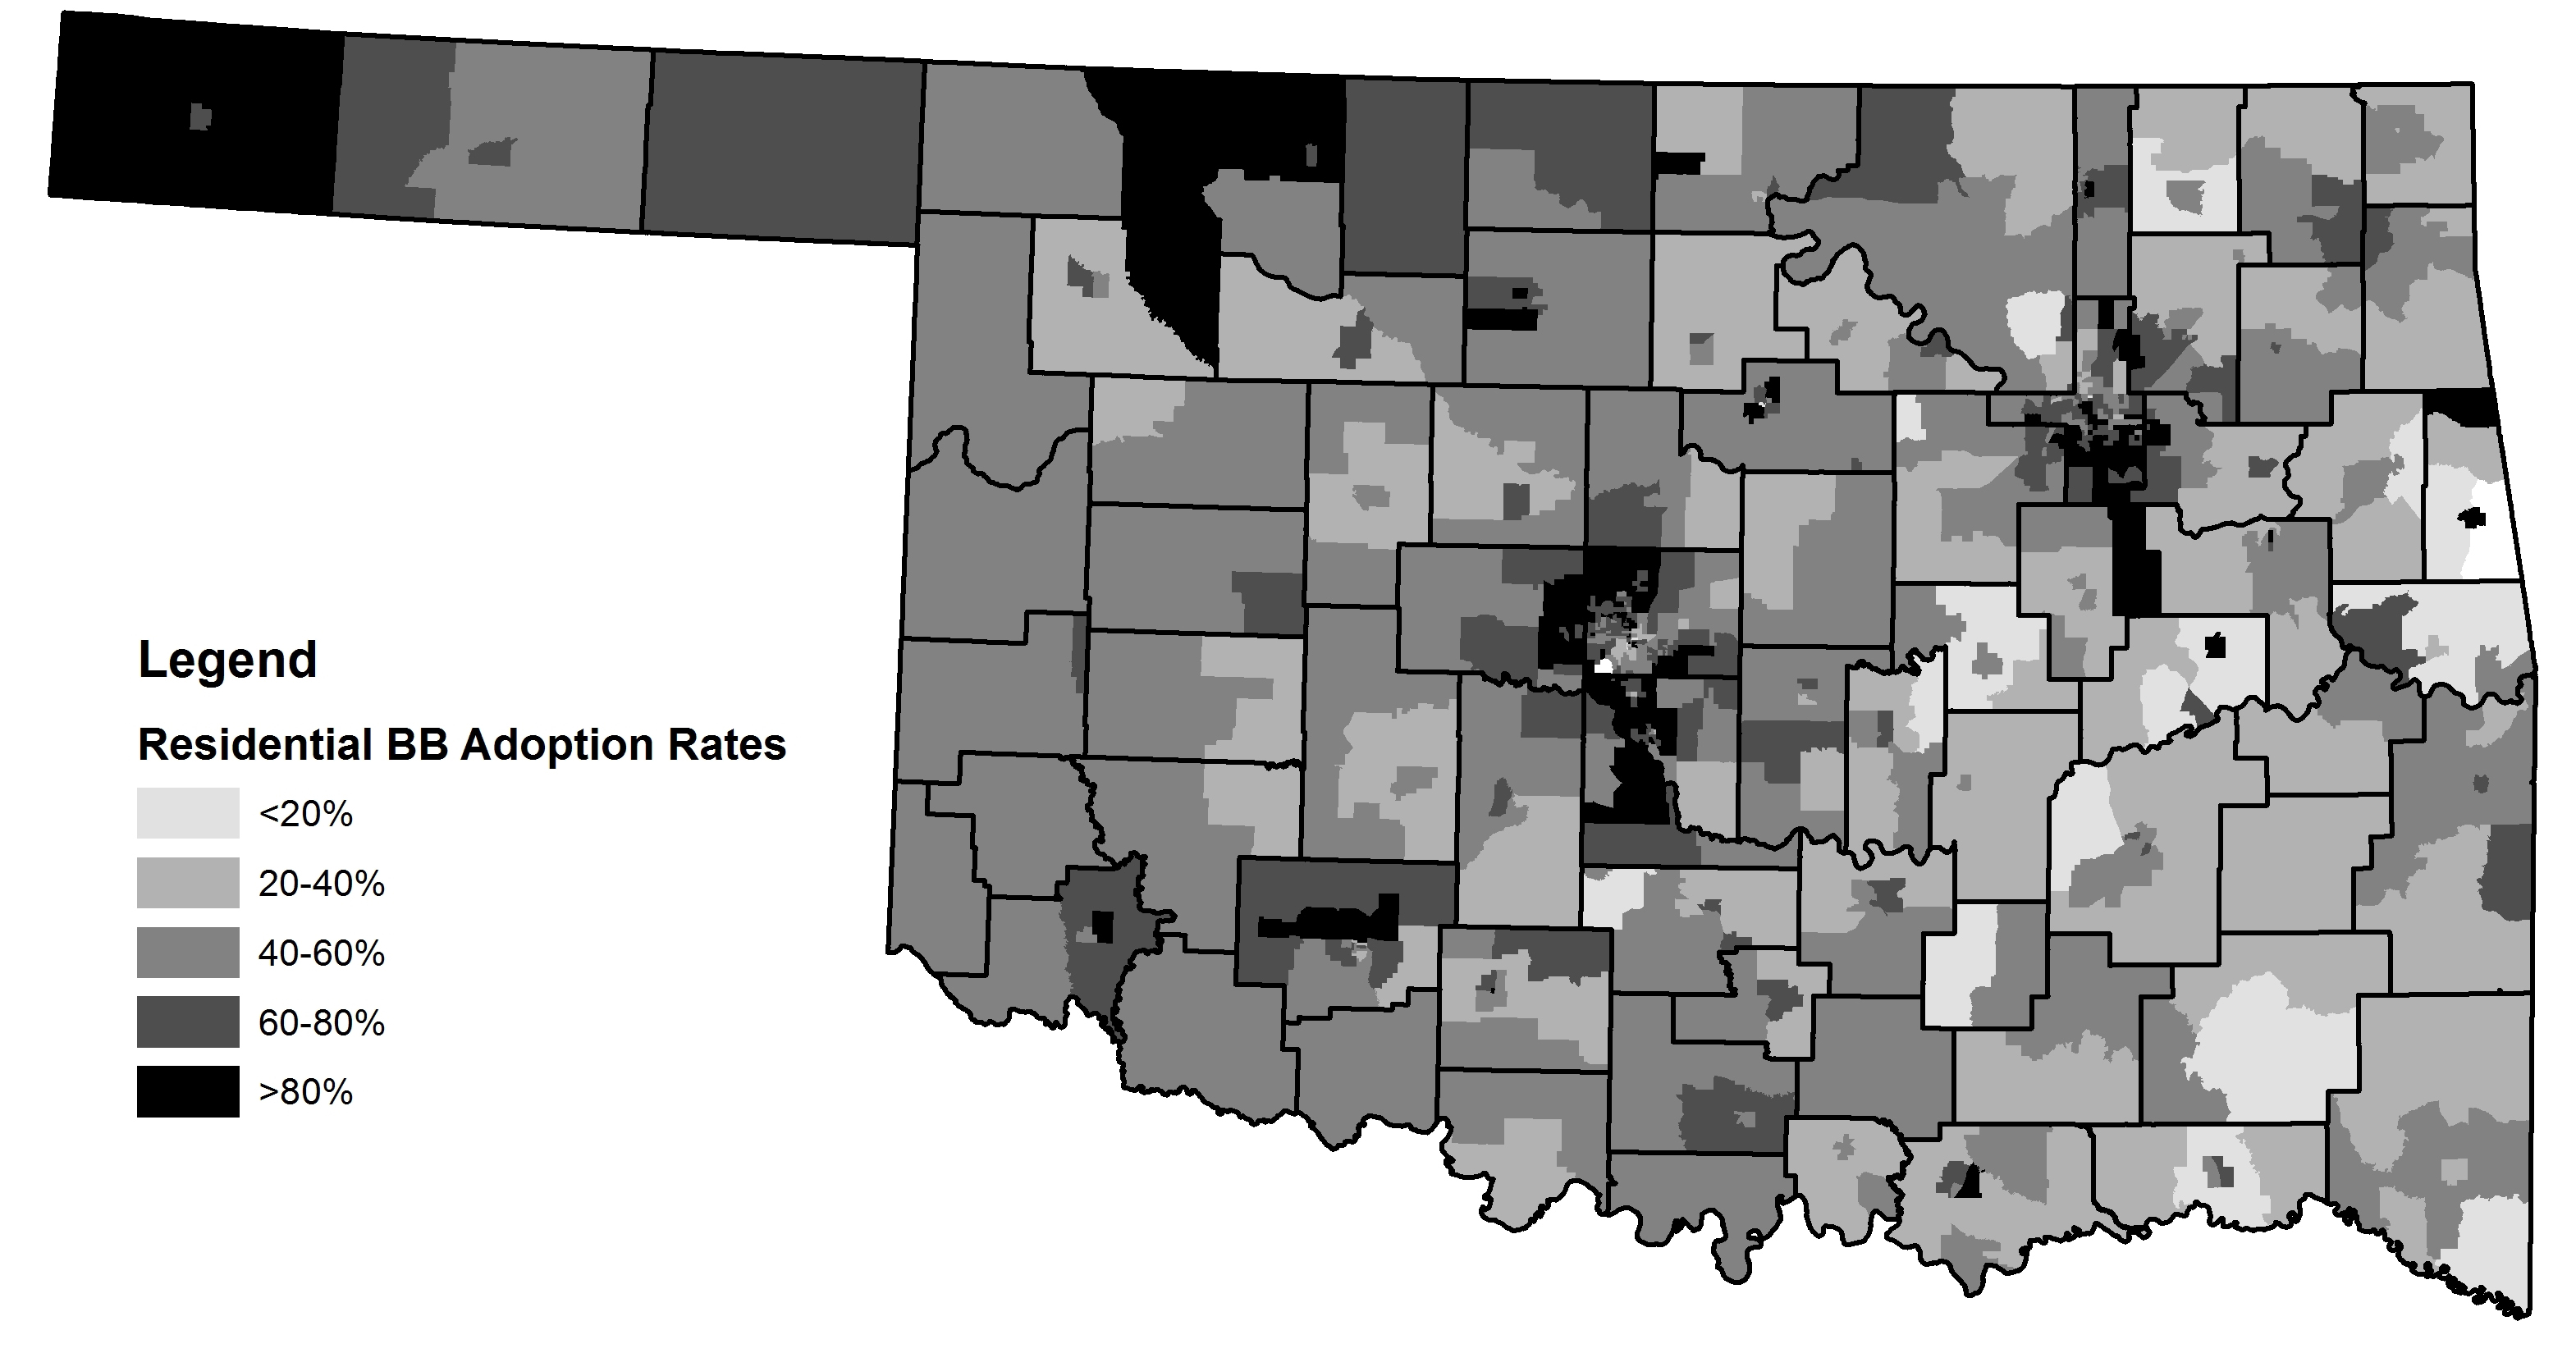
Recently, estimates of broadband adoption at the county and census tract level have become available. Figure 3 shows household broadband adoption rates in Oklahoma at the census tract level in 2013. It is clear that the southeastern part of the state lags behind in terms of broadband adoption, with rates typically less than 40 percent. On the other hand, many of the tracts surrounding the major metropolitan areas in the state (Oklahoma City, Tulsa and Lawton) are extremely high, with many having household adoption rates of more than 80 percent. Some relatively rural parts of the state demonstrate very high levels of broadband adoption, such as Boise City, Durant, Cordell and Alva.
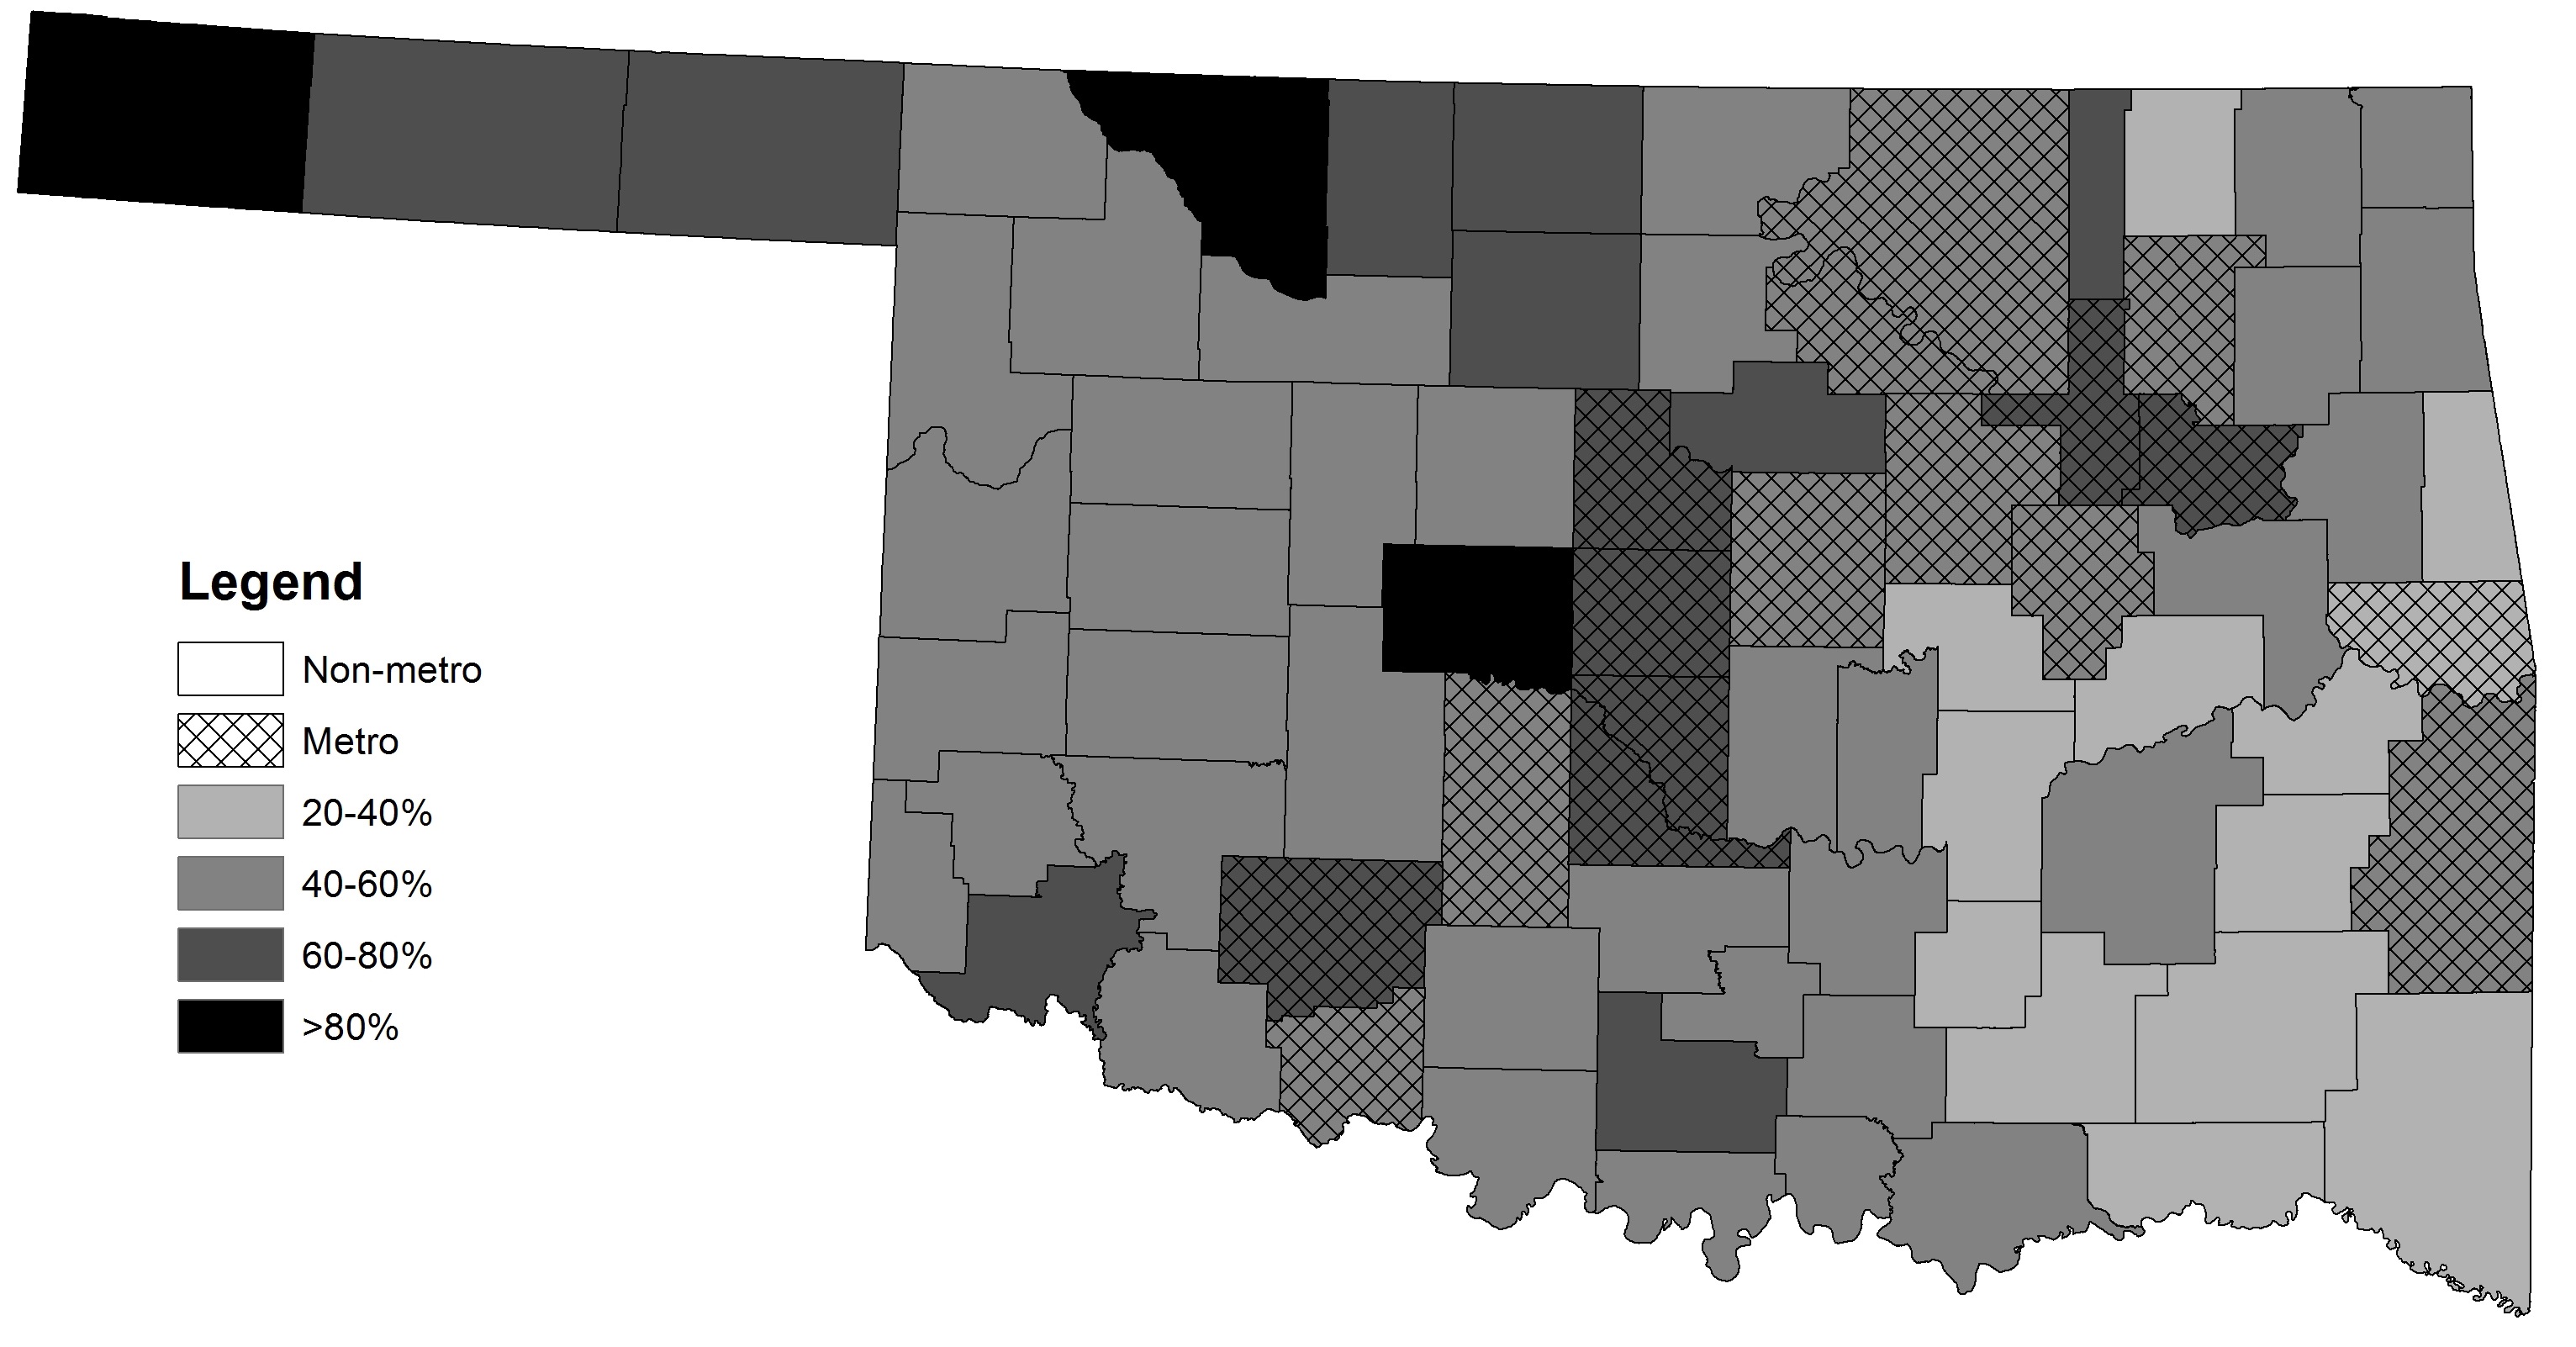
These trends continue when we turn to a county-level map also showing the metropolitan counties in the state. While the counties nearest OKC, Tulsa and Lawton all rank relatively highly, two of the three counties with the highest rates in the state are actually found in non-metropolitan counties: Woods and Cimarron. The rates in the southeastern part of Oklahoma are still noticeably lower than the rest of the state.
Figure 3. Census Tract Residential Broadband Adoption Rates in Oklahoma, 2013. Source: FCC Form 477 Data.
Figure 4. County-level Residential Broadband Adoption Rates in Oklahoma, 2013. Source: FCC Form 477 Data..
Broadband Infrastructure
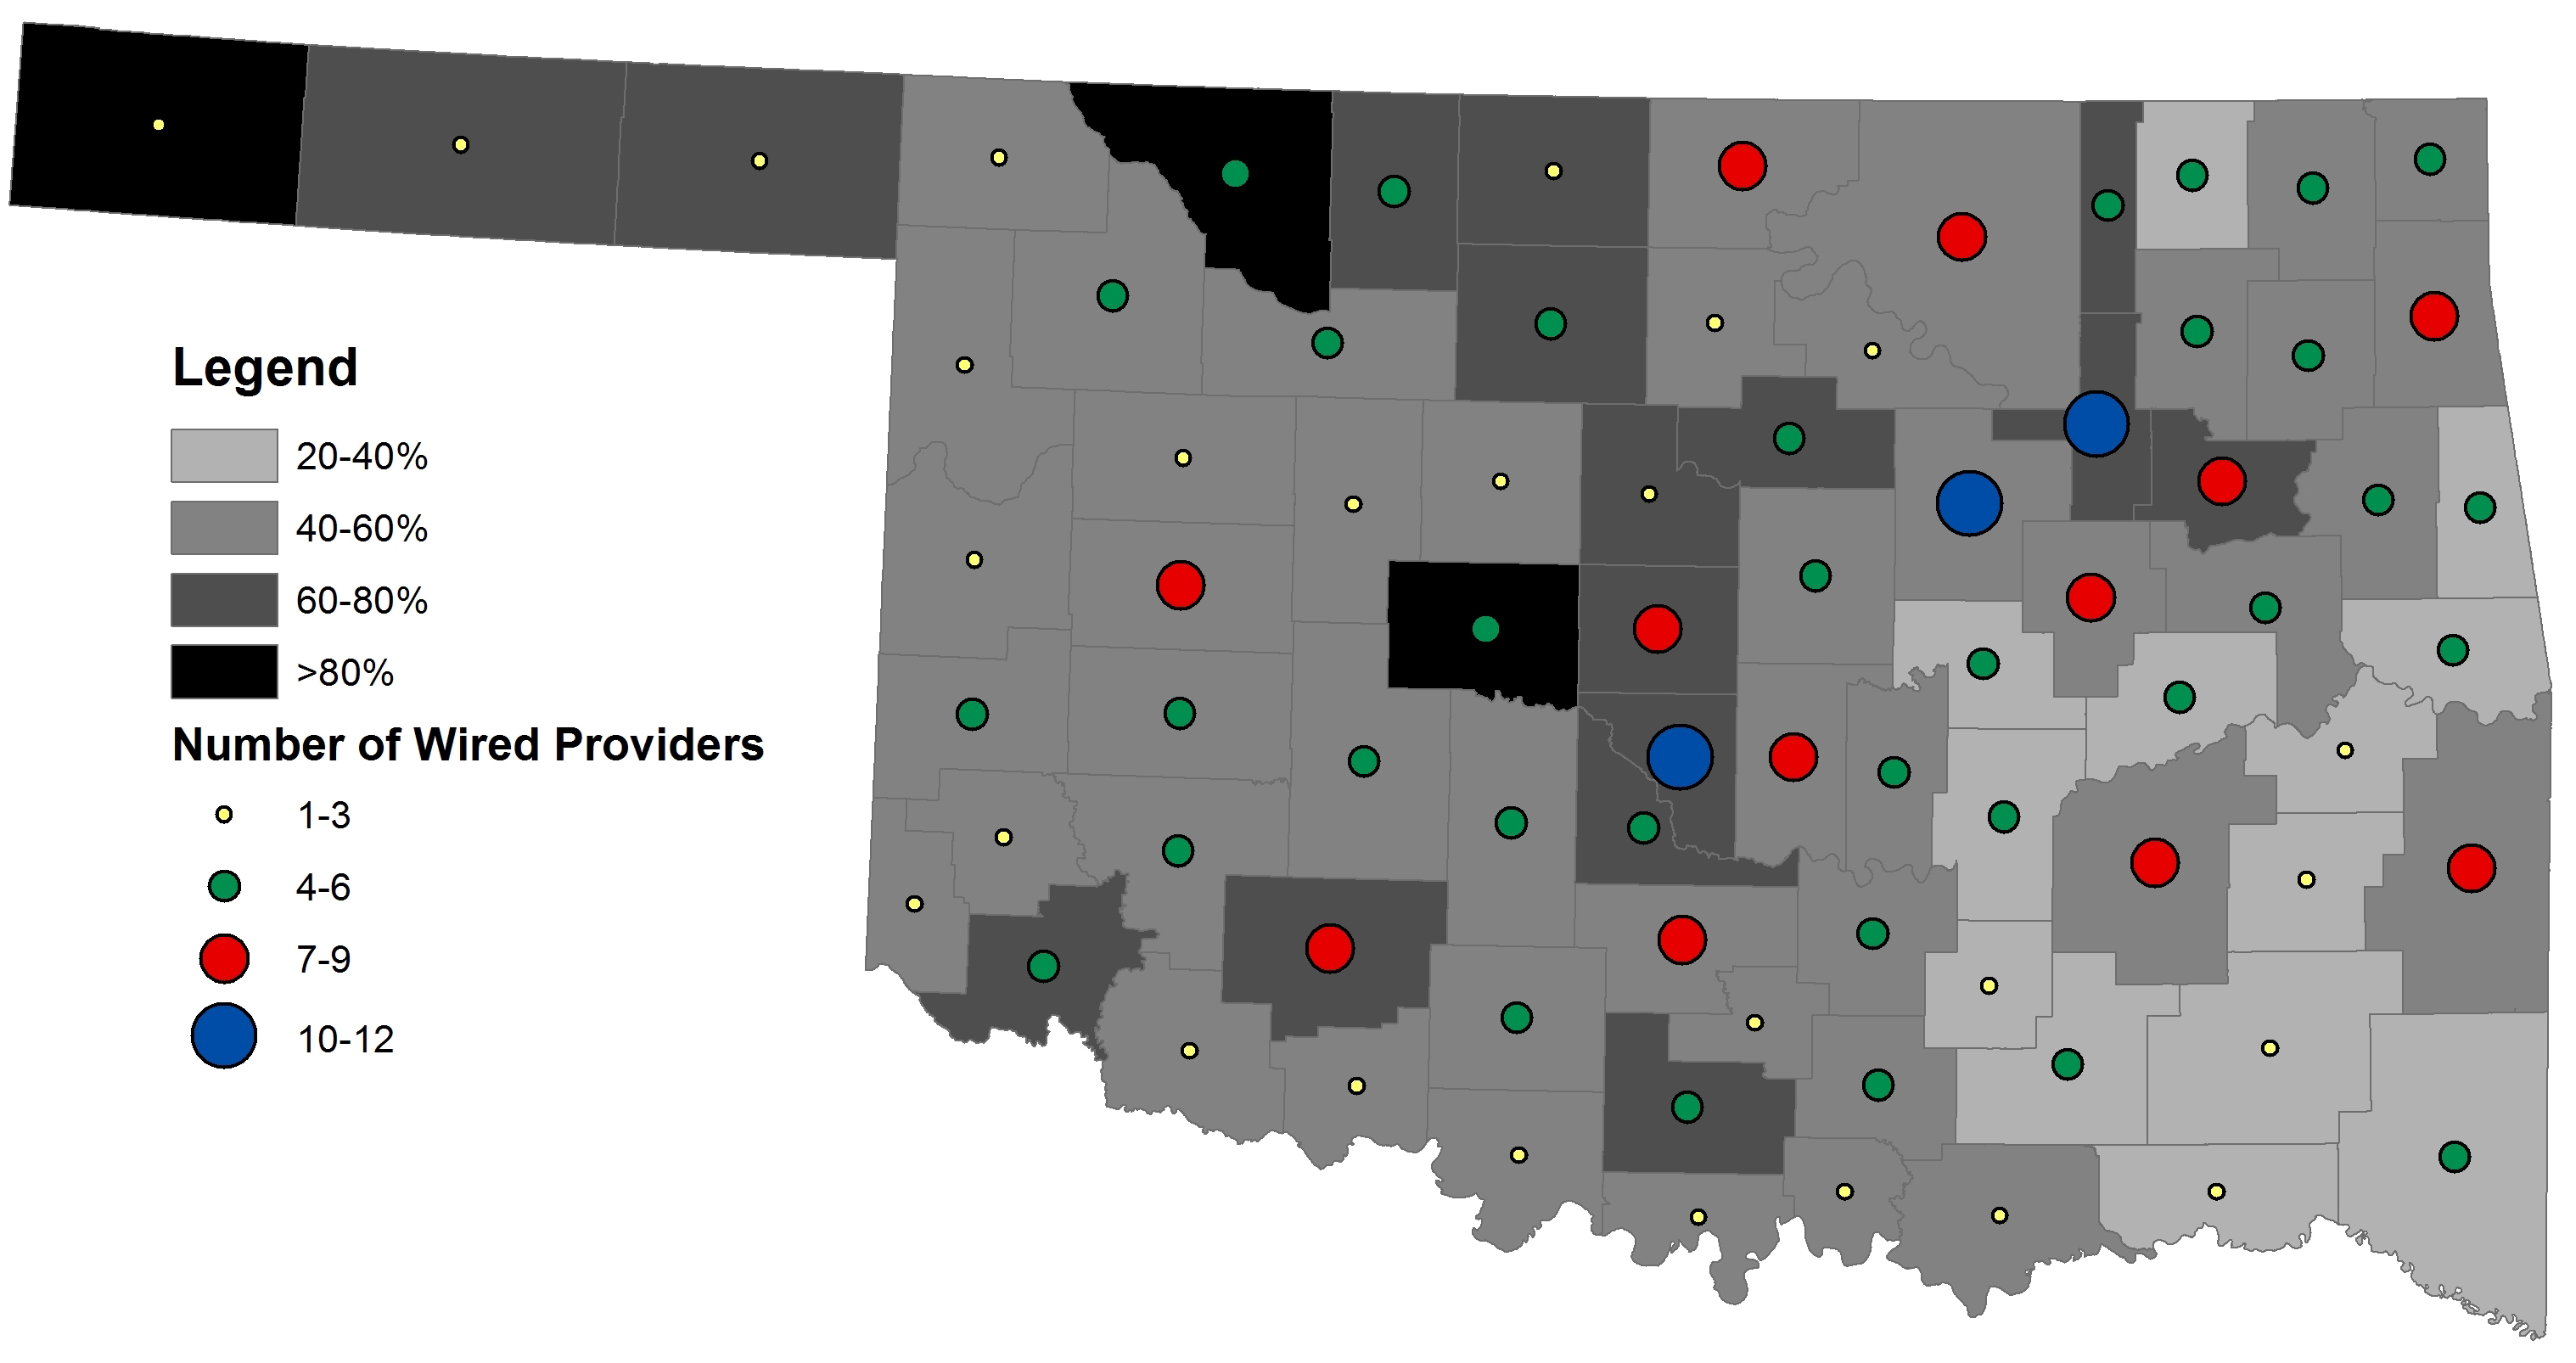
One potential reason why certain areas of the state lag behind in terms of broadband adoption might be that there are few broadband providers in their area. However, Figure 5 demonstrates there is not a large correlation between the number of fixed (wired, as opposed to wireless) broadband providers in a county and the broadband adoption rate in that county. Several counties have relatively high adoption rates despite having only a small number of providers (Woodward and Cimarron, for example). Conversely, many counties have low adoption rates in spite of having a large number of broadband providers (Creek and Pittsburg, for example).
Figure 5. County-level Broadband Adoption Rates and Number of Wired Broadband Providers, 2013. Source: FCC Form 477 Data.
In 2010, the National Broadband Map (NBM) became the first official national source of data to specifically detail where broadband infrastructure was and was not available. The NBM summarizes the percentage of the population with access to broadband of different types and speeds. This information is available at both the city and county level.
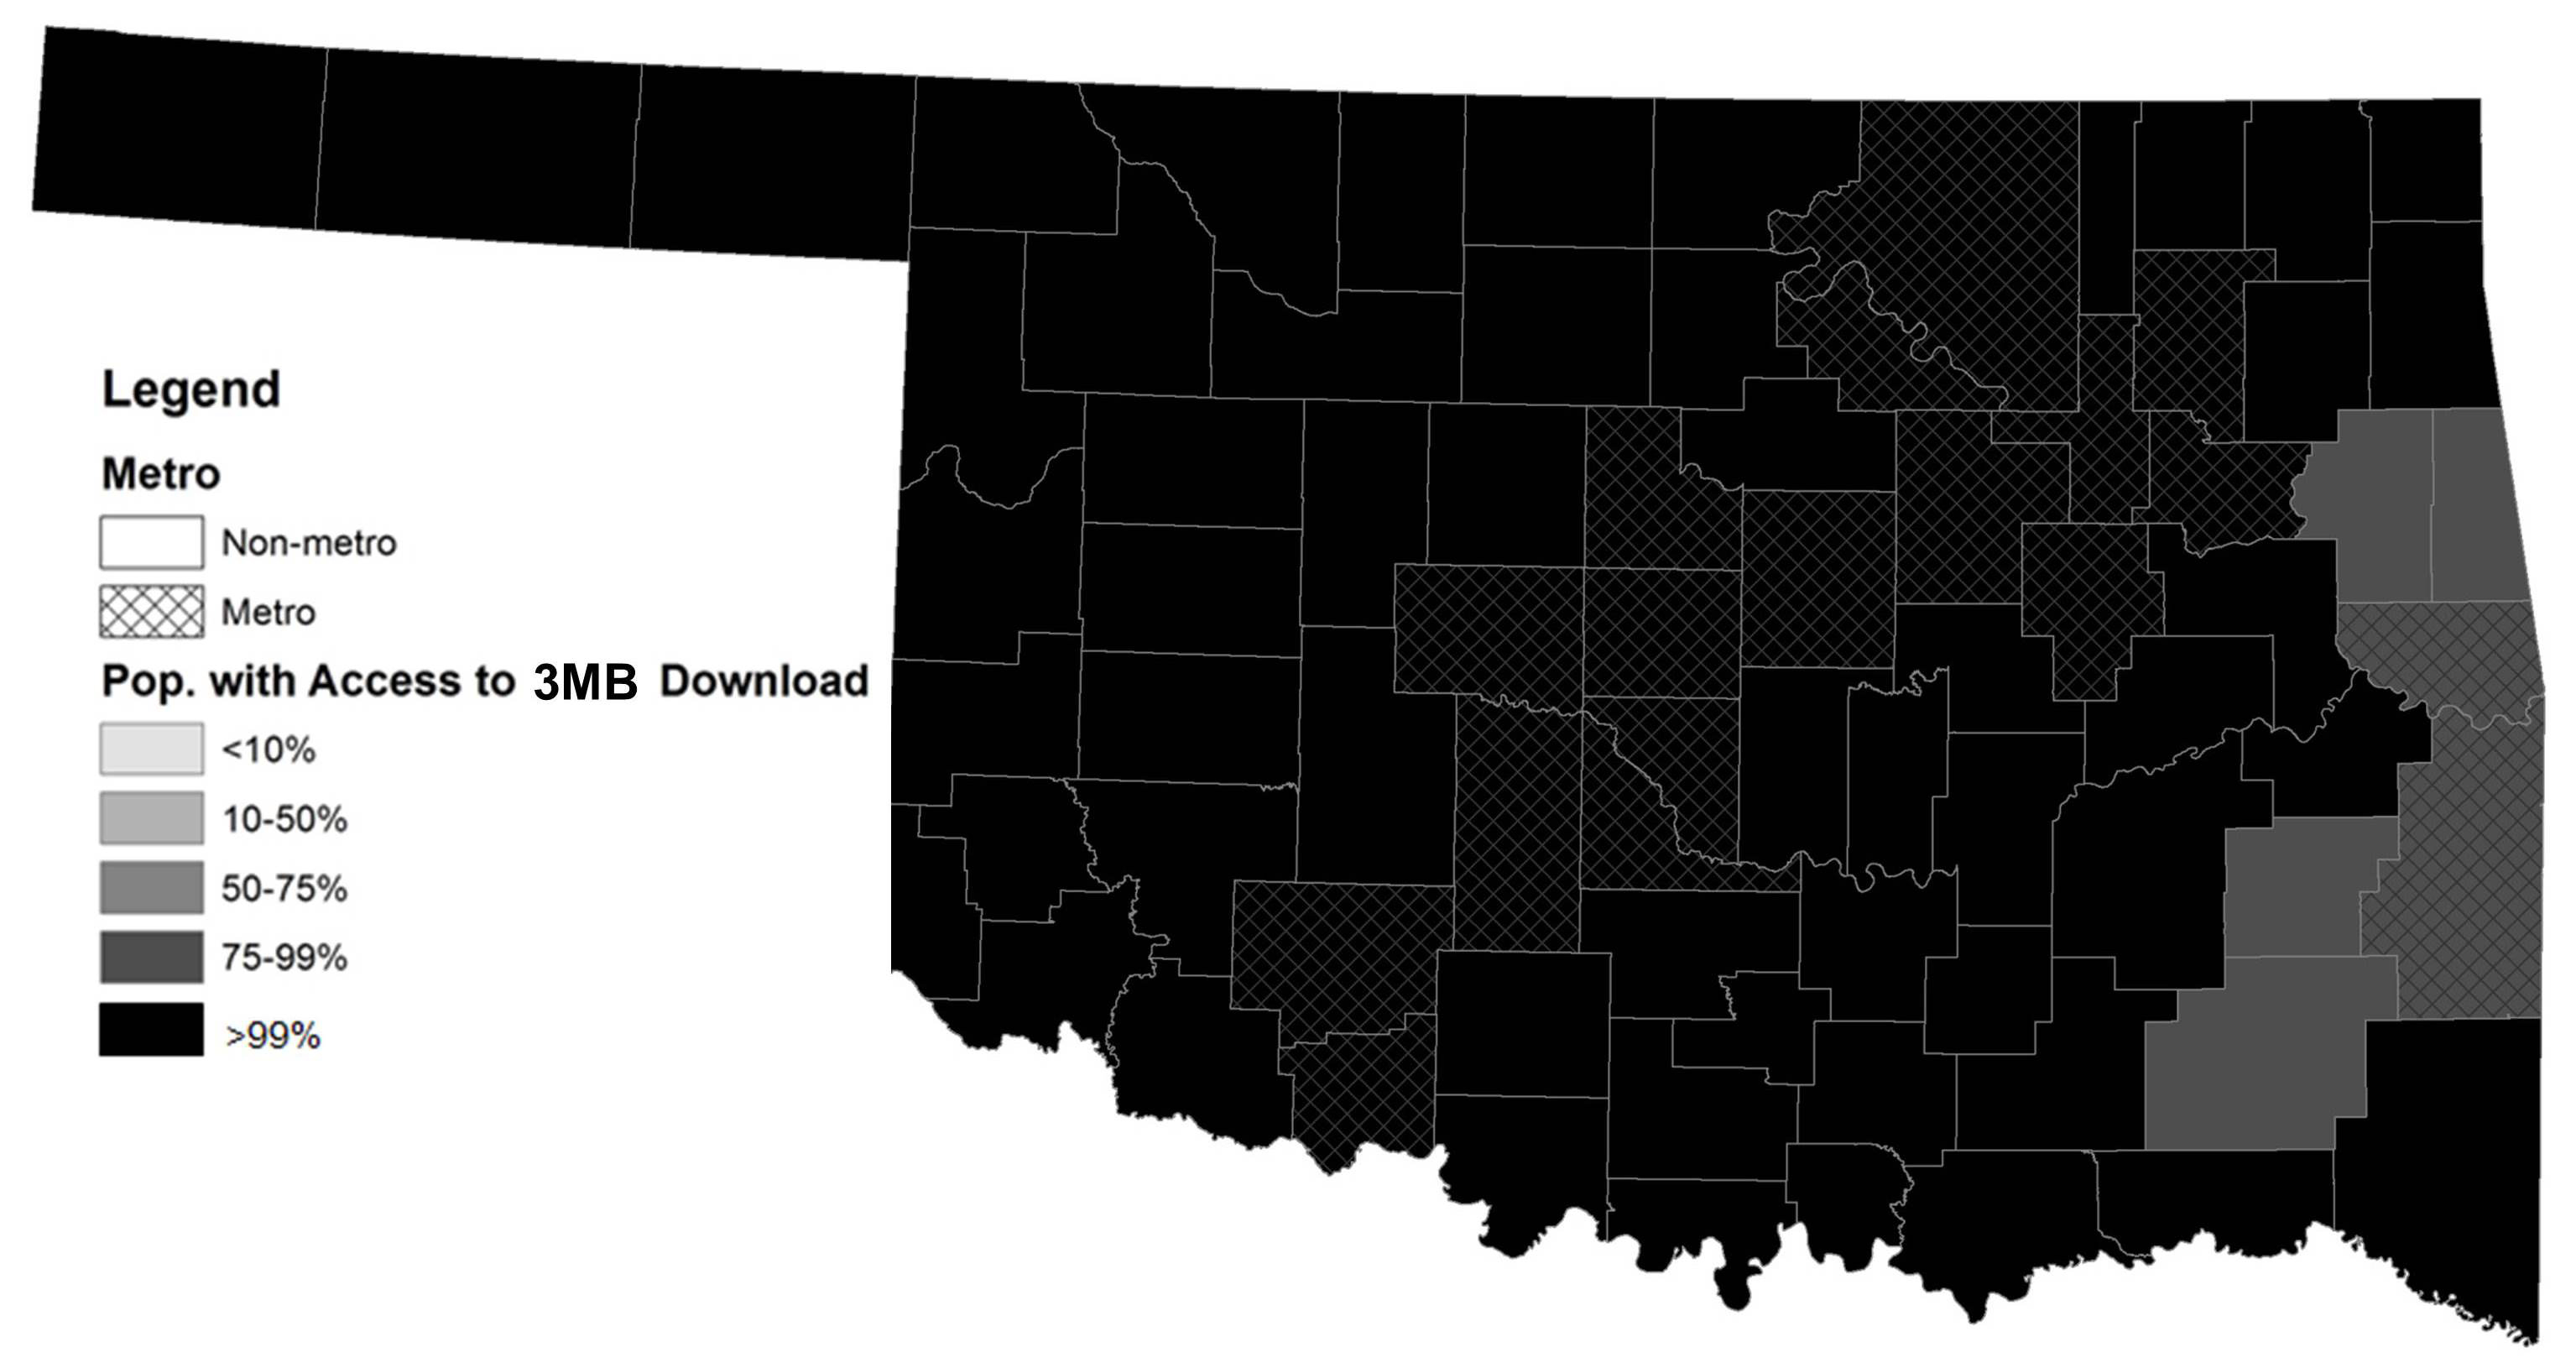
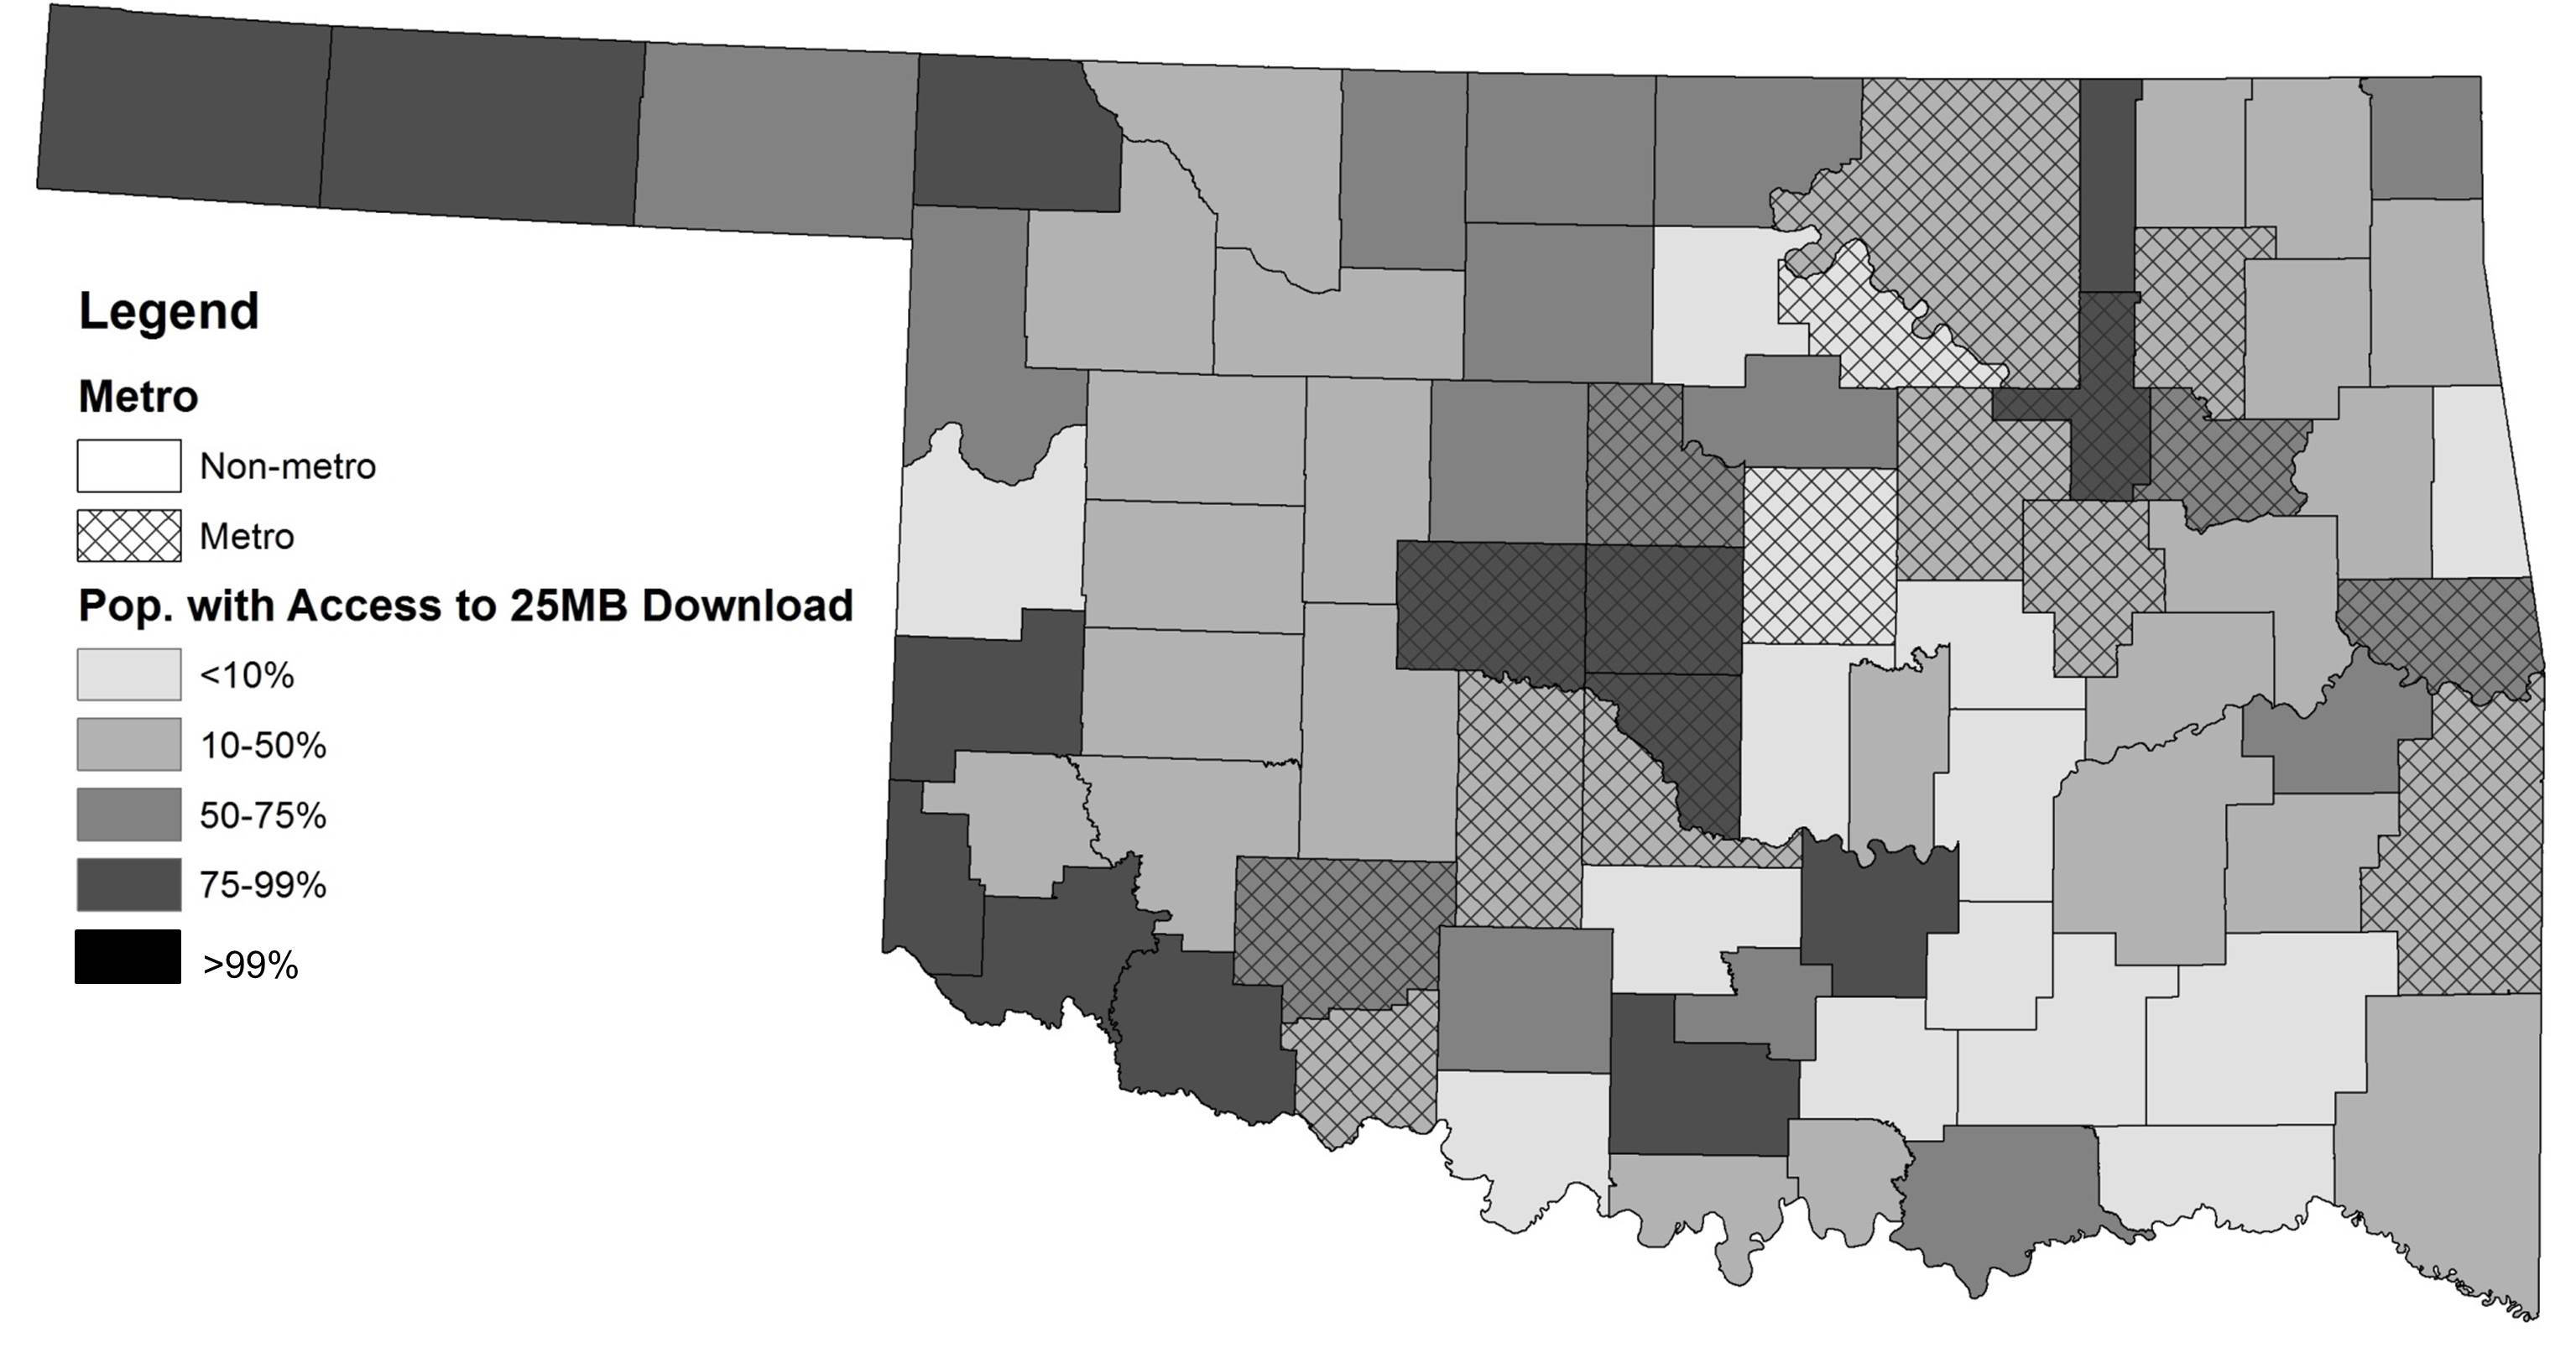
The NBM data makes clear that many Oklahomans do not have access to speeds that officially qualify as broadband under the 2014 FCC definition (25 mbps down, 3 mbps up). Of Oklahoma’s 77 counties, 71 have more than 99 percent of their residents with access to broadband with download speeds of 3 mbps (top map of Figure 6). However, the percentage of residents with access to the higher speed of 25 mbps are dramatically lower (Figure 6, lower map). Fifteen counties have less than 10 percent of their population with this type of access.
Figure 6. Percentage of County Population with Access to 3 mbps (top) and 25 mbps (bottom) Download Speeds, 2014. Source: National Broadband Map Data.
Turning to the city-level NBM data, it becomes increasingly clear that rural Oklahoma lags behind in terms of high-speed broadband infrastructure. This is displayed in Table 1, which classifies Oklahoma cities by size and lists the broadband availability situation for residents of those cities. For the smallest cities (less than 2,500 residents – thus, officially “rural”), 81.3 percent has access to relatively slow wired broadband (200 kbps), while almost all (99.7 percent) have access to relatively slow wireless broadband (200 kbps). Interestingly, wireless (i.e. cellphone) connections up to 10 mbps cover all residents of cities of more than 10,000 residents, and even more than 90 percent of smaller town residents. These types of connections do not provide access to 25 mbps download speeds, however. Table 1 shows that larger cities have a dramatic advantage in terms of access to 25 mbps broadband, with 96 percent of citizens in towns of more than 50,000 having this type of broadband available, compared with only 32 percent of towns with less than 2,500 residents.
Table 1. Percentage of Oklahoma Residents with Access to 200 kbps, 10 mbps, and 25 mbps (bottom) Download Speeds, by size of Community (2014).
| City Size | # Cities | Total Pop | % of total | 200KB Wired | 200KB Wireless | 10MB Wired | 10MB Wireless | 25 MB Wired | 25 MB Wireless |
|---|---|---|---|---|---|---|---|---|---|
| < 2,500 | 608 | 310893 | 0.10% | 0.81% | 1.00% | 0.64% | 0.93% | 0.32% | 0.02% |
| 2,500-10,000 | 81 | 379247 | 0.12% | 0.95% | 1% | 0.83% | 0.97% | 0.44% | 0.00% |
| 10,000-50,000 | 35 | 702078 | 0.23% | 0.98% | 1% | 0.92% | 1% | 0.81% | 0.01% |
| > 50,000 | 9 | 1666689 | 0.54% | 0.99% | 1% | 0.97% | 1% | 0.96% | 0% |
Source: National Broadband Map Data
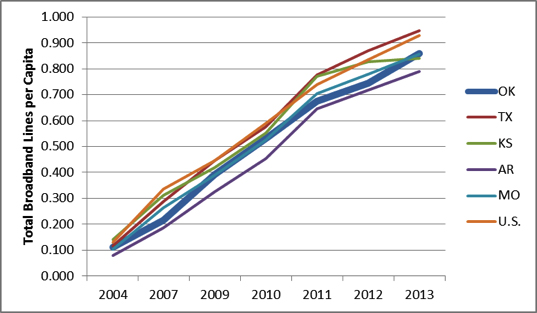
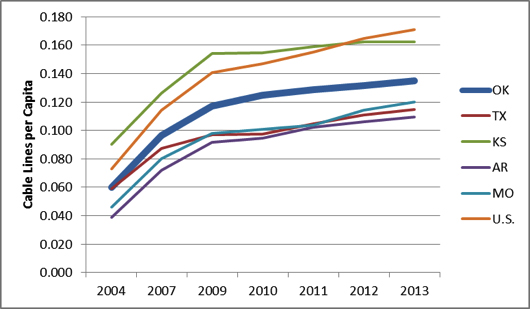
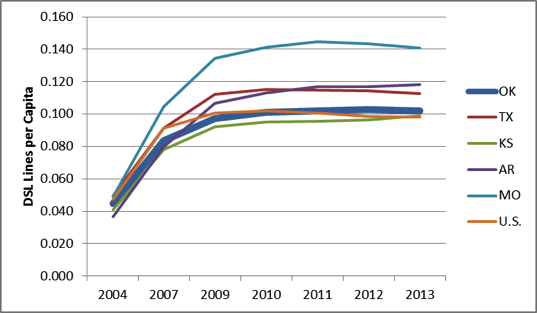
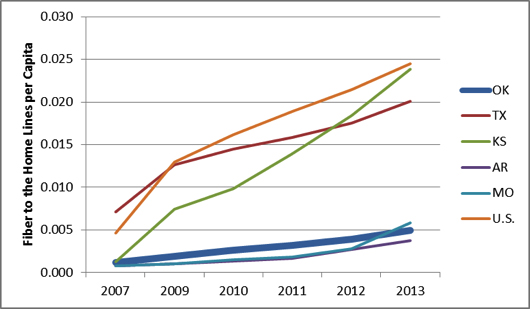
Figure 7 displays the growth in lines per capita for different types of broadband technology during the period 2004 to 2014. These charts show that, in terms of total broadband lines per capita, Oklahoma has seen similar trends as those displayed by most of its neighbors and the nation. It is worth noting that the number of broadband lines per capita is quickly approaching one – meaning that everyone would have a broadband connection. However, as the other figures show, most forms of wired broadband (cable and Digital Subscriber Lines, or DSL) have effectively leveled off, with the continuing growth being due to increases in mobile Internet (i.e. smartphones). Interestingly, in the most technologically advanced category, Fiber to the Home (speeds of 100 mbps or more), Oklahoma has seen very little growth when compared to some of its neighbors and the national average. There are some notable exceptions, however – the town of Sallisaw, OK was an early adopter of Fiber to the Home technology back in 2005 (refer to Oklahoma Cooperative Extension Fact Sheet AGEC-1000 for more details on their story).
Figure 7A,B,C,D: Broadband Lines per Capita in OK and Neighboring States, 2004 – 2013. Source: FCC Internet Access Status Reports, 2004 – 2014.
Broadband Costs
While Oklahoma-specific costs of broadband access are not readily available, Horrigan (2010) reports a national average monthly cost of $41, although those that “bundle” Internet with other services pay only $38. Stand-alone broadband service was estimated to cost $46 monthly.
Reasons for Non-adoption
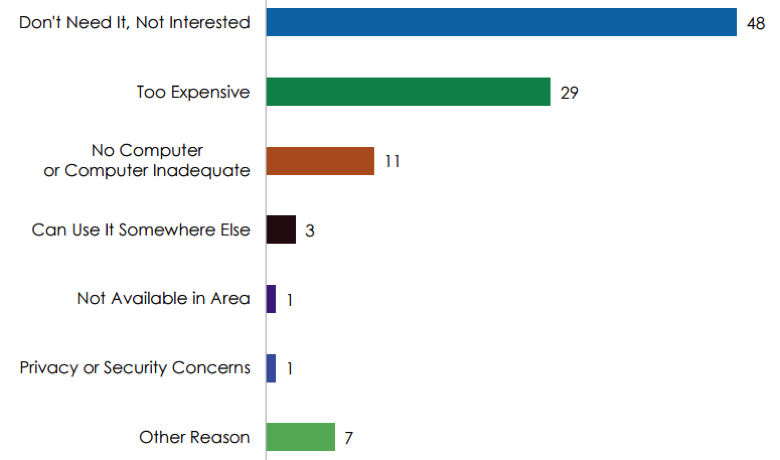
Some surveys have specifically asked respondents why they do not adopt broadband access at home. Figure 8 summarizes the results given by non-adopting households across the nation in 2012. The primary reason cited was a lack of need or interest, followed by both the cost of service and the lack of an adequate computer. The percentage of households citing “not available” is minimal; this corresponds to the high levels of basic (i.e. 3 mbps) availability depicted in the National Broadband Map. Whitacre et al. (2015) find similar patterns in exploring reasons for the rural – urban broadband divide, and suggest that future policies to increase adoption should be more demand-oriented (as opposed to infrastructure-oriented).
Figure 8. Reasons for Broadband Non-adoption, 2012. Source: ESA and NTIA, 2014.
Wireless Broadband Infrastructure
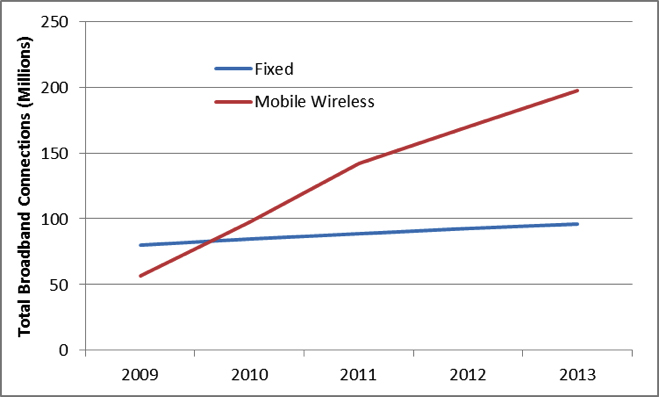
One striking change that has occurred in recent broadband reports is the rapid increase in households reporting to have a mobile wireless connection to the Internet. Figure 9 demonstrates this trend. While growth in fixed (wired) connections only increased from 80 million total lines to 96 million total lines between 2009 and 2013 (a 20 percent increase), wireless connections increased from 56 million to 197 million (a 250 percent increase). Thus, wireless broadband connections now dramatically outnumber the total amount of fixed connections. Nearly 2/3 (64 percent) of all Americans own a smartphone as of 2014 (Smith and Page, 2015). For the vast majority of households, these mobile connections are an addition to a household’s broadband portfolio. In fact, only 10 percent of smartphone users had no broadband service at home other than their smartphone data plan in 2014 (Smith and Page, 2015). Thus, while the growth in mobile wireless is impressive, its significance to the total broadband adoption picture is limited.
Figure 9. Total Fixed and Mobile Wireless Connections, 2009-2013. Source: FCC Internet Access Status Reports, 2009 – 2014.
Summary
Oklahoma’s household broadband adoption rate in 2013 was similar to the nation as a whole, however, the rural/urban gap of more than 20 percentage points is among the highest in the nation. There are clear discrepancies across the state in terms of broadband adoption rates, with households in the southeast typically displaying some of the lowest in the state. While overall access to “basic” (3 mbps download) broadband speeds is good across the state, fewer than half of the state’s population in towns of less than 10,000 residents have access to the new FCC definition of broadband (25 mbps download). The past five years has seen dramatic growth in smartphone use, but most broadband users continue to have a wired connection as well. Finally, most households that have chosen not to adopt do not see the need for broadband, suggesting that efforts to increase future adoption rates will have to address this demand-side issue.
References
Economics and Statistics Administration and National Telecommunications and Information Association (ESA and NTIA). Exploring the Digital Nation: Embracing the Mobile Internet. October 2014.
Federal Communications Commission, Industry Analysis and Technology Division. Internet Access Services: Status as of December 31, 2013. October 2014.
Horrigan, John. Broadband Adoption and Use in America. OBI Working Paper Series No. 1. February 2010.
PEW Internet and American Life Surveys.
Smith, Aaron and Dana Page. 2015. U.S. Smartphone Use in 2015. PEW Research Center.
Whitacre, Brian, Bill Baker, Keith Skelton, and Shannon Vann. Rural Broadband Success Story: Sallisaw – A Fiber Optic Network for the Ages. Oklahoma Cooperative Extension Service Fact Sheet AGEC-1000.
Whitacre, Brian, Roberto Gallardo, and Sharon Strover. 2014a. “Broadband’s Contribution to Economic Growth in Rural Areas: Moving towards a Causal Relationship.” Telecommunications Policy 38(11): 1011-1023.
Whitacre, Brian, Roberto Gallardo, and Sharon Strover. 2014b. “Does Rural Broadband Impact Jobs and Income? Evidence from Spatial and First-Differenced Regressions.” The Annals of Regional Science 53(3): 649-670.
Whitacre, Brian, Sharon Strover, and Roberto Gallardo. 2015. “How Much Does Broadband Infrastructure Matter? Decomposing the Rural – Urban Adoption Gap with the Help of the National Broadband Map.” Government Information Quarterly.

