Assessing Potential Forage Production Using the NRCS Web Soil Survey
Assessing forage production is key for developing a successful livestock operation. Proper formulas using available forage as input are necessary to determine the animal herd that a specific operation can support without overstocking or understocking pastures. Even though the best forage production estimation is done by on-site measurements and observations, producers are now able to estimate the potential forage productivity of their land prior to any on-site assessment. This is possible because the Web Soil Survey (WSS) developed by Natural Resources and Conservation Systems (NRCS) provides to anyone with a computer and internet access detailed soil, ecology, and plant productivity information for 95 percent of the US. This factsheet will show how to access major soil and plant information from WSS for potential forage production assessment for any particular site in the US. This preliminary site assessment is a useful planning tool for extension educators, consultants, and managers to start a forage and livestock management discussion with landowners. Keep in mind that it will only display the potential forage productivity based on soil type, average weather, and predicted plant communities. Previous land management adopted can change the forage productivity of a specific site; therefore, the WSS assessment will never replace on-site assessments that estimate the actual forage productivity. For more information on estimating on-site forage availability:
- access the factsheet: PSS-2594 Plan Grazing Management Using the Oklahoman Grazing Stick
- download the GrazeOK App available at App Store and Google Play store for IOS and Android phones, and
- visit the Youtube Channel: OSU Forage Systems and view the videos related to measuring forage availability.
This factsheet will focus on describing specific tools available in WSS to estimate on-site forage availability without any previous on-site measurements and observations. For more detailed instructions, access the official WSS tutorial.
Getting Started with Web Soil Survey
- Go to the website.
- Click on the bottom START WSS icon

- After clicking it, you will be directed to theWSS opening screen.
Finding your Site/Area of Interest (AOI)
In the right column under the tab Area of Interest (AOI), the site can be located by either “Search” (A), “Area of Interest” (B), or “Quick
Navigation” (C). Click the arrows to display details of a specific choice.
- Search (A): Locate sites based on key words. You can refine your search by selecting a specific “Search Type” in “Advanced Search.”
- Area of Interest (B): Insert shapefiles which were previously created on WSS or in any other software such as ArcGIS and Google Earth.
- Quick Navigation (C): Search sites by different options as show in Figure 1.
Figure 1. Area of interest locator panel.
“Latitude and Longitude” (c.1) is a fast alternative way for finding your AOI.For using this option:
- Find your AOI in Google Earth, which contains updated imagery and a user-friendly interface.
- Convert the Google Earth lat/long to one of the WSS acceptable formats. For example:
Google Earth: 36°04’57.35’’ N, 97° 10’36.21’’ W converts to WSS acceptable format:
36:04:57.35N 97:10:36.21W. Click on help
for checking all acceptable lat/long formats.
- Click on View to display the selected AOI in the “Area of Interest interactive Map,” depicted in Figure 2.

Figure 2. Area of interest interactive map.
Creating an AOI
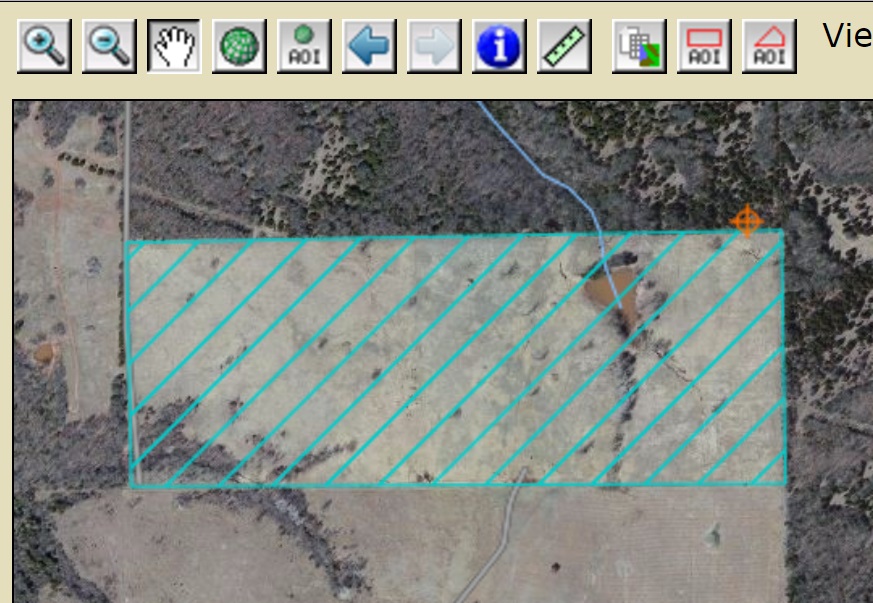
After displaying the AOI on the map screen, mark the boundaries of your site using the Tools “AOI by Rectangle” (D) or “AOI by Polygon” (E).
It is preferable to use the “AOI by Polygon” (E) because it allows you to draw more complex and precision-shaped AOIs. For creating polygons:
- Click on “AOI by polygon” (E) to activate it.
- Place the cursor + at one of the AOI edges, mouse left click, move the cursor + to the next edge, and mouse left click again. Repeat this until the cursor reaches the last unclicked edge. Then, double left click on the last unclicked edge.
- The AOI Area (F) will be created and displayed in blue after double-clicking.
Exploring the Soil Map Tab
After the AOI is generated, click on the tab Soil Map (Figure 3). It will display the “Soil Map” (G) of your AOI followed by the “Map unit Legend” (H) in the left column. By clicking any “Map Unit Name” (h.1), the “Report – Map Unit Description” for the selected map unit will pop up. This description contains information such as mean precipitation, mean temperature, frost-free period, slope, soil profile and soil depth.
Figure 3. Soil map tab overview.
Exploring the Soil Data Explorer Tab
Click the tab Soil Data Explorer, followed by the sub-tab Suitabilities and Limitations for Use. Expand the “Vegetative Productivity” tab (Figure 4) by clicking the arrow located at the right side of the column.”
Figure 4. Vegetative productivity ratings.
The “Vegetative Productivity” tab contains several options. For pastures and rangelands (our focus), the most relevant options are:
- “Range Production” (H) for native sites, which are based on rainfall level, i.e., “favorable, normal, or unfavorable year.”
- “Yields” (I) for introduced pastures in two water regimes “irrigated and non-irrigated”.
Both options have two versions: “component and map unit.” For Oklahoma, it is most
likely that the information will be displayed in the “component” version. The “Yields”
(I) contains different crop options which can be selected at the “Basic Options (i.1)”
drop-down menu by clicking
.
The AOI depicted in the previous figure is a non-irrigated, introduced bluestem field;
therefore, we selected the proper option for this case (Figure 4). After selecting
your choice, click View Rating to display your option. For more detailed information on our specific choice click
and/or View Description.
After processing, the Vegetative Productivity Map will be displayed. The production yield may vary and will be displayed within the results. The most common units are pounds per acre, tons per acre, or animal unit month (AUM). Following our example (Figure 5), the introduced bluestem productivity map (J) is shown, followed by the productivity table (L) where “Rating” is the amount of introduced bluestem in animal unit months (rule of thumb: 1 AUM = 780 lbs of forage).
Figure 5. Vegetative productivity map and table.
The forage productivity values retrieved from WSS as shown above can be used to preliminary calculations. For proper calculations, refer to PSS-2871 Stocking rate The Key to Successful Livestock Production. Furthermore, keep in mind, that all productivity displayed by WSS is the potential productivity, assuming a high level of management. It is recommended to take notes of the description that follows every table. This contains information that describes the limitations of the estimated yield values.
The sub-tabs Soil Properties and Qualities and Ecological Site Assessment are two valuable sources. The sub-tab Soil Properties and Qualities contains information such as soil pH, electrical conductivity (proxy for soil salinity), soil erosion factors, potential soil available water to plants, soil texture, soil bulk density (proxy for soil compaction), etc. Those data are important when selecting for proper forage selection and management. Furthermore, the Ecological Site Assessment sub-tab contains information regarding native species composition or the native plant species that can be determined for the selected AOI, assuming AOI that is kept native.
Downloading the Final Report
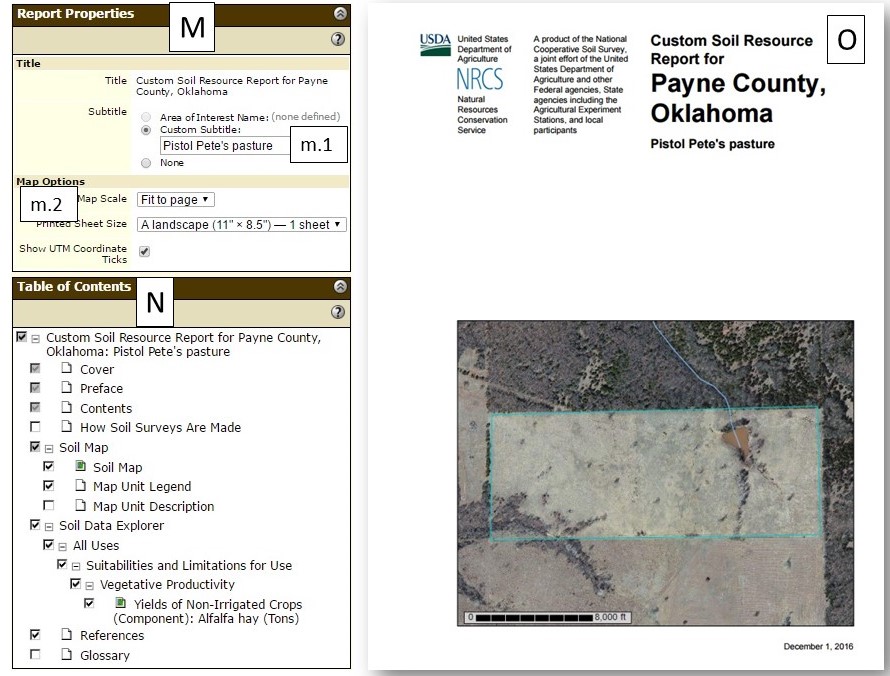
For any data retrieved by pressing view rating, regardless of the tab/sub-tab, you can add that data to your final report by clicking Add to Shopping Cart located at the upper right corner of the active tab. Then, click in the tab Shopping Cart (Free). The “Report Properties” (M) and “Table of Contents” (N) will be displayed in the left column (Figure 6). If desired, customize your sub-title (m.1), map size (m.2), and table of contents. Then, click on Check Out located at the upper corner of the current tab, select “Get Now” from the “Delivery Options” window, and hit “OK.” The report will pop up in a new tab of your internet browser.
Figure 6. Report Download Options panel and Final Report.
Keep in mind, the final report is very useful for preliminary planning. However, on-site assessments and measurements are essential for an accurate forage estimation.
Alex Rocateli
Forage System Extension Specialist
Laura Goodman
Range Extension Specialist


