Assessing Drought Damage in Perennial Grass Pastures
Tools for assessing pasture persistence following drought are limited. University of Nebraska researchers developed a frequency grid for measuring stand (seedling) establishment in perennial grasslands that can be modified for use at spring green up to estimate stand damage following drought.
This method uses a 5 x 5 grid from a section of a cattle panel partitioned into 25 small (6 x 8) subunits (Figure 1). Each subunit of the example grid is 48 square inches. The total area of the 30 inch x 40 inch grid is 1200 square inches.

Figure 1. Example of a 5x5 frequency grid constructed from a used cattle panel.
This ‘frequency grid’ is a user-friendly method for estimating drought damage in summer pastures. Management practices such as weed control, phosphorus fertilization, and grazing deferment may be necessary for pasture recovery following drought, and the results of the frequency grid assessment can be used to develop post-drought pasture management plans rather than simply recommending a reduction in stocking rate.
Approach
Determining stand damage is a relatively straightforward process, especially if accurate estimates of stand density were collected prior to the drought. It is important to take a minimum of 16 random readings in each pasture using the previously described frequency grid.
To use the frequency grid, count the number of squares that contain a desirable live (green) plant. Any portion of a desirable live plant within a square counts as “1” plant regardless of the number of plants within each square. Weeds can be counted separately to estimate weed pressure.
The number of subunits with live plants from all four counts added together should result in a maximum score no greater than 100 and a minimum score of 0. This process is repeated three more times. The four numbers are then averaged to determine a percent stand count.
An example is provided in Table 1. The first four numbers within each group are the number of live plants counted. These are added together to estimate the stand count for that group of readings (this is the bold-faced value within each group). These four stand counts are then averaged together to estimate stand frequency percent for the pasture. In this example, the stand frequency is 50 percent.
Table 1. Example of determining stand damage due to drought.
| Group 1 | Group 2 | Group 3 | Group 4 |
|---|---|---|---|
| 11 | 13 | 14 | 14 |
| 10 | 12 | 12 | 9 |
| 15 | 15 | 12 | 11 |
| 14 | 12 | 16 | 12 |
| 50 | 52 | 54 | 46 |
| % Stand | 50 |
Drought damage to perennial pastures can be separated into three classes:
Fully functional = stand frequency greater than 70 percent,
Damaged = stand frequency between 40 and 70 percent, and
Severely damaged = stand frequency less than 40 percent.
Although these estimates can be adjusted based on individual preferences, they offer a starting point for developing a plan for pasture recovery. The pasture described in Table 1, for example, would be classified as damaged.
Stand Damage and Recovery
Fully functional pastures (stand frequency greater than 70 percent) should recover quickly with weed control, proper soil fertility, and deferred grazing or harvest once satisfactory growing conditions return. Complete recovery in these pastures may require one to two months of uninterrupted growth.
Pastures that are damaged (stand frequency between 40 percent and 70 percent) should fully recover with weed control, proper soil fertility, and deferred grazing or harvest (Figures 2, 3, and 4). Past management practices likely have contributed to the pasture response to drought. There are many tillers and seed from some species that will aid in stand recovery. If these stands remain thin into the fall, it may be preferable to overseed with an adapted pasture legume or winter annual grasses. Complete recovery in these pastures may require two to three months of uninterrupted growth.
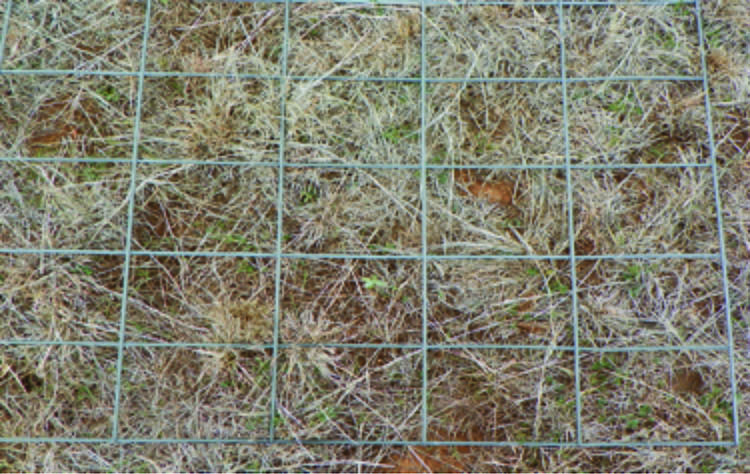
Figure 2. Dormant Old World bluestem pasture with drought damage
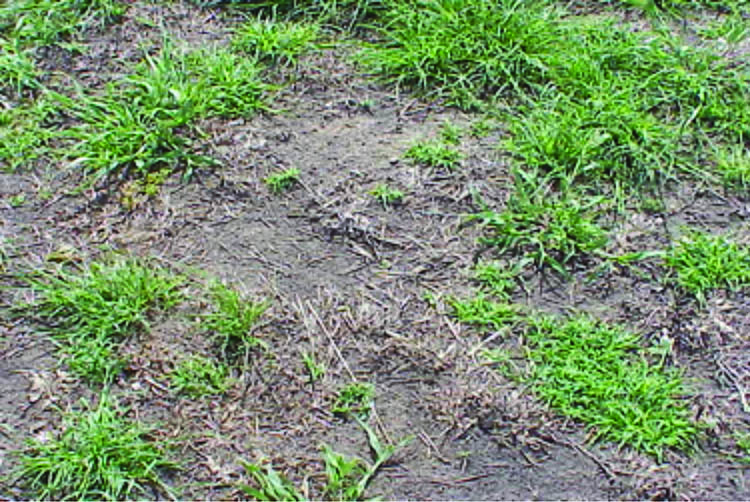
Figure 3. Old World bluestem pasture with damage following emergence.
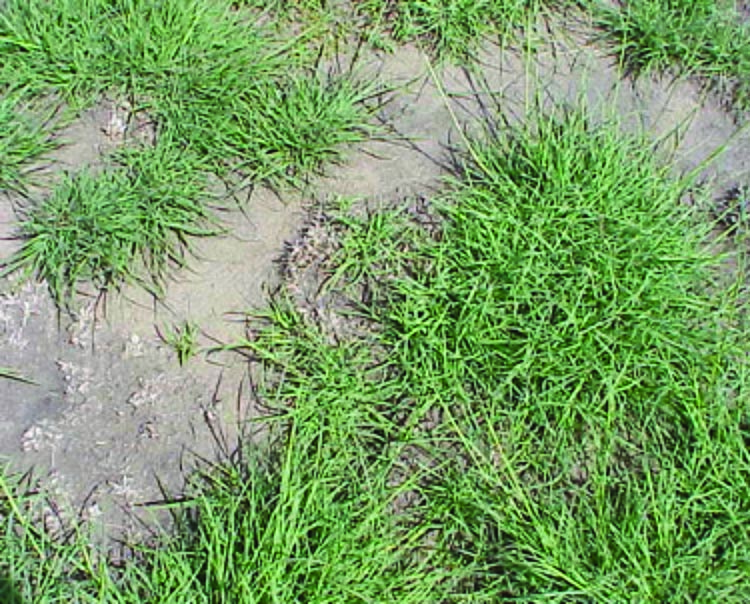
Figure 4. Weeping lovegrass pasture with damage following emergence.
Severely damaged stands (stand frequency less than 40 percent) are going to require patience and precipitation for adequate recovery (Figures 5 and 6). Similar to the other drought-damaged pastures, these should also fully recover with weed control, proper soil fertility, and deferred grazing or harvest.
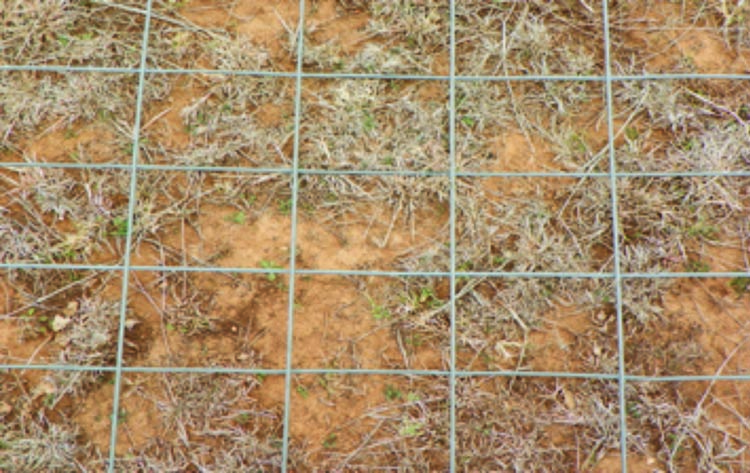
Figure 5. Dormant Old World bluestem pasture with severe drought damage.
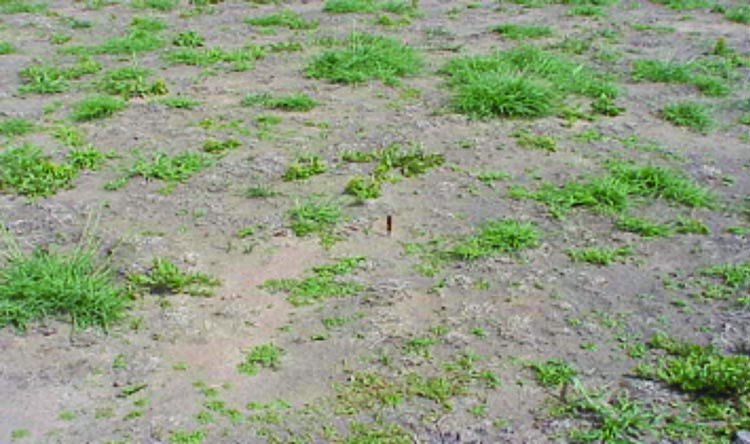
Figure 6. Old World bluestem pasture with severe damage following emergence.
There are tillers and seed from some species that will aid in stand recovery. If these stands remain thin into the fall, it may be preferable to overseed with an adapted pasture legume or winter annual grasses. It may take a year or longer for these pastures to fully recover.
Management Practices Promoting Pasture Recovery Following Drought
Aggressive weed control: Grassy weeds can be grazed, but broadleaf weeds should be chemically controlled early.
Additional fertilization: Additional phosphorus should be considered to stimulate proper root growth and plant function.
Deferred grazing or harvest: It is important that these drought damaged pastures are not grazed too early to allow time for adequate root growth and re-establishment.
Additional Application
It is important to move toward long-term monitoring of pastures so that baseline information for stand frequency can be developed. When monitored on a yearly basis, this can provide a reference point from previous years to track pasture trends. This will enable a true estimate of stand loss by simply subtracting the current year’s measurement from the previous year.
Daren D. Redfearn
Extension Forage and Pasture Management Specialist
