Annual Research 2024 Summary of the Department of Animal and Food Sciences
- Jump To:
- Forward
- Effect of Finishing System
- Recognizing Affective States in Equine
- Evaluating the Reranking and Performance Variation
- OSU Cowculator
- Using Gas-Flux Data
- Effects of Implant Strategy
- Effect of Dried Distillers Grains Cubes
- Factors Affecting Growth
- Veterinary Shortage
- Neogen Igenity Beef Index Scores
- Effects of Feeding NutraGen
- Meat Quality and Palatability Traits
- Cutability and Cutout Percentages
- Meat Color
- Tallgrass Prairie in Central Oklahoma
- Dietary Protein Levels and Growth
- Sources
Forward
June 27, 2024
To: Livestock Producers, Researchers, Educators and other Stakeholders of the OSU
Department of Animal and Food Sciences.
RE: 2024 Annual Research Summary of the Department of Animal and Food Sciences
We are pleased to share research summaries and updates from Animal and Food Sciences
faculty, graduate students, as well as Area Extension Specialists, and County Extension
Educators. Whether basic or applied, the mission of our research program in the Department
of Animal and Food Sciences is to solve problems and capitalize on opportunities in
animal agriculture, companion animals, and the food industry.
This report summarizes a wide array of research activities conducted at our livestock units, laboratories, and in some cases, on farms and ranches around the state. Our faculty are working hard to secure funding to support an aggressive research program. In fact, during the 2023 and 2024 fiscal years, the Department secured $7.5 million in grant support. We are grateful for the tremendous support we receive each year from industry partners and funding agencies.
Perhaps an underappreciated benefit is the training our 77 graduate and many undergraduate students receive as they contribute to research efforts. These graduates will become leaders throughout the livestock and food industries in the years to come.
We hope you find this research report useful and informative.
Sincerely,
David Lalman
Extension Specialist for Beef Cattle
Paul Beck
Extension Specialist for Beef Nutrition
Effect of Finishing System
Effect of Finishing System on Growth, Efficiency, and Carcass Quality of Dairy × Beef Cross Steers
Ally Grote10, Blake K. Wilson10 and Olivia Genther Schroeder4 Troy Wistuba4 and Paul Beck10
Justification and Actions
The use of beef semen in dairy herds has become common. This is because heifer sexed semen can be used for mating the highest producing females for replacement heifer production, while females of lower genetic merit can be bred to beef sires to start new lactations. The resulting dairy-beef crosses can offer improved genetic merit for finishing performance and efficiency compared to straight-bred dairy steers. There is little work investigating post-weaning finishing systems for these dairy-beef crosses. Research was conducted to determine the effect of calf-fed (FIN) or yearling (GRW/FIN) finishing systems on the performance of dairy-beef crossbred steers at Willard Sparks Beef Research Center in Stillwater, Oklahoma. Dairy-beef cross steers were acquired at 12 weeks old and kept in drylot at Willard Sparks for finishing (FIN) or placed on high-quality pasture and supplementation for five to six months before returning to the center for finishing (GRW/FIN). At Willard Sparks, steers within each finishing system were sorted by body weight (BW) into four to five head per pen. Steers in FIN were grown on successively higher energy growing diets through day 112 and were transitioned to an enhanced roughage finishing diet on day 112. A final low roughage finishing diet was fed to FIN steers from day 224 to slaughter. Steers in GRW/FIN were stepped up to the final finishing diet when they reached 894 ± 14 pounds.
Findings
Steers in GRW/FIN had an average daily gain (ADG) of 2.18 ± 0.04 pounds while on pasture for approximately six months. Upon arrival into the feedlot, steers in FIN weighed 279 ± 21 pounds, and GRW/FIN weighed 687 ± 15 pounds (P < 0.01). Steers in FIN weighed 183 ± 18 pounds more than those in GRW/FIN when stepped to the finishing diets (P < 0.01), but at shipping, steers in FIN weighed 59 ± 18 pounds less than GRW/FIN steers. While steers in the GRW/FIN were on feed for fewer days (189 vs 312) compared to FIN steers (P < 0.01), steers in GRW/FIN were 65 days older at slaughter. Steers in GRW/FIN had an overall ADG in the feedlot of 4.22 ±0.03 pounds, whereas FIN had an overall ADG of 3.65 ± 0.03 pounds (P < 0.01). Overall, dry matter intake (DMI) was 5.9 ± 1.3 pounds greater (P < 0.01) for steers in GRW/FIN. Steers in GRW/FIN had a feed-to-gain ratio that was 0.61 ± 0.25 greater (P < 0.02) than those placed directly into a finishing system. There were no differences in USDA Yield Grade (P = 0.10), marbling (P = 0.27), ribeye area (P = 0.55), or back-fat thickness (P = 0.33) between finishing systems. Steers in FIN had a greater (P < 0.01) dressing percentage by 1.53 ± 0.32%. Steers in GRW/FIN received a quality grade of choice and prime 13 ± 6% more than FIN steers. Hot carcass weight for FIN steers was 33 ± 12 pounds lighter (P < 0.01) than for GRW/FIN. Dairy-beef hybrid steers exhibited increased performance when backgrounded on high-quality pasture.
This project was supported by Agriculture and Food Research Initiative competitive grant award no. 202268008-37102 from the U.S. Department of Agriculture. Support was also provided by the Dennis and Marta White Endowed Chair in Animal Science.
| Performance - Item2 | Finishing System1 FIN |
Finishing System1 GROW/FIN |
SEM3 | P-value |
|---|---|---|---|---|
| Initial BW, lbs | 279b | 687a | 15.4 | <0.01 |
| Reimplant BW, lbs | 1078a | 895b | 13.9 | <0.01 |
| Shipping BW, lbs | 1427b | 1485a | 11.9 | <0.01 |
| ADG, lbs·hd | 3.65b | 4.23a | 0.034 | <0.01 |
| DMI, lbs·hd-1·d-1 | 22b | 28a | 0.9 | <0.01 |
| DOF | 312a | 189b | 2.9 | <0.01 |
| F:G | 5.94b | 6.55a | 0.169 | 0.02 |
| Age at Slaughter, d | 406b | 471a | 1.479 | <0.01 |
| Carcass Quality - Item2 | Finishing System1 FIN |
Finishing System1 GROW/FIN |
SEM3 | P-value |
|---|---|---|---|---|
| HCW, lbs | 863b | 896a | 8.3 | 0.01 |
| DP, % | 63.7a | 62.2b | 0.25 | <0.01 |
| Yield Grade | 2.94 | 3.09 | 0.058 | 0.10 |
| Marbling Score | 467 | 489 | 12.4 | 0.27 |
| BFT, in | 0.50 | 0.52 | 0.014 | 0.33 |
| REA, in2 | 14.0 | 14.1 | 0.13 | 0.55 |
| QG, % choice and prime | 80.8b | 93.9a | 4.53 | 0.02 |
1 Treatments consisted of calf-fed (FIN) or yearling (GROW/FIN) finishing systems.
2 BW = body weight; ADG = average daily gain; DMI = dry matter intake; DOF = days on
feed; F:G = feed to gain ratio; HCW = hot carcass weight; DP = dressing percentage;
BFT = back-fat thickness; REA = ribeye area; QG = quality grade.
3 Standard error of the mean. a, b Within a row, means with different subscripts differ
at P < 0.05.
Recognizing Affective States in Equine
Recognizing Affective States in Equine: An Educational Intervention
Amber Wells10 and Kris Hiney10
Justification and Actions
With the continued drive to improve animal welfare, the need for formal education on the subject increases. The increasing awareness of emotions in non-human species has provided an opportunity to consider emotions in management and interactions with animals. The focus of understanding affective state, also known as emotional state, is not only to minimize harm but to optimize the animal's mental and physical health and their performance. Interpreting equine behavior is a key component of assessing positive or negative equine well-being. Most horse owners fail to consider the cognitive domain when assessing well-being and rely solely on physiological measures (hoof condition, body condition score or soundness) to determine the horse’s welfare. For this reason, an online educational tool focused on the mental domain and affective states known as Recognizing Affective States in Equine (RAiSE) was created by the authors with the goal to improve the assessment of equine well-being. An assessment of the understanding of equine affective state was conducted with an online questionnaire via Qualtrics both before and after the completion of RAiSE by participants. The survey was distributed to an email listserv of participants from various locations in the United States who had previously completed at least one online course through the Extension Horses group. After completing the initial questionnaire, participants were asked to complete the RAiSE course within a 30-day period which included modules on affective states, equine communication, the senses, identifying abnormal states and utilizing affective state in assessing management. Following the course, participants took a post-course questionnaire and were presented with the option to sign-up for a follow-up interview. The objective of the research study was to evaluate the effectiveness of RAiSE as an educational tool as well as compare perceptions of participants.
Findings
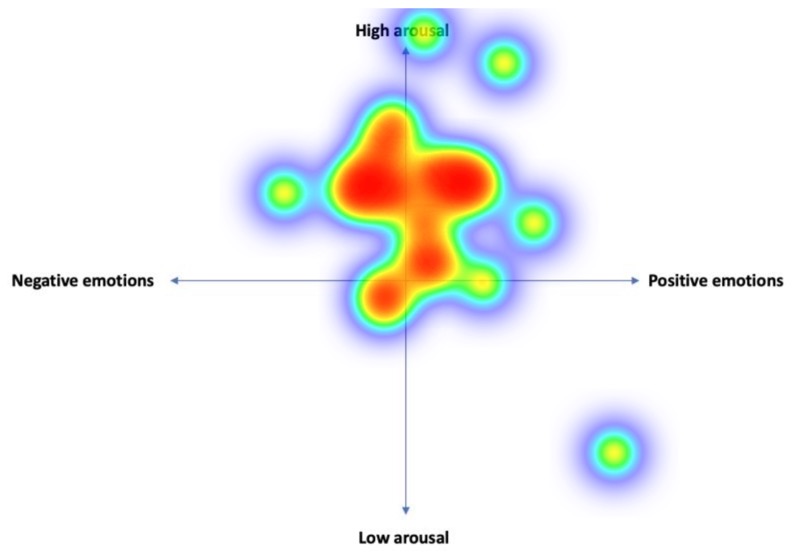
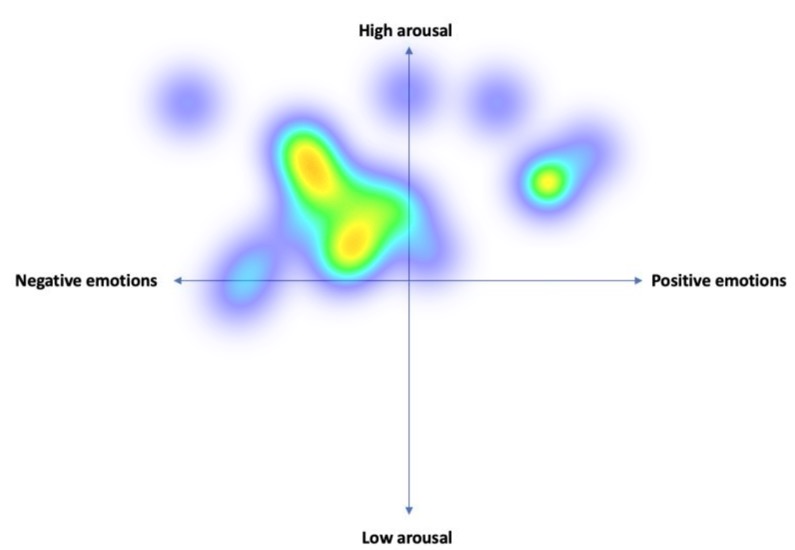
Information regarding participants' demographics, horse handling experience and frequency of horse interaction were collected. Videos of 20 horses displaying various affective states were provided. Co-authors coded behaviors to consensus in positive or negative valence and high or low arousal. After viewing each video, the participant placed a dot on a graphical representation of the circumplex model of valence and arousal according to their perceived impression of the affective state of the horse. Coordinates of individual responses, as well as the density of all responses, was generated via the heat map function of Qualtrics. Twenty-one of the participants that completed the pre-survey also completed RAiSE. After completing RAiSE, participants were asked to reassess the same 20 videos as from the initial survey and again plot their interpretations of affective state. At the end of the questionnaire, participants were asked to evaluate the course with their overall satisfaction. Of the 21 participants, 74% self-reported as frequent horse handlers, interacting with horses four or more times a week. Following the completion of RAiSE, 69% of participants correctly interpreted the affective state of the horses depicted in the 20 videos compared to an initial accuracy rate of 61%. Differences between pre and post test data for both valence and arousal for individual videos were analyzed using a paired t-test. Interpretation of valence differed in three of the videos (P < 0.05) between pre and post course participation. Interpretation of arousal was not different for any of the 20 videos. In Figure 1, rated by co-authors as negative valence/high arousal, a horse showed anxiety, quick foot falls and an elevated head in a competition environment. Interpretation of valence of the video underwent a notable shift with 43% of participants indicating negative valence in initial interpretation to 76% of participants selecting negative valence in the post assessment interpretation (P < 0.0013). Regarding course satisfaction, of the 21 participants, 68.18% strongly agreed that they were satisfied with the content of the online course. Ten out of the 21 participants were selected for an in-depth follow-up interview, and when asked the question, “Considering your experience with the course, would you recommend it to others?” all 10 participants agreed that they would recommend it. Additionally, when asked, “What specific changes in your behavior or habits do you hope to achieve as a direct result of taking this course?” all 10 expressed their intent to modify their behavior or had already initiated changes. Assessment of equine behavior often requires familiarity with the normal behavior patterns of the horse to correctly interpret indicators of positive/negative affective state. Evaluating affective state is critical to determining equine welfare. Using RAiSE as an educational tool represents a new way to improve assessment of affective state and work toward a better life for horses.
Figure 1. Heat map of a circumplex model showing participants' initial responses to the video .
Figure 2. Heat map showing participants' responses to the video after completing RAiSE.
Evaluating the Reranking and Performance Variation
Evaluating the Reranking and Performance Variation Between Long-Stem Unprocessed Hay and an Energy-Dense Diet
Emma Briggs8, Mikayla Moore8, Kade Horton8 and Justin Crosswhite8 Andrew Foote8, Carla Goad8, Megan Rolf8 and David Lalman8
Justification and Actions
Within the cow-calf sector, feed represents 51% of operating costs for the average producer. As a 5% improvement in feed efficiency can yield a four times greater profit impact than a 5% improvement in average daily gain (ADG), improving feed utilization would have a wide-reaching impact on United States. food security and cow-calf enterprises. Substantial progress has been made in evaluating the postweaning performance and efficiency of animals consuming energy-dense mixed diets. However, it is unclear whether forage utilization efficiency has improved over time. The objective of this study was to evaluate weight gain, feed intake and feed efficiency in beef heifers while consuming an unprocessed grass hay diet followed by a mixed diet with 50% concentrate and 50% ground hay.
One hundred nine yearling Angus and Angus x Hereford heifers (initial body weight = 679 ± 66 lb) were subject to sequential study periods using SmartFeed individual feed intake measuring technology (C-Lock Inc., Rapid City, South Dakota) in drylot pens at the Oklahoma State University Range Cow Research Center. The first study period (HAY) was initiated in July each year with a 21-day adaptation period and a 70-day data collection period. Bermudagrass hay (≥ 10.1% CP and ≥ 56% TDN) and a salt/mineral/vitamin supplement were offered on an ad libitum basis throughout the experiment. The second study period was initiated on day 92, including 14 days of adaptation and 42 days of data collection. A mixed diet (12.5% CP, 45% NDF and 65% TDN) consisting of 50% chopped bermudagrass hay, concentrate feeds and a liquid supplement containing minerals and vitamins (TMR) was offered on an ad libitum basis. In both periods, weights were recorded every 14 days, and ADG was calculated by regressing body weight over time. Dry matter intake (DMI) and residual feed intake (RFI) were calculated at the end of each study period. Test-period average body weight and ADG were used in a multiple regression equation to predict DMI. Observed DMI was subtracted from predicted DMI to compute RFI. For RFI, cattle were classified as inefficient, average or efficient-based on 0.5 standard deviations away from the mean RFI score within each contemporary group.
Findings
Table 1 shows the means and standard deviations for DMI, ADG, and RFI for the HAY and TMR periods. Spearman and Pearson correlations for each contemporary group (year) are shown in Table 2. In both years, hay and mixed diet DMI were positively correlated. However, there was no correlation for ADG when consuming a strict, unprocessed forage diet versus a mixed, processed diet. There was no correlation between diets for RFI in year one but a weak positive correlation between diets for RFI in year two.
The results of this study suggest that ranking for feed intake within contemporary groups is positively correlated between a strict forage diet and a more energy-dense, processed diet. However, under the conditions of this experiment, there is no relationship in weight gain between the two diets. More work is necessary to determine genetic correlations and to determine if RFI is an acceptable method to rank growing cattle for forage use efficiency. Selection based on performance metrics derived from tests using high-quality mixed diets may not ensure progress in efficient forage utilization in the cattle industry.
| Trait | Year 1 | Year 1 | Year 1 | Year 1 | Year 2 | Year 2 | Year 2 | Year 2 |
|---|---|---|---|---|---|---|---|---|
| Hay | Hay | TMR | TMR | Hay | Hay | TMR | TMR | |
| Mean | SD | Mean | SD | Mean | SD | Mean | SD | |
| ADG, lb | 0.34 | 0.36 | 3.2 | 0.64 | 0.97 | 0.29 | 3.8 | 0.44 |
| DMI, lb | 14.0 | 1.8 | 21.0 | 2.7 | 16.0 | 1.5 | 30.0 | 2.2 |
| Start Age, days | 343 | 1 | 435 | 19 | 335 | 10 | 423 | 10 |
| Initial BW, lb | 677 | 67 | 732 | 32 | 701 | 55 | 802 | 2.5 |
| Trait | Year 1 | Year 1 | Year 2 | Year 2 |
|---|---|---|---|---|
| Spearman | Pearson | Spearman | Pearson | |
| Hay vs. TMR | Hay vs. TMR | Hay vs. TMR | Hay vs. TMR | |
| DMI | 0.43* | 0.48* | 0.55* | 0.48* |
| ADG | 0.16 | 0.17 | -0.15 | -0.16 |
| RFI | 0.04 | 0.04 | 0.33* | 0.27* |
*Indicates significance of p>0.05
OSU Cowculator
OSU Cowculator User Preferences
David Lalman8, Paul Beck10 and Scarlett King11
Justification and Actions
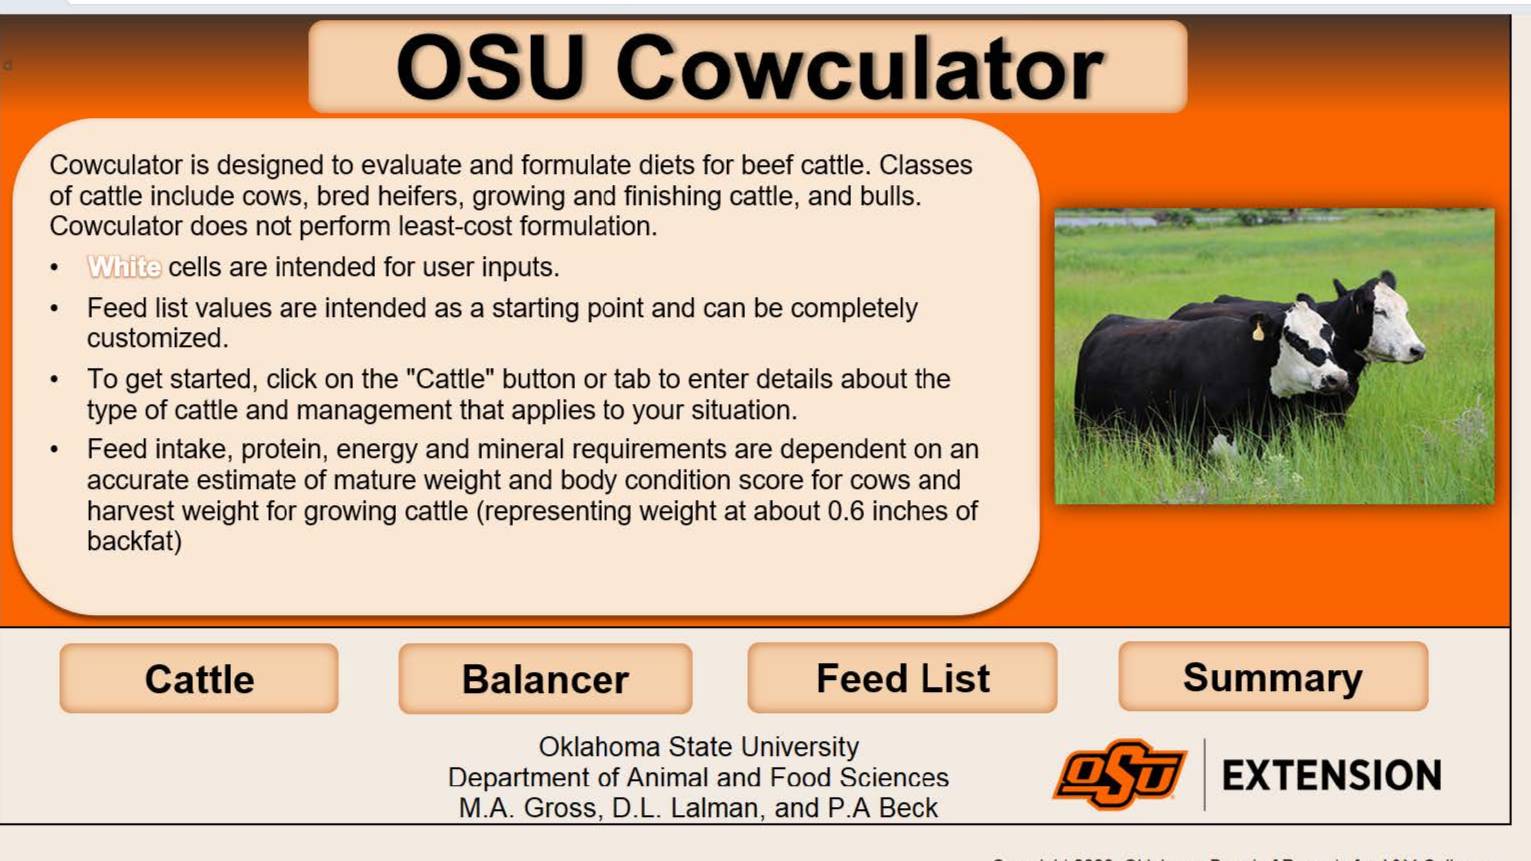
The OSU Cowculator is a spreadsheet-based model designed to assist cattlemen in making informed decisions associated with beef cattle nutrition. Animal characteristics, the feed and forage library, and diet composition can be customized to each operation or to fit specific scenarios within an operation. Animal requirements and performance predictions are based on years of research data, including the 2016 and previous versions of the National Academy of Science, Engineering, and Medicine’s Nutrient Requirements of Beef Cattle. Classes of cattle in the model include gestating and lactating cows, bred heifers, growing and finishing cattle and bulls.
The program is available to the public for free and can be downloaded at the OSU Cowculator website. The download site requests users to provide their name, email address and general geographic location (zip code). The email address is used to alert users of program updates.
A Qualtrics-based survey was developed to determine users’ perception of the program and their likes and dislikes. A link to the survey was emailed to each address available in the database and a reminder was sent 30 days later resulting in 233 responses.
Findings
During 2022, the Cowculator program was downloaded 2,090 times from 41 states and 53 countries. According to email addresses ending in .edu, the program was downloaded by faculty or students from 135 different universities or colleges in 2022. Users estimated an annual benefit of $1,500 on average for an average annual impact of $3,214,020.
Sixty percent of survey respondents identified as beef cattle producers, 16% as industry professionals (veterinarians, consultants, feed industry, etc.), 11% as extension personnel, 7% as teaching or research faculty and 6% as students.
Fifty-two percent of respondents intended to use the program primarily for a cow/calf enterprise, 33 percent primarily for growing or stocker cattle, and 15 percent primarily for finishing cattle.
Eighty-four percent of survey respondents indicated they were able to successfully use the Cowculator program to evaluate or fine-tune their beef cattle nutrition program while 16% indicated they were not successful.
Respondents were asked about their perception of the accuracy of the Cowculator performance projections and nutrient balance predictions. Sixty-nine percent indicated the program provided “mostly accurate” projections and 23% responded “very accurate.” Five percent of the respondents perceived the projections to be “marginally accurate” or “inaccurate.”
Finally, respondents indicated the two things they liked the most about the program was that it was free and easy to use. The most prominent items selected as “needs improvement” were the limited feed list and the lack of availability of a simple app version rather than the spreadsheet-based version.
Figure 1. OSU Cowculator designed to evaluate and formulate diets for beef cattle.
Using Gas-Flux Data
Using Gas-Flux Data to Estimate Dry Matter Intake for Cattle on a Grass-Hay Diet
Emma Briggs8, Amanda Holder8, Mikayla Moore8, Kade Horton8 and Justin Crosswhite8, Andrew Foote8, Carla Goad8, Megan Rolf8 and David Lalman8
Justification and Actions
Forage and supplemental feed costs represent up to 70% of the operational costs in beef cattle and therefore are an overriding factor driving profitability in the United States. Currently, the majority of feed efficiency research has been focused on growing cattle consuming an energy-dense diet with little research evaluating the efficiency measures for cattle consuming forage-based diets. Additionally, the cow-calf sector of the beef industry accounts for up to 81% of the enteric methane emissions per unit of carcass weight produced. New open-circuit gas flux technology has allowed measurement of enteric gas emissions for cattle in a pasture-based setting. If a significant relationship exists between feed intake and gas emissions, this system could be used to rank grazing cattle for forage intake and forage utilization efficiency. Therefore, the objective of this research was to evaluate the relationship between gas emissions and forage intake. One hundred Angus and Angus x Hereford heifers were used in a hay intake test consisting of 21 days for adaptation to the hay and the feeding system followed by 71 days of data collection over a three-year period. Feeders designed to measure individual animal hay intake (C-Lock Inc., Rapid City, South Dakota) were stocked at a rate of 3.6 heifers per feeder to ensure heifers had ad libitum access to hay. Throughout the study, heifers were fed unprocessed, grass hay (10.8% CP, 2.0 Mcal ME, and 56% TDN) and a salt/mineral supplement. Body weight measurements were collected every 14 days. Heifers were also used for collection of gas flux data using an open-circuit, portable, gas-quantification system (GreenFeed, C-Lock Inc., Rapid City, SD) to measure oxygen consumption, carbon dioxide production and methane production. Heat production (HP) was calculated using the Brouwer 1965 equation (HP (Mcal/d) = (3.86 × O2 + 1.20 × CO2 – 0.518 × CH4)/1000).
Findings
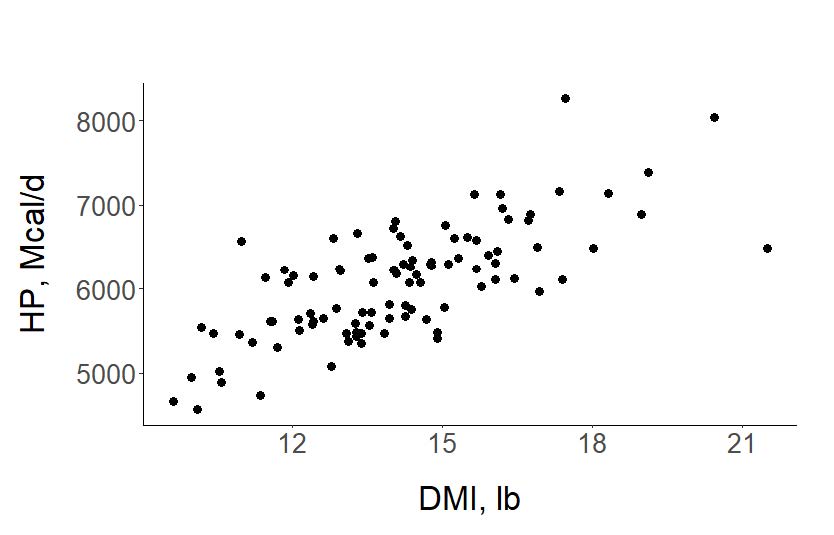
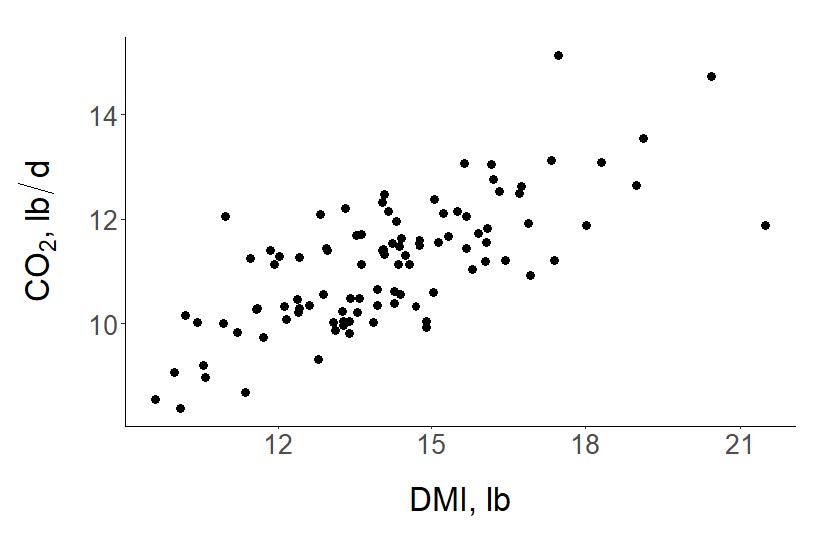
This report summarizes three years of data in an ongoing study. Phenotypic correlations of dry matter intake (DMI) with CO2, CH4, O2 and HP were 0.72, 0.49, 0.64 and 0.72, respectively. The relationships between CO2 and DMI as well as HP and DMI are shown in Figures 1 and 2. Average daily gain combined with the estimate of daily HP accounted for 58% of the variation in forage DMI. Similarly, average daily gain and CO2 accounted for 58% of the variation in DMI. Thus far, results suggest that forage intake can be predicted using the Green-Feed gas quantification system and average daily gain. Similarity of equations developed using ADG plus CO2 or ADG plus HP (which requires measurement of CO2, CH4 and O2) suggests flexibility in gas quantification methods used. In conclusion, these results suggest that there is an opportunity for using ADG plus HP or CO2 as a method to rank individual animals for dry matter intake in a forage-based system.
Figure 1. Relationship between forage dry matter intake (DMI) with calculated heat production (HP)
Figure 2: Relationship between dry matter intake (DMI) with CO2
Effects of Implant Strategy
Effects of Implant Strategy in Extended Stocker Cattle Programs and Subsequent Carcass Characteristics
T.J. Garcia10, F.M. La Manna, F. White10, K. Blue2, D. Riviera6 and Ryan Reuter10
Justification and Actions
Anabolic growth implants are a cost-effective tool to improve beef cattle performance in each phase of production, but these performance gains do not come without risk. Implants during the stocker/growing phase may decrease marbling score and quality grade, depending on the potency and number of implants. Our objective was to compare the effects of implanting stocker cattle with a potent extended-release implant (Syn-ovex® One Grower) to a single conventional grazing implant (Component® TE-G) and to a reimplant program using two of Component® TE-G on steer grazing performance and carcass characteristics. Crossbred steers from Oklahoma (n = 240; 478 lbs) and Mississippi (n = 300; 450 lbs) were randomly allocated at each location to one of the three implant treatments: Synovex® One Grower at day zero, Component® TE-G at day zero or Component® TE-G at day zero and again at day 82 in Oklahoma or day 85 in Mississippi. Steers were grazed on cool-season annual pastures with ad libitum water and mineral supplement and finished in commercial feedyards where they were implanted identically. Performance was measured by weighing cattle on calibrated scales. Carcass data included hot carcass weight, ribeye area, backfat thickness and marbling score, which was reported by the packing plant. Data were pooled across both locations and then analyzed as a completely randomized design using ANOVA methods in R (R Core Team, 2022). All tests were evaluated at the nominal 0.05 level of significance.
Findings
By design, initial body weight (BW) prior to the stocker phase did not differ among implant protocols (P = 0.93, Table 1). Gain per animal and ADG were within the expected range for these production systems but were not affected by implant protocol (P = 0.39). As a result, final BW at the stocker phase (and feedlot entry BW) was similar (P = 0.73). The stocker phase implant program did not affect hot carcass weight, ribeye area or fat thickness (P ≥ 0.55). Marbling score was the greatest in steers who received the lowest implant dose (Component® TE-G; P = 0.07). Our results indicate that not only did Synovex® One Grower and reimplanting mid-grazing fail to improve performance of steers during the stocker phase, it also negatively impacted marbling scores compared to a single Component® TE-G. Therefore, we recommend cattle grazed 150 days or less with similar forage quality and quantity to our study be implanted with a single Component® TE-G because of similar performance during the stocker phase and the minimal affect on intramuscular fat after harvest combined with the decreased costs of implants and labor. In market conditions where intramuscular fat is not valued, this recommendation should be revisited.
| Variable | Synovex ® One Grower | Component ® TE-G | Component ® TE-G re-implant | SEM | P |
|---|---|---|---|---|---|
| Initial stocker BW1, lbs | 526 | 529 | 527 | 20.3 | 0.93 |
| Final stocker BW, lbs | 844 | 844 | 849 | 14.5 | 0.73 |
| Stocker gain, lbs | 315 | 315 | 322 | 21.6 | 0.39 |
| Stocker ADG, lb/day | 1.98 | 1.98 | 2.00 | 0.13 | 0.39 |
| HCW, lbs | 884 | 886 | 879 | 31.3 | 0.55 |
| Ribeye area, inch2 | 14.3 | 14.1 | 14.3 | 0.34 | 0.68 |
| Fat thickness, inch | 0.53 | 0.53 | 0.52 | 0.07 | 0.78 |
| Marbling score2 | 408 | 425 | 410 | 5.9 | 0.07 |
1 Initial and final BW recorded after a 12-h shrink without feed or water
2 Small00 = 400
Effect of Dried Distillers Grains Cubes
Effect of Dried Distillers Grains Cubes on Performance and Supplemental Efficiency for Steers Grazing Low-Quality Native Mixed Prairie grass in Western Oklahoma in 2022
Zane Grigsby8, Paul Beck10, Charlie Worthington8 and Marty New8 Stacey Gunter14 and Dusty Turner5
Justification and Actions
Supplementation of summer grazing cattle is common in the Southern Great Plains, especially as the forage matures. As forage matures, the crude protein and energy levels decline, potentially leaving grazing cattle in need of nutrients to maintain or improve performance. Dried distillers grains (DDGS) are a viable supplementation option due to concentrated rumen degradable and undegradable protein and energy value due to the distillation process. Feeding loose DDGS can be inefficient in a pasture environment due to potential loss of product from environmental factors. This research was conducted to test the effects that increased supplementation of extruded 100% DDGS cubes have on performance and supplemental efficiency of steers grazing summer native range in western Oklahoma. Supplemental efficiency was calculated as added pounds of added gain per pound of supplement provided as compared to the unsupplemented control. This research was conducted at the Marvin Klemme Range Research Station near Bessie, Oklahoma and at the USDA Agricultural Research Service Southern Plains Experimental Range (SPER) near Fort Supply, Oklahoma. At Klemme, six pastures were allocated to three supplementation rates:
- Negative Control (NC), no supplementation
- Light Supplementation (LS), 2 pounds of DDGS cubes per day
- Medium Supplementation (MS), 4 pounds of DDGS cubes per day.
All Klemme pastures were stocked at 7 acres per head. At SPER, 12 pastures were allocated to four supplementation rates: NC, LS, MS and Heavy Supplementation/6 pounds of DDGS cubes per day (HS). All SPER pastures were stocked at 5 acres per head. All steers at both locations were uniformly implanted with 40 mg of trenbolone acetate and 8 mg of estradiol and 29 mg of tylosin tartrate (Component TE-G, Elanco, Indianapolis, Indiana). Weights were collected upon turnout in May, an intermediate date in July and a final weight in late September/early October prior to entering a finishing yard.
Findings
Results from this experiment suggest that using an extruded 100% DDGS cube to supplement steers grazing summer native range provides opportunity to accommodate a range of goals. Increased supplementation rates can aid in increased BW gain; however, increased supplementation showed a decrease in supplemental efficiency. Management strategies should be considered based on the market and what metric holds the most financial value–whether increased BW gain or increased efficiency allows for the most effective return on investment.
| BW, lbs | Klemme | Klemme | Klemme | Klemme | SPER | SPER | SPER | SPER | SPER |
|---|---|---|---|---|---|---|---|---|---|
| Item | NC | LS | MS | SE | NC | LS | MS | HS | SE |
| Initial | 584 | 585 | 580 | 9.0 | 660 | 647 | 650 | 649 | 17.7 |
| Middle | 702a | 732b | 727b | 12.4 | 787a | 845ab | 874abc | 898c | 20.1 |
| Final | 776a | 847b | 882c | 15.1 | 910a | 964ab | 998bc | 1028c | 20.8 |
| ADG, lbs per day | Klemme | Klemme | Klemme | Klemme | SPER | SPER | SPER | SPER | SPER |
|---|---|---|---|---|---|---|---|---|---|
| Item | NC | LS | MS | SE | NC | LS | MS | HS | SE |
| Early Summer | 1.78a | 2.22b | 2.24b | 0.12 | 1.87a | 2.91b | 3.29bc | 3.65c | 0.19 |
| Late Summer | 1.06a | 1.64b | 2.21c | 0.09 | 2.34 | 2.16 | 2.25 | 2.37 | 0.15 |
| Total Season | 1.41a | 1.93b | 2.22c | 0.09 | 2.04a | 2.57b | 2.83b | 3.08c | 0.11 |
| BW gain/acre, lbs | 27.3a | 0.26b | 43.2c | 1.68 | 50.1a | 63.3b | 69.6b | 75.7c | 2.7 |
| Supplemental | Klemme | Klemme | Klemme | Klemme | SPER | SPER | SPER | SPER | SPER |
|---|---|---|---|---|---|---|---|---|---|
| Item | NC | LS | MS | SE | NC | LS | MS | HS | SE |
| Efficiency1 | — | 0.26b | 0.20a | 0.03 | — | 0.27b | 0.20a | 0.17a | 0.03 |
abc Means within the same row for each location with different superscripts differ P
≤ 0.05
2 Calculated as added BW gain in lbs per lb of supplement as compared to unsupplemented
control.
Factors Affecting Growth
Factors Affecting Growth, Efficiency and Carcass Quality of Finishing Dairy x Beef Hybrids
Ally Grote10, Blake K. Wilson10 and Olivia Genther Schroeder4 Troy Wistuba4 and Paul Beck10
Justification and Actions
Sexed semen ofers dairy farmers flexibility to select their genetically best females as dams for replacement heifers. Therefore, those females with lower genetic merit can be bred to beef sires to achieve new lactations. The best management practices for beef-dairy calves may not be at the dairy, and the quality of the calves may not be adequate to ensure animal health and welfare. By identifying the best genetics and optimal management practices, producers could overcome some of these management and marketing hurdles. Research was conducted to determine factors affecting performance, efficiency and carcass attributes of dairy-beef hybrid calves. Factors considered in this analysis were pre-finishing plane of nutrition, season and breed of beef sire. Dairy × beef crossbred steer calves (3 to 7 days of age) were acquired and maintained on either a moderate or high plane of nutrition from 0 to 12 weeks of age at Land O’ Lakes Calf Milk Research Facility in Grey Summit, Missouri. Steers were transported to Willard Sparks Beef Research Center (WSBRC) in four blocks of 35 – 72 head per block (n = 211) in Stillwater, Oklahoma, at average age of 92 ± 2 days. Steers were from Holstein dairies in the Midwest and bred to predominantly Angus sires. Upon arrival at WSBRC, steers were sorted by body weight within previous treatment into four to five head pens. Steers were fed a receiving diet for two weeks before transitioning to a grower diet from day 28 to 112. On day 112, steers were transitioned to the first finishing diet. A final finishing diet was fed from day 224 to shipping.
Findings
Steers maintained on a high plane of nutrition had a greater initial body weight than those on a moderate plane of nutrition (276 ± 5 lbs vs 255 ± 5 lbs, P < 0.01). Plane of nutrition had no other effect on performance, efficiency and carcass quality (P ≥ 0.08). Steers received during the winter and spring exhibited a heavier body weight (P < 0.01) from day zero (277 lbs vs 254 lbs) through day 112 (648 lbs vs 612 lbs) than those received during the summer. While there was no difference in season for day 224 bodyweight, steers received in the winter and spring weighed 59 ± 18 lbs more at shipping than those received during the summer. Steers received during the winter and spring had an overall average daily gain of 3.60 ± 0.05 lbs, whereas those received during the summer had an overall average daily gain of 3.44 ± 0.05 lbs. While plane of nutrition before arriving at WSBRC had few effects on initial performance, season of receiving had many effects on performance, efficiency and carcass quality.
This project was supported by Agriculture and Food Research Initiative competitive grant award no. 2022-68008-37102 from the U.S. Department of Agriculture. Support was also provided by the Dennis and Marta White Endowed Chair in Animal Science
| BW, lbs - Item | Klemme - Winter/Spring | Klemme - Summer | SEM3 | P-Value |
|---|---|---|---|---|
| Initial | 277a | 254b | 5.5 | <0.01 |
| Day 28 | 350a | 311b | 7.6 | <0.01 |
| Day 112 | 648a | 612b | 8.9 | <0.01 |
| Day 224 | 1066 | 1045 | 12.3 | 0.13 |
| Shipping | 1425a | 1367b | 16.2 | <0.01 |
| ADG, lbs:hd - Item | Klemme - Winter/Spring | Klemme - Summer | SEM3 | P-Value |
|---|---|---|---|---|
| Initial to D-28 | 2.61a | 2.01b | 0.12 | <0.01 |
| D-28 to 112 | 3.56 | 3.55 | 0.10 | 0.90 |
| D-112 to 224 | 3.78 | 3.90 | 0.08 | 0.17 |
| D-224 to Shipping | 4.02a | 2.14 | 0.09 | <0.01 |
| Overall ADG, 309 days | 3.60a | 3.44b | 0.05 | <0.01 |
| DMI, % of BW - Item |
Klemme - Winter/Spring | Klemme - Summer | SEM3 | P-Value |
|---|---|---|---|---|
| Initial to D-28 | 3.06 | 3.22 | 0.089 | 0.26 |
| D-28 to 112 | 3.29 | 3.16 | 0.060 | 0.22 |
| D-112 to 224 | 2.83 | 2.72 | 0.058 | 0.25 |
| D-224 to Shipping | 2.26 | 2.14 | 0.071 | 0.27 |
| Gain:Feed - Item | Klemme - Winter/Spring | Klemme - Summer | SEM3 | P-Value |
|---|---|---|---|---|
| Initial to D-28 | 0.327 | 0.296 | 0.0251 | 0.40 |
| D-28 to 112 | 0.208 | 0.213 | 0.0065 | 0.63 |
| D-112 | 0.157b | 0.173a | 0.0046 | 0.01 |
| D-224 to Shipping | 0.142 | 0.139 | 0.0137 | 0.72 |
| Carcass Quality - Item | Klemme - Winter/Spring | Klemme - Summer | SEM3 | P-Value |
|---|---|---|---|---|
| Hot Carcass Weight, lbs | 866a | 8.26b | 11.2 | <0.01 |
| Dressing % | 62.7 | 63.1 | 0.29 | 0.15 |
| Ribeye area, sq. in. | 13.9 | 14.0 | 0.21 | 0.81 |
| Back Fat Thickness, in | 0.50a | 0.44b | 0.025 | 0.03 |
| Yield Grade | 2.99a | 2.65b | 0.10 | <0.01 |
| Marbling score | 491 | 470 | 17.3 | 0.26 |
1 Treatments consisted of winter/spring or summer season of receiving calves.
2 BW = body weight; ADG = average daily gain; DMI = dry matter intake.
3 Standard error of the mean.
a, b Within a row, means with different subscripts differ at P < 0.05.
Veterinary Shortage
OSU Efforts to Address Veterinary Shortage
Rosslyn Biggs, DVM9
Justification and Actions
In April of 2022, the American Veterinary Medical Association reported that for every veterinarian seeking a job, there were 12.5 available jobs. These numbers are much higher than the January 2019 report which indicated there were 3.7 available jobs for every veterinary job seeker.
The demand for veterinarians and other veterinary team members is notable in nearly all areas of veterinary medicine, including private practice, academia and government service. Of particular concern is the need for food animal veterinarians. Food animal veterinarians play critical roles in animal health and welfare as well as food safety and security across the animal agriculture supply chain.
Each year, Oklahoma State University College of Veterinary Medicine welcomes 106 students to the CVM program. Of these positions, 58 are reserved for Oklahoma residents and 48 for non-residents. Application numbers continued to be strong with over 800 individuals applying in 2023. Oklahoma residents had a total of 156 applicants while non-residents had 654 applicants. For those joining the Class of 2026, their cumulative GPA for undergraduate classes averaged 3.62 for Oklahoma residents and 3.61 for non-residents.
OSU CVM’s mission is to provide innovative strategies to improve animal and human health. The CVM is committed to producing practice ready veterinarians. The percentage of OSU graduates entering food animal or mixed animal practice is routinely higher than the national average. From the class of 2022, 26.8% of OSU grads entered a large or mixed animal practice while the national average typically fluctuates between 10-15%.
To take a closer look at the needs of veterinarians serving the beef industry, an OSU team comprised of faculty from veterinary medicine, animal science and agricultural economics was established in 2019. With grant funding from the USDA National Institute of Food and Agriculture, the Integrated Beef Cattle Program for Veterinarians was created.
The program intends to enhance the sustainability of veterinary practices serving the Oklahoma beef cattle industry and surrounding region. Additional support for the participants has been provided by the Oklahoma Cattlemen’s Association, National Beef Quality Assurance, Oklahoma Beef Council, Oklahoma Veterinary Medical Association and the Oklahoma Department of Agriculture, Food, and Forestry.
Findings
In the fall of 2020, OSU began the program through a series of surveys to veterinarians, veterinary students and beef cattle producers to identify the extent of the Oklahoma situation and the needs of those groups. Based on survey data, the Integrated Beef Cattle Team created a curriculum for a class of 20 Oklahoma veterinarians and 20 OSU veterinary students. Participants selected for Class I were diverse in their experience and Oklahoma practice locations. Each quadrant of the state was represented with practitioner experience ranging from over 40 years to recent graduates. Class II was of similar design and included veterinarians from outside Oklahoma.
Modules are delivered in face-to-face and virtual meeting formats. Each module delivers a minimum of nine hours of continuing education credit. Topics cover a wide range of needs identified by the initial survey. Examples of module topics include leadership, communication, mentoring, practice management, welfare, stockmanship, beef nutrition, mental health and production management.
Interested in participating in 2026?
Apply at the Integrated Beef Cattle Program Website.
Contact Dr. Rosslyn Biggs at: rosslyn.biggs@okstate.edu
Neogen Igenity Beef Index Scores
Neogen Igenity Beef Index Scores Predict Performance of Steers During Finishing
Jacee De Vries, Emma Briggs, Addie Womack and Mike Major David Lalman and Paul Beck1
Justification and Actions
Genomic testing of feeder cattle prior to feedlot entry may allow for feedlot managers to make enhanced management and marketing decisions. Genomic testing analyzes thousands of nucleotides of DNA to predict quantitative traits. The Neogen Igenity Beef Index provides a score on a scale of 1-10 for 17 maternal, perfor-mance, and carcass traits. The objective of this study was to determine differences in performance and efficiency of finishing steers utilizing Neogen Igenity Beef scores for average daily gain (ADG) and milk. Spring born commercial Angus steer calves from the OSU Range Cow Research Center [n = 83; body weight (BW) = 924 ± 70.3 lb] were placed on feed at the Willard Sparks Beef Research Center on May 5, 2022, after grazing wheat pasture for 155 days. The steers were grouped based on Igenity Beef ADG Score [low (1-4), medium (5-6) or high (7-10)] and Milk Score [low (1-5) or high (6-10)]. Steers were blocked by BW and allocated into pens (n = 5 steers/pen). Steers received a series of step-up diets for 30 days before transitioning to a finishing ration: 8% prairie hay, 20% Sweet Bran and 62% dry-rolled corn 5% liquid fat supplement, and 5% dry vitamin and mineral supplement). Cattle were fed ractopamine hydrochloride for 30 days prior to harvest. The heavy block was on feed for 119 days, while the light block was on feed for 148 days. Data were analyzed as a randomized complete block design using the mixed procedure of SAS (Inst., Inc., Cary, North Carolina) with pen as the experimental unit.
Findings
There were no differences in initial BW based on ADG or milk score. Steers with high ADG (HG) scores gained weight more rapidly during finishing and weighed more at harvest than steers with medium ADG (MG) and low ADG (LG) scores (P < 0.01), while steers with high milk (HM) scores gained faster (P < 0.01) and tended (P = 0.06) to be heavier at harvest than steers with low milk (LM) scores. Growth score was shown to have an effect on finishing DMI (P < 0.01) with HG steers consuming more feed than MG or LG steers. Steers with HM scores were less efficient than steers with LM scores (P = 0.01), but there was no difference (P = 0.37) in feed efficiency during the finishing phase based on ADG score. Steers with high growth and milk scores had a higher finishing ADG (P < 0.01 and P < 0.01, respectively). There were no differences in intake or gain during the step-up period. Steers with HG scores had greater hot carcass weights than MG and LG steers (P = 0.01). Steers with LM scores had greater hot carcass weights than steers with HM scores (P = 0.03), while HM steers had a tendency (P = 0.06) to produce more USDA Choice carcasses. These data indicate that Igenity ADG scores can be used to select cattle with improved performance and BW at harvest without impacting feed efficiency. Steers with higher Igenity Milk scores were less efficient than those with lower Igenity Milk scores. However, Igenity Milk scores can be used to predict feed efficiency, according to these data.
| BW, lb - Item |
ADG Score - HG |
ADG Score - MG |
ADG Score - LG |
ADG Score - SE |
ADG Score - P-Value |
Milk Score - HM |
Milk Score - LM |
Milk Score - SE |
Milk Score - P-Value |
|---|---|---|---|---|---|---|---|---|---|
| Initial | 915 | 933 | 924 | 37.0 | 0.91 | 919 | 928 | 26.7 | 0.86 |
| Step-up | 1168 | 1188 | 1162 | 42.3 | 0.85 | 1171 | 1175 | 30.4 | 0.92 |
| Final | 1572a | 1519b | 1508b | 20.3 | 0.03 | 1515 | 1552 | 14.6 | 0.06 |
| ADG, lb/d - Item |
ADG Score - HG |
ADG Score - MG |
ADG Score - LG |
ADG Score - SE |
ADG Score - P-Value |
Milk Score - HM |
Milk Score - LM |
Milk Score - SE |
Milk Score - P-Value |
|---|---|---|---|---|---|---|---|---|---|
| Step-up | 7.96 | 8.00 | 7.43 | 0.22 | 0.15 | 7.85 | 7.76 | 0.24 | 0.73 |
| Finishing | 3.77a | 3.35b | 3.44b | 0.09 | < 0.01 | 3.33a | 3.70b | 0.09 | < 0.01 |
| F:G - Item |
ADG Score - HG |
ADG Score - MG |
ADG Score - LG |
ADG Score - SE |
ADG Score - P-Value |
Milk Score - HM |
Milk Score - LM |
Milk Score - SE |
Milk Score - P-Value |
|---|---|---|---|---|---|---|---|---|---|
| Step-up | 3.72 | 3.67 | 3.94 | 0.07 | 0.08 | 3.75 | 3.80 | 0.09 | 0.59 |
| Finishing | 8.60 | 8.94 | 8.79 | 0.38 | 0.37 | 9.09a | 8.47b | 0.43 | 0.01 |
| HCW, lb | 946a | 915b | 902b | 25.8 | 0.01 | 908a | 935b | 8.60 | 0.03 |
| % Choice | 100 | 94 | 90 | .04 | .13 | 98 | 91 | 3.0 | 0.06 |
a, b Within a row, means with different subscripts differ at P < 0.05.
1 HG: high ADG score, MG: medium ADG score, LG: low ADG score, HM: high milk score,
& LM: low milk score
Effects of Feeding NutraGen
Effects of Feeding NutraGen on Clinical Signs and Leukocytes in Calves following Natural Exposure to Bovine Viral Diarrhea Virus and Subsequent Mannheimia Haemolytica Infection
Jazmin A. Markey10, Jennifer Rudd9, Tim Snider9, Marie Montelongo9, Brooke Humphrey7 and James D. Chapman7 Evin D. Sharman7, Miriam Garcia7, Ryan Reuter10, Paul A. Beck10, Andrew P. Foote8 and Blake K. Wilson10
Justification and Actions
Recently, nutritional additives have been examined as agents to aid in the prevention of BRD. NutraGen (NG; Phibro Animal Health, Teaneck, New Jersey), is a proprietary combination of all-natural yeast fermentation products and other ingredients that has been formulated to support immunocompetency in beef cattle. Two 89-day experiments (EXP1 and EXP2) were conducted between July of 2021 and March of 2022 utilizing 32 ranch-sourced crossbred steer calves (initial BW = 553 ± 84.2 lbs) with no previous vaccination to BRD. The BRD challenge model consisted of natural exposure to bovine viral diarrhea virus (BVDV) followed by a subsequent intratracheal inoculation of Mannheimia haemolytica (Mh) to compare clinical and cellular response variables in beef steers fed NG. Treatments included a placebo fed for 47 days (CON; EXP1 n = 5; EXP2 n = 5), a placebo fed for 15 days followed by NG fed for 32 days (CHLG; EXP1 n = 5; EXP2 n = 6), and NG fed for 47 days (PREC; EXP1 n = 6; EXP2 n = 5). All steers were managed identically and fed a common basal receiving diet. Animals were individually housed at the OSU Animal Nutrition and Physiology Research Center in Stillwater, Oklahoma. All data presented are relative to the inoculation of Mh on day 0 (hour 0). Clinical signs observed included rectal temperatures (RT), subjective clinical scores (CS; scale from 0 to 4), and respiration rates (RR; breaths per 30 seconds). The objective of these experiments was to determine the potential of NutraGen as a mitigative or preventative measure against BRD.
Findings
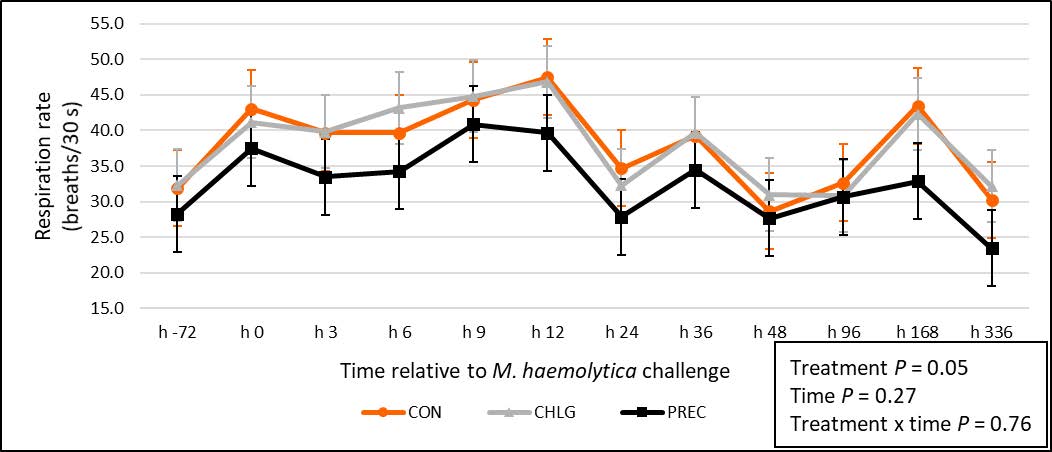
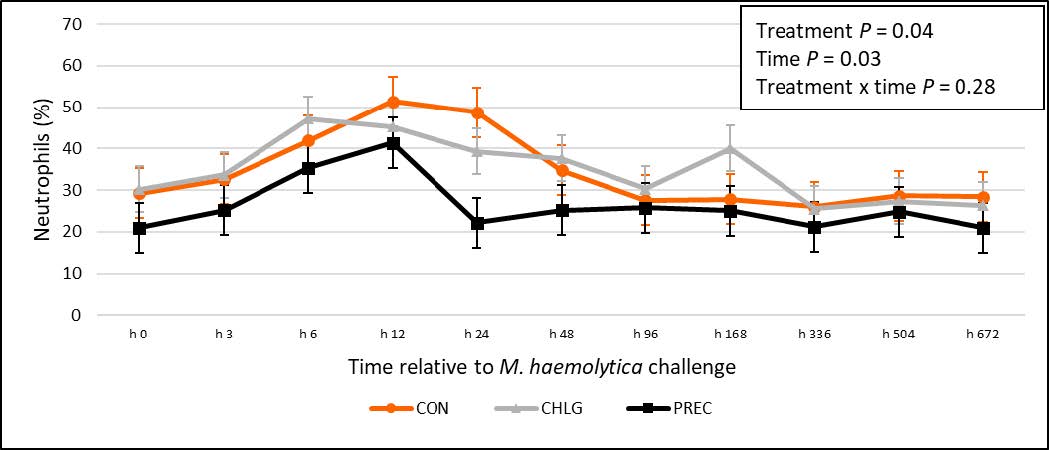
No treatment × time interaction or treatment effect was present for RT in EXP1 and CS in EXP1 and EXP2 (P ≥ 0.26). There was a tendency for a treatment × time interaction for RT from day -3 to day 14 in EXP2 (P = 0.04) where CHLG and PREC calves had decreased RT at multiple time points post-challenge. There was a treatment × time interaction for RR during the first 24 hours following Mh infection (P = 0.04) and a tendency for a treatment effect overall in EXP1 (P ≤ 0.10) where calves assigned to the CHLG treatment displayed elevated RR. Calves assigned to the PREC treatment exhibited a tendency for a reduced RR overall in EXP2 (P ≤ 0.10). Calves in EXP1 had similar neutrophil, lymphocyte and neutrophil\lymphocyte concentrations (P ≥ 0.19). There were multiple treatment x time interactions and treatment effects for neutrophil, lymphocyte or neutrophil:lymphocyte concentrations in EXP2 (P ≤ 0.05). Calves assigned to the PREC treatment exhibited decreased neutrophil concentrations in EXP2 (P ≤ 0.04). Calves also exhibited elevated lymphocyte concentrations during the first 24 hours following Mh infection (P ≤ 0.05), from day 0 to day 28 post-challenge (P ≤ 0.06), and overall in EXP2 (P ≤ 0.01). Multiple treatment x time interactions and time effects occurred in both EXP (P ≤ 0.03) for leukocytes. Overall, these experiments suggest that NG has the potential to alter clinical and cellular responses during a BRD challenge. While the target inoculation dose of Mh was the same in each experiment, animals in EXP2 displayed milder clinical responses than animals in EXP1.
Figure 1. Respiration rate of calves across all collections in EXP2. Values plotted represent least squares means ± SE of the mean, calculated for all animals per experimental group. Treatments included a placebo fed for 47 days (CON; n = 5), a placebo fed for 15 days followed by NG fed for 32 days (CHLG; n = 6), and NG fed for 47 days (PREC; n = 5). There was no treatment × time interaction (P = 0.76) and no time effect (P = 0.27); however, treatment was significant (P = 0.05).
Figure 2. Neutrophil presence in blood (%) during the 28 days following exposure to bovine viral diarrhea virus and subsequent Mannheimia haemolytica infection in EXP2. Values plotted represent least squares means ± SE of the mean, calculated for all animals per experimental group. Treatments included a placebo fed for 47 days (CON; n = 5), a placebo fed for 15 days followed by NG fed for 32 days (CHLG; n = 6) and NG fed for 47 days (PREC; n = 5). There was no treatment × time interaction (P = 0.28); however, there was a treatment effect (P = 0.04) as well as a time effect (P = 0.03).
Meat Quality and Palatability Traits
Effects of the Dietary Concentrate Level on Meat Quality and Palatability Traits of Spanish Wethers and Doelings
Kathryn Hearn10, Wei Wang1, Ryszard Puchala1, Fabiola Encinas1 and Luana P.S. Ribeiro1, Morgan Pfeifer10, Ranjith Ramanathan10, Arthur L. Goetsch1 and Gretchen Maf10
Justification and Actions
The number of meat goats produced in the United States has steadily increased since 1987 from 415,196 to 2.62 million in 2019 (USDA-National Agricultural Statistics Service). Additionally, goat meat is universally accepted, but consumer preference is influenced by cultural traditions as well as social and economic conditions. (Casey et al., 2003). Thus, the objective of the study was to determine the effects of dietary concentrate level on meat quality and palatability traits of Spanish wethers and doelings.
At approximately 4 months of age, 58 (29 wethers and 29 doelings) goats were weaned and randomly assigned to one of the five feeding programs. The concentrate diet treatments included 20% (20C), 40% (40C), 50% (50C), 60% (60C) and 70% (70C) concentrate. Other than concentrate, all other feed ingredients were the same to minimize subsequent variation in diets. Diets were fed free choice for ad libitum consumption. Goats were harvested following typical commercial procedures at approximately 10 months of age. After 48 hours, carcasses were ribbed and color measurements were taken 15 minutes after to allow for blooming. All other carcass data was collected following the Meat Goat Selection, Carcass Evaluation and Fabrication Guide from Louisiana State University. Fabrication into the major wholesale cuts (IMPS 11 series) occurred 48 hours post-mortem. One sirloin chop was taken from the anterior portion of the leg and subjected to three days in retail display. During display, muscle color, surface discoloration and overall acceptability were measured by a trained six-member member panel and objective L*, a*, and b* values were recorded with a HunterLab Miniscan Spectrophotometer. For palatability trait analysis, six boneless chops from each loin were sliced 1.9 cm thick and assigned to the consumer taste panel (n = 60) for likeness of tenderness, juiciness, favor and overall likeness. Additionally, four chops from the rib section were sliced 1.9 cm thick and assigned to the trained sensory panel (n = 6) for tenderness, juiciness, flavor intensity and off-flavors following the American Meat Science Association guidelines. Each chop was cooked to a final target internal temperature of 68oC.
Findings
Carcasses from goats fed the 20C, 50C and 70C diets had higher a* values (redness) compared to carcasses from goats fed the 60C diet. Also, as expected a* values decreased (P < 0.05) as retail display increased regardless of diet fed. Lightness scores, L* values, were higher (P < 0.05) from sirloin chops fabricated from females on retail day one and two than males. L* values of sirloin chops from goats fed the 60C diet were higher (P < 0.05) than the goats fed 40C diet on retail day zero and one as well as higher than the goats fed 50C diet on retail day one. Chops from goats fed 60C diet were lighter (P < 0.05) than chops from goats fed 50C or 70C on retail day two. Chops from goats fed 20C were brighter cherry red (P < 0.05) on retail day one than those fed 40C, 50C and 60C (Figure 1). However, chops from goats fed 20C were darker (P < 0.05) on retail day two than goats fed 40C (Figure 1). Muscle color was darker (P < 0.05) from chops fabricated from female carcasses compared to males on retail days one and two (Figure 2). Chops from doeling carcasses had lower (P < 0.05) acceptability scores than chops from wether carcasses on retail days one and two with no difference at the beginning of display. Overall acceptability of chops from goats fed 40C, 50C and 70C diets was higher (P < 0.05) on retail day two than chops from goats fed 20C and 60C diets. Finally, regardless of demographics, consumers did not perceive a difference in tenderness, juiciness, favor or overall likeness between treatments. Trained panelists also found no significant differences in tenderness, juiciness or favor. However, trained panelists did report goats fed the 20C diet to 10 months of age resulted in the most (P < 0.05) of favors. In conclusion, there were no consistent trends for carcass quality, display color or palatability traits of goats from the varying concentrate diets.
| Table | Caption |
|---|---|
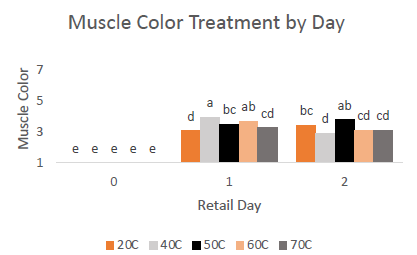 |
Figure 1. Least Square Means for Muscle Color (1= Extremely Bright Cherry Red; 8= Extremely Dark Red) for three days in retail display of leg chops from goats fed different concentrate levels. |
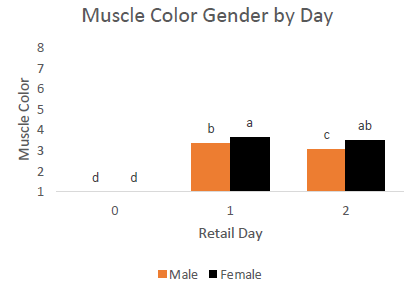 |
Figure 2. Least Square Means for Muscle Color (1= Extremely Bright Cherry Red; 8= Extremely Dark Red) for three days in retail display of leg chops from doelings and wethers. |
Cutability and Cutout Percentages
Effects of the Dietary Concentrate Level on Carcass Cutability and Cutout Percentages of Spanish Wethers and Doelings
Kathryn Hearn10, Wei Wang1, Ryszard Puchala1, Fabiola Encinas1 and Luana P.S. Ribeiro1, Morgan Pfeifer10, Ranjith Ramanathan10, Arthur L. Goetsch1 and Gretchen Maf10
Justification and Actions
The number of meat goats produced in the United States has steadily increased since 1987 from 415,196 to 2.61 million in 2019 (USDA-National Agricultural Statistics Service). Thus, the objective of the study was to determine the effects of dietary concentrate level on carcass cutability and cutout percentages of Spanish wethers and doelings.
At approximately 4 months of age, 58 (29 wethers and 29 doelings) goats were weaned and randomly assigned to one of the five feeding programs. The concentrate diet treatments included 20% (20C), 40% (40C), 50% (50C), 60% (60C) and 70% (70C) concentrate. Other than concentrate, all other feed ingredients were the same to minimize subsequent variation in diets. Diets were fed free choice for ad libitum consumption. Goats were harvested following typical commercial procedures at approximately 10 months of age. All carcass data was collected following the Meat Goat Selection, Carcass Evaluation and Fabrication Guide from Louisiana State University. Fabrication into the major wholesale cuts (IMPS 11 series) occurred 48 hours post-mortem, and all weights were recorded to ensure 99-100% recovery of cold carcass side weight (only left sides of carcasses).
Findings
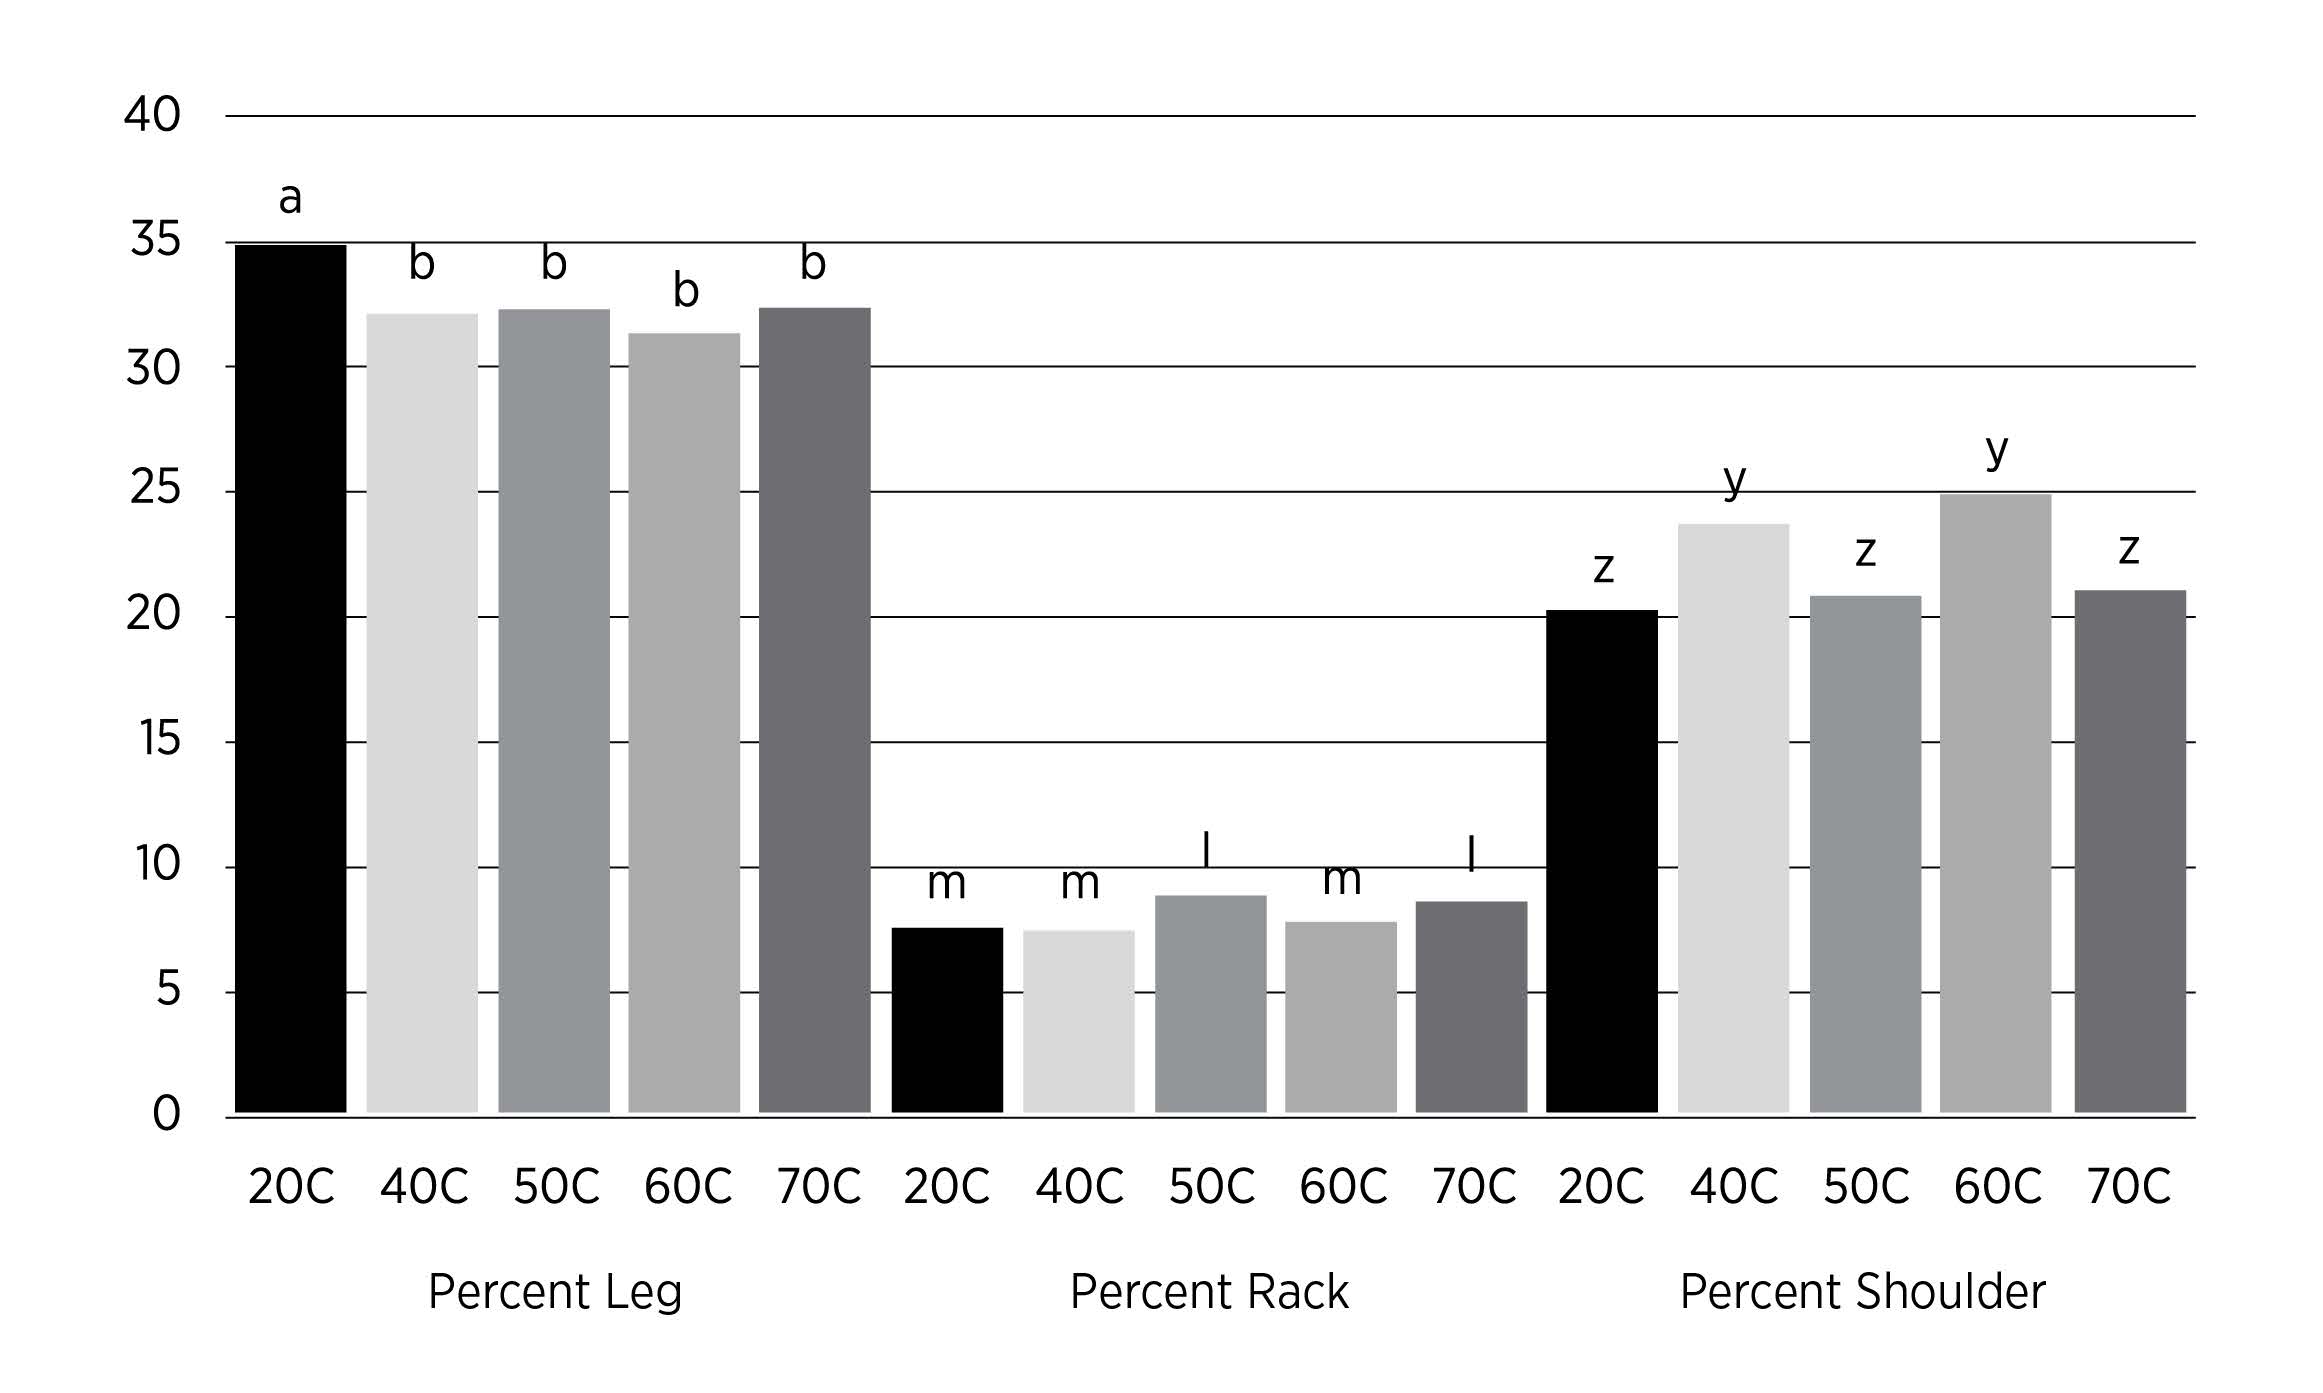
Overall, males had heavier hot and cold carcass weights and were more heavily muscled (P < 0.05) than the females, regardless of diet. There were no significant changes in the percentage of boneless closely trimmed retail cuts, 12th rib fat thickness, body wall thickness, fat cover, or confirmation from goats fed different concentrate diets. For adjusted fat thickness, goats fed the 20C and 40C were fatter (P < 0.05) than goats fed the 50C and 70C diets. Goats fed the 20C diet had the highest (P < 0.05) percentage of leg weight (Figure 1). In addition, goats fed the 40C diet had higher leg scores (P < 0.05) than goats fed the 20C and 60C diets. Goats from the 50C and 70C treatments had higher percentages of rack weight (P < 0.05) than goats fed the 20C, 40C and 60C diets (Figure 1). However, goats fed the 40C or 60C diet had higher (P < 0.05) percentages of shoulder weight than the goats fed the 20C, 50C and 70C diets (Figure 1). In conclusion, there were no consistent trends for carcass traits and cutout percentages of goats from the varying concentrate diets.
Figure 1. Least Square Means for Muscle Color (1= Extremely Bright Cherry Red; 8= Extremely Dark Red) for three days in retail display of leg chops from goats fed different concentrate levels.
Figure 2. Carcasses ribbed for data collection.
Meat Color
Novel Single-Fiber Probe to Study Meat Color
Morgan L. Denzer10, Daqing Piao12, Morgan Pfeifer10, Gretchen Maf10 and Ranjith Ramanathan10
Justification and Actions
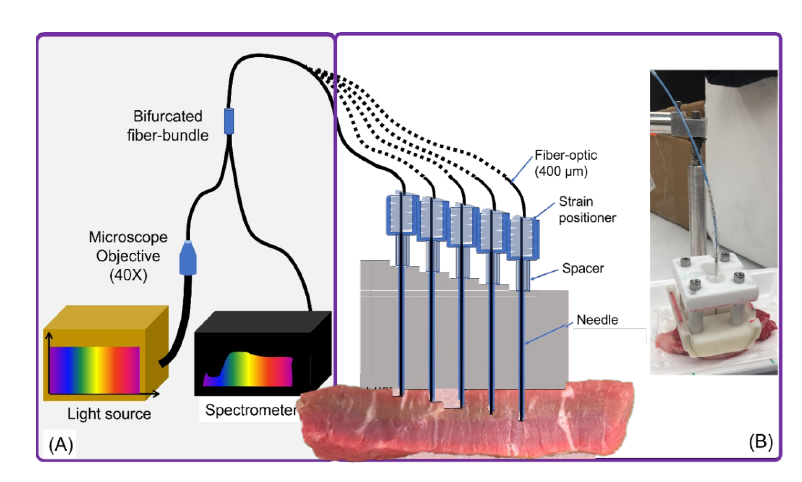
Consumers consider a variety of characteristics, such as marbling, price and color, when making purchasing decisions in the grocery store. In terms of color, consumers prefer to purchase steaks that appear bright cherry red without brown surface discoloration. Myoglobin is the primary protein giving beef its color. Myoglobin can reversibly bind to oxymyoglobin, giving beef its characteristic bright cherry red appearance. The interior of steaks predominantly consists of deoxymyoglobin, resulting in purple coloration due to the lack of oxygen. Oxidation of myoglobin leads to the formation of metmyoglobin or surface discoloration. Recently, surface discoloration has been estimated to cost the beef industry approximately $3.73 billion annually, resulting in a waste of 428 million pounds of beef. Therefore, limiting and understanding the development of surface discoloration can help to limit beef waste and economic loss for the beef industry. We understand that steak surface discoloration is caused by the internal development of metmyoglobin, which rises to the surface during retail display. To better understand the internal oxidation of myoglobin during retail, a single-fiber probe (SfP) was used to characterize internal color changes and understand the internal oxidation of myoglobin as surface discoloration occurs in the psoas major muscle. The SfP system consisted of a 400-μm fiber in a 15-gauge needle. To evaluate internal myoglobin changes, the SfP system was inserted into the muscle in five locations varying in depth by 1 mm. Using MATLAB, a mathematical model was developed to calculate the percent metmyoglobin and oxymyoglobin.
Findings
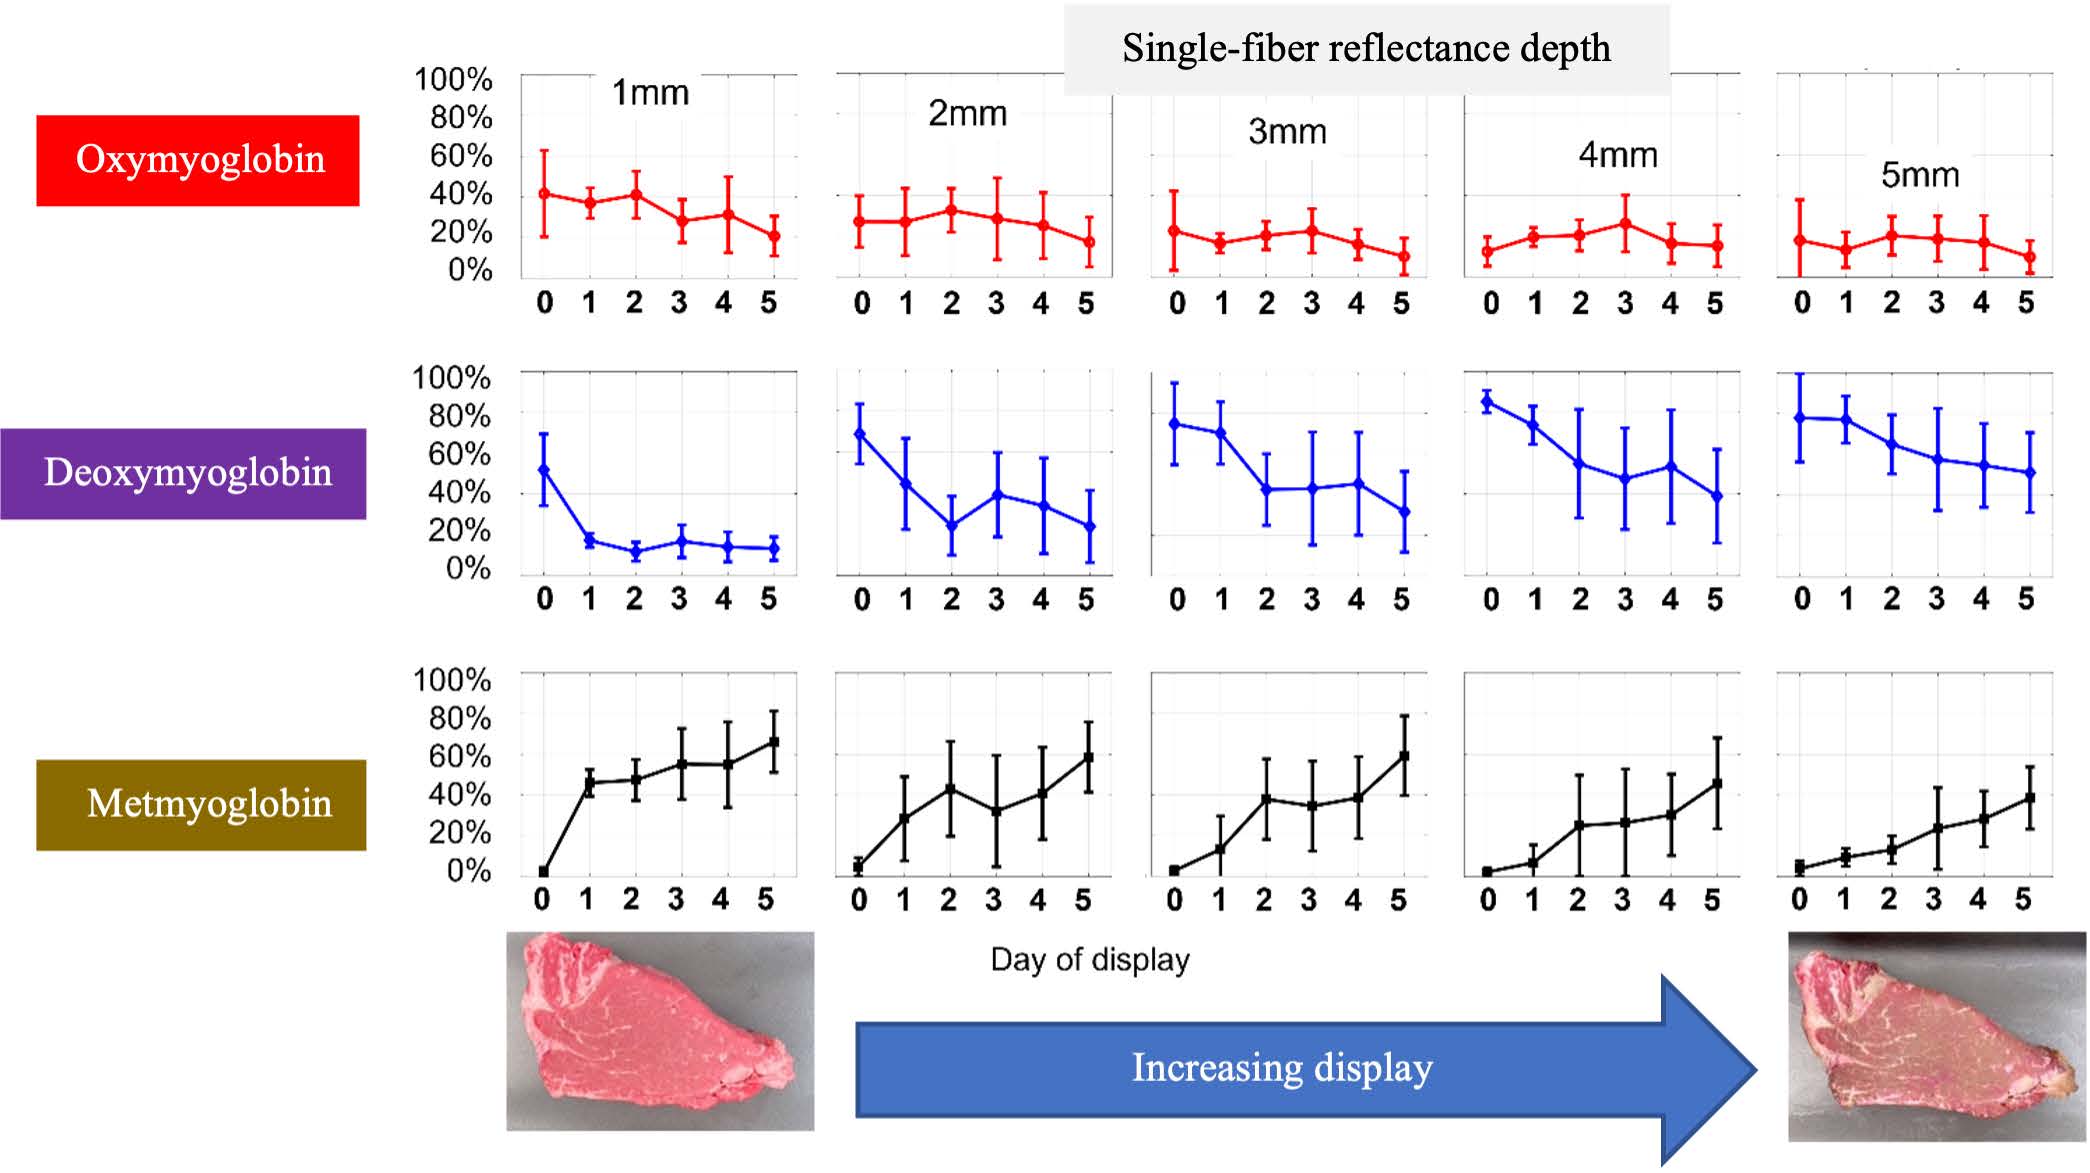
At 1 mm depth, the red oxymyoglobin decreased during retail display, whereas deeper (2 – 5 mm) depths had little change in oxymyoglobin. The percent metmyoglobin rapidly increased from day 0 to day 1 of retail display at 1-mm depth. Furthermore, from 2 – 5 mm, metmyoglobin increased throughout retail display, indicating the development of a subsurface brown layer. It is understood that interior portions of steaks are predominantly deoxymyoglobin, which was supported by the high percent of deoxymyoglobin measured on day 0 at 3 – 5 mm internally. During retail display, the deoxymyoglobin content decreased at 1 – 5-mm depths using the SfP. Therefore, a loss of deoxymyoglobin during retail display occurs with an increase in metmyoglobin while oxymyoglobin remains constant. These results support the oxidation of deoxymyoglobin, forming metmyoglobin internally. Hence, the interior remains mostly purple, which slowly oxidizes to a subsurface brown layer and rises to the surface over time, causing surface discoloration. As surface discoloration has a large role in food waste, better understanding the formation of metmyoglobin as well as continuing to develop technology to evaluate color throughout processing is key to limiting food waste and economic loss.
Figure 1. Schematic of the single-fiber-reflectance SfR fitted with a needle-probe for assessing myoglobin composition in muscle below the surface at an increment of 1 mm from a depth of 1 mm to 5 mm. (A) The illumination of a white light source was coupled to a 400 μm fiber by using a microscope objective lens. (B) Module and scheme visualizing how probes are inserted into the muscle.
Figure 2. The percentage compositions of oxymyoglobin (top row), deoxymyoglobin (middle row), and metmyoglobin (bottom row) assessed on the surface of the muscle by HunterLab MiniScan (the first figure on each row) and at depths from 1 mm to 5 mm with an increment of 1 mm estimated by the needle-probe SfR. Within each subfigure, the specific form of myoglobin is plotted with the mean and standard deviation averaged for seven samples and measured daily over days of display 0 to 5.
Tallgrass Prairie in Central Oklahoma
Seasonal Effects on Nutritional Value of Tallgrass Prairie in Central Oklahoma
D.W. Montgomery13, David Lalman8, Paul Beck10, Darren Hagen13, C. M. Salisbury10 and Andrew P. Foote8
Justification and Actions
The Southern Plains region, encompassing most of Oklahoma, Kansas, Texas and eastern Colorado, has a large number of grazing cattle backgrounding and cow-calf production. According to the USDA, Oklahoma alone is home to over 2.1 million beef cows. Many of these cow-calf pairs are maintained throughout the year on native rangeland. Oklahoma warm-season tallgrass prairie grasses (big and little bluestems, switchgrass and Indiangrass) peak in production during summer. Several studies have sought to characterize forage nutritive value changes throughout the year. An accurate estimate of nutritive value is necessary to determine cost-effective supplementation programs to optimize animal performance. Because forage quality varies widely from month-to-month and year-to-year, an accurate estimate of seasonal forage nutritive value requires sampling at multiple intervals throughout the year and over multiple years.
The goal of the experiment was to create a seasonal forage quality library. Samples were collected monthly in three pastures located at the Range Cow Research Center near Stillwater, Oklahoma, and dominated by native tallgrass prairie species (little bluestem, big bluestem, Indian grass, switch grass). Three pastures were grazed using year-long stocking and a moderate stocking rate of 15 acres per cow/calf unit. Each pasture replicate was stocked with an average of 13.3 cow-calf pairs. Prescribed burns were conducted each year during late March to control invasive woody species. Between two and four locations within each pasture were chosen and exact coordinates saved. A 1 sq. ft. quadrant was placed upon the ground at each location and forage within this space was clipped, gathered and labeled. This was done each month for the entire five-year period. Forage samples were bagged, labeled with date and pasture location, and dried at 60°C. At the end of the experiment, all samples were ground and analyzed using near infrared spectroscopy to determine nutrient contents.
Findings
The results of this multi-year analysis followed closely with expected patterns based on warm season forage growth patterns. Most nutritional components increased in the warmer months, starting in April, peaking in May, and then steadily decreased throughout the year. Lowest nutritional values tended to occur in January and February. Crude protein (CP) of forage rose from a 2.13% average in February to a maximum of 10.55% in May (P<0.01). Acid detergent fiber (ADF), neutral detergent fiber (NDF), and Lignin–higher amounts of which indicate a decreased digestibility–was lowest in the summer with minimums of 40.10%, 60.21% and 0.922%, all occurring in May (P<0.01). In vitro true dry matter digestibility (IVTDMD) also had a maximum in May for all years with an average maximum of 75.6% (P<0.01). Crude fat content again was highest in May, suggesting a rapid increase from April of 4.90% to 6.39% (P<0.01). Fructan increased dramatically from April to May, reaching an average 6.19% (P<0.01). Starch decreased from April to May with a lowest average of 4.67% in June year-to-year. This steadily began to rise once again in early fall (P<0.01). These predominantly warm-season native grasses peak in production and nutritive quality during the early summer and are deficient in protein and energy for much of the winter and early spring.
| Graph | Caption |
|---|---|
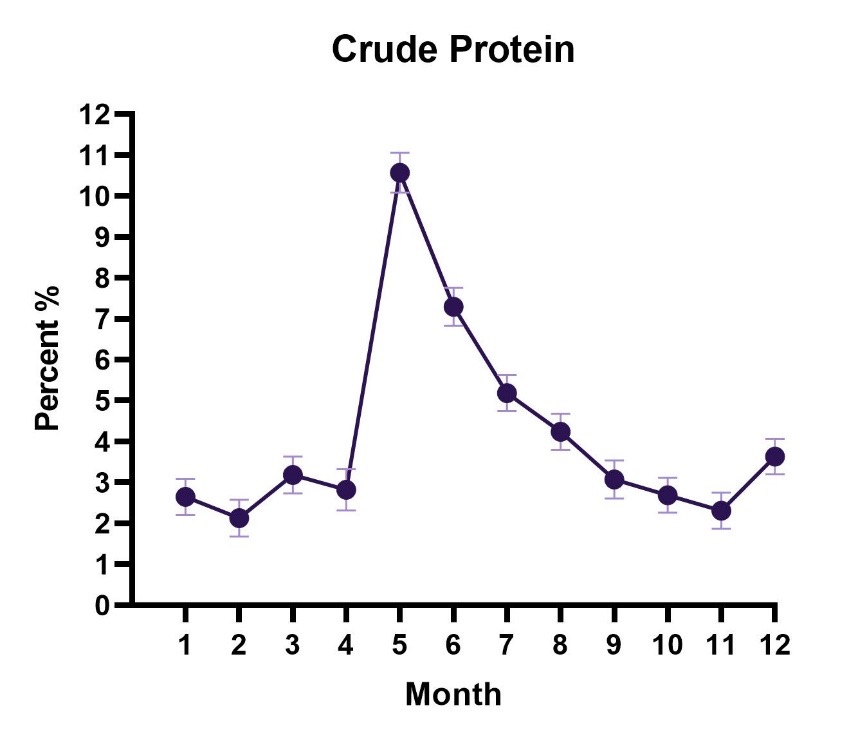 |
Figure 1. Crude protein percentage over the span of 12 months. |
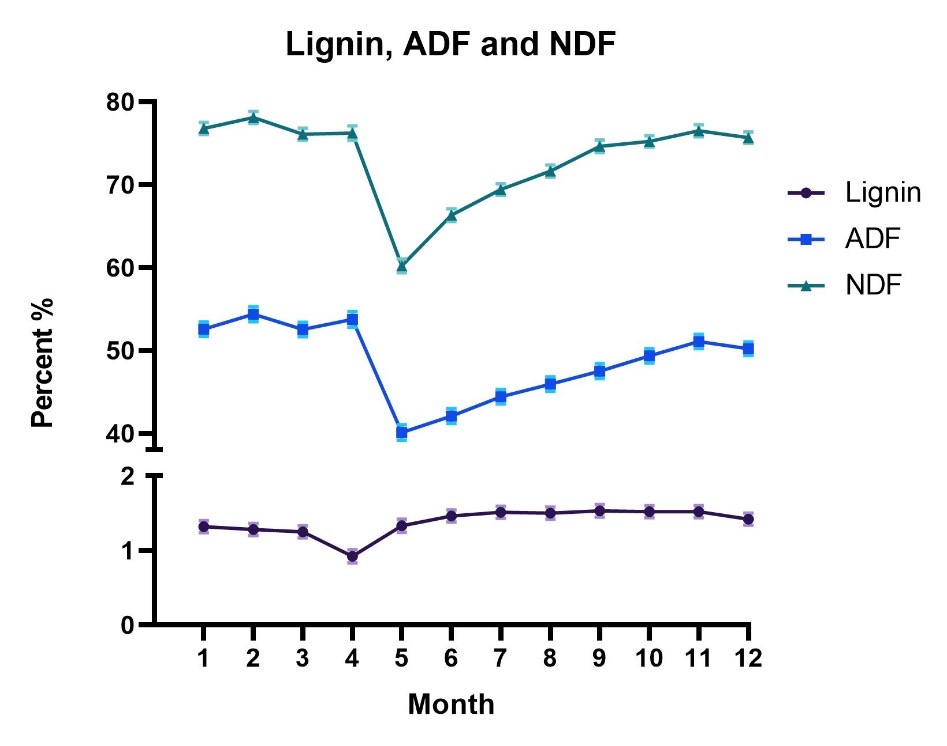 |
Figure 2. Lignin, ADF and NDF percentages over the span of 12 months. |
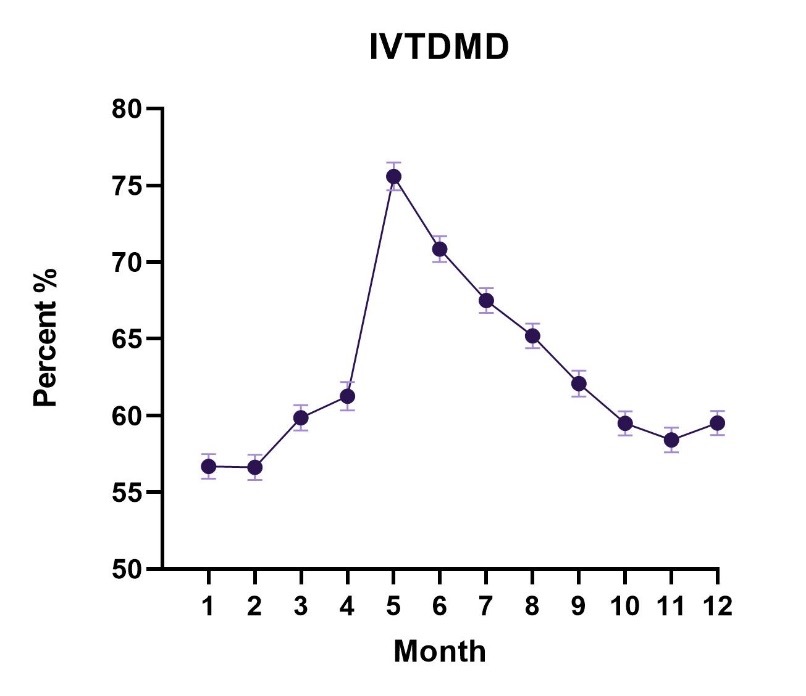 |
Figure 3. IVTDMD percentages over the span of 12 months. |
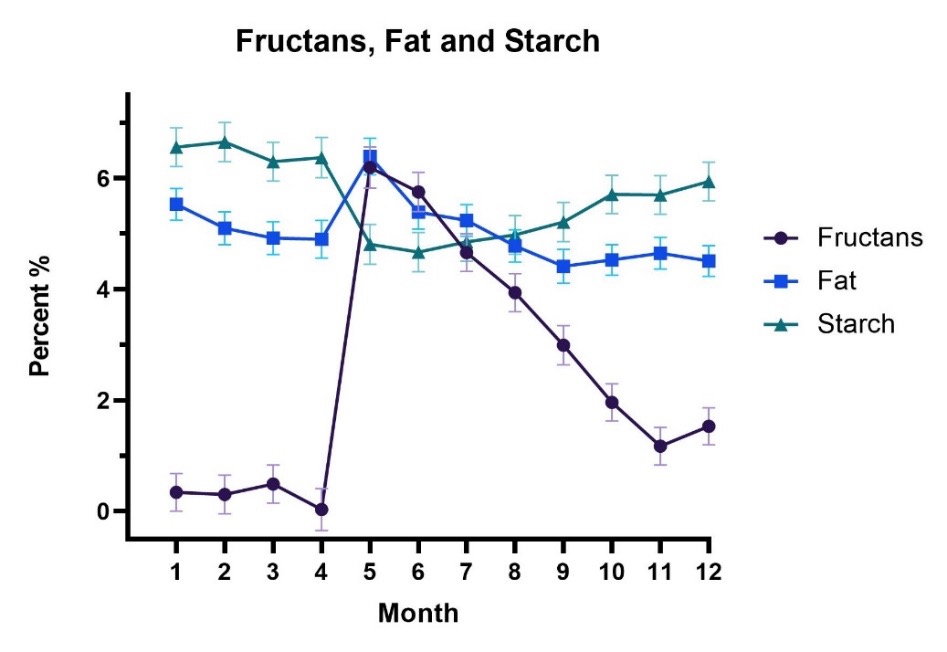 |
Figure 4. Fructans, fat and Starch percentages over the span of 12 months. |
Calf Market Characteristic Trends
An Evaluation of Oklahoma Beef Calf Market Characteristic Trends from 2011 to 2021
T.P. Vining13, K.C. Raper13, D.L. Peel. J. Matty13, B. M. Freking13, D. L. Zook13, M.G. New8, E.H. Ward13 and P.A. Beck10
Justification and Actions
The Oklahoma Quality Beef Network (OQBN) is a partnership between Oklahoma State University Extension and the Oklahoma Cattlemen's Association with the goal of providing and promoting value-added marketing opportunities for beef cattle producers. The Oklahoma Quality Beef Network’s goal is realized through the implementation of the OQBN Vac-45 Program. The OQBN Vac-45 Program is a beef calf preconditioning program that requires specific vaccination and management practices. Calves that fulfill program requirements receive OQBN Vac-45 Certification and may participate in an OQBN Sanctioned Sale. These sales occur as part of regularly scheduled livestock auction sales on specified dates at planned locations. Sale data for calves sold at OQBN Sanctioned Sales (certified and non-certified calves) is collected each year by extension economists and area livestock specialists to capture market premiums attained by OQBN Vac-45 certified calves. The objective of this study was to analyze multiple beef calf market characteristics using 11 years of beef calf sale data (2011-2021).
Findings
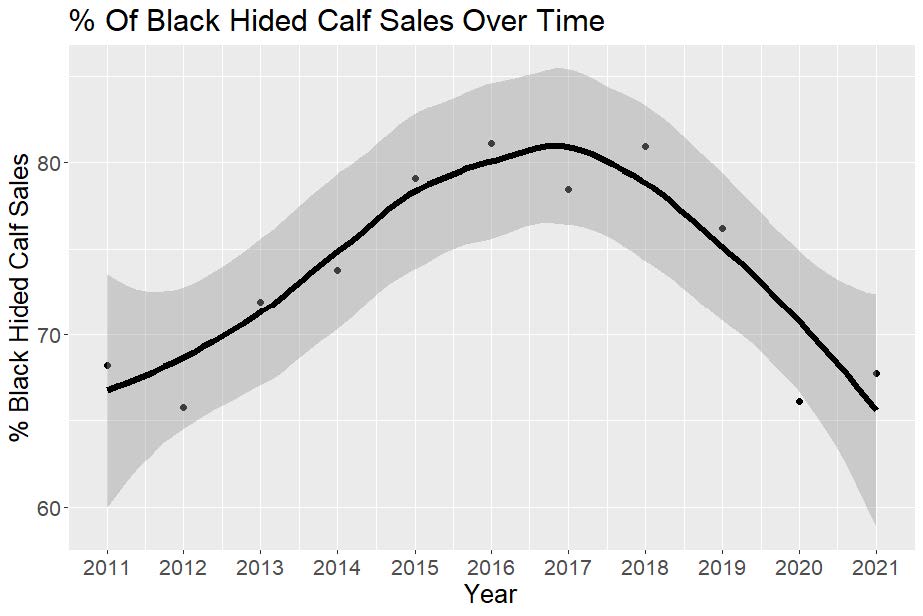
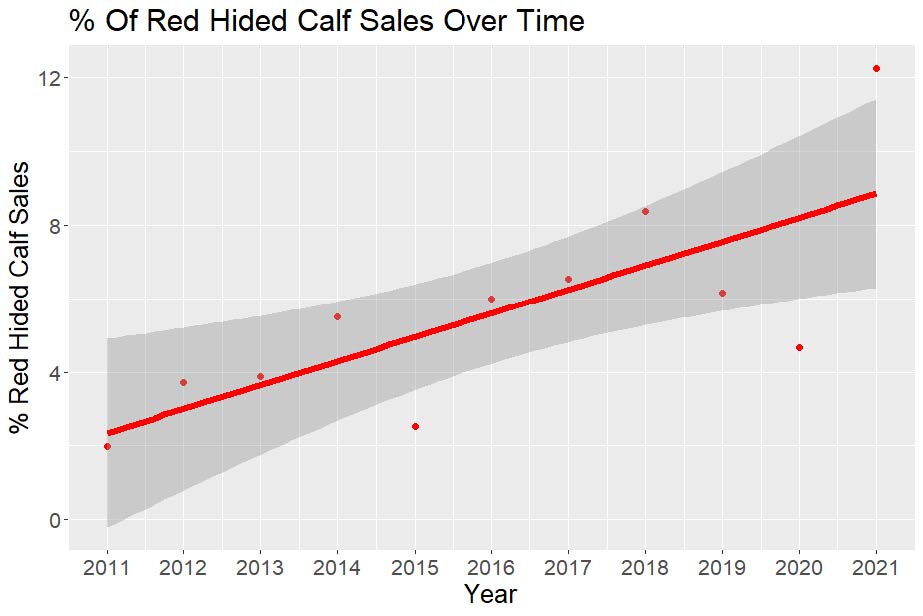
Data was collected at 91 individual OQBN Vac-45 sales that took place at 10 Oklahoma livestock auction locations. An average of eight sales were conducted each year. A total of 149,525 calves were described using 12 market traits. Each market trait was assigned various characteristics. For example, hide color was considered a market trait with black-hided, red-hided, Hereford, white/grey-hided and other considered market characteristics within the market trait. Calf market characteristics were analyzed as percentages based on the total calves recorded annually. Linear and quadratic regression analysis procedures, with year as the fixed effect, were performed using R Statistical Software (v4.1.3; R Core Team 2022). Quadratic regression indicated a significant change in the percentage of black-hided calves sold over time (Fig. 1; R2 = 0.70, P = 0.003), peaking in 2016 (approximately 81% of calf sales) and then decreasing over time. A linear increase in the percentage of red-hided calves sold over time was observed (Fig 2.), explained by R2 = 0.51, P = 0.008. An inverse quadratic effect was observed with the percentage of over-conditioned “fleshy” calves (body condition score ≥ 6.5) decreasing, (R2 = 0.89, P < 0.05) and the number of optimally conditioned “average flesh” calves (body condi-tion score of 5-6) increasing (R2 = 0.95. P < 0.05) over time. Quadratic regression indicated a decreasing trend (R2 = 0.60, P = 0.01) in the percentage of calves participating in certified preconditioning programs over time.
While this data indicated an increase in red-hided calf sales over time, black-hided calves continue to dominate the market, accounting for approximately 68% of calf sales in 2021. The decrease in the sale of fleshy calves (body condition score ≥ 6.5) indicates an increase in the optimization of calf nutritional management over time. While this data indicated a decrease in participation in certified preconditioning programs, the OQBN Vac-45 Program still achieved market premiums. Data indicated that from 2011 to 2021, calves enrolled in the OQBN Vac-45 Program received an average premium of $12.55/cwt compared to non-preconditioned calves sold in the same sales. The observed decrease in program participation may be due to an increase in producer education and the ability to implement preconditioning practices without incurring the additional cost of participation in a certified program.
Figure 1. The quadratic change in percentage of black-hided calf sales over time (R2 = 0.70, P = 0.003).
Figure 2. The linear increase in percentage of red-hided calf sales over time (R2 = 0.51, P = 0.008).
Dietary Protein Levels and Growth
Effect of Dietary Protein Levels and Growth Promotants in Dairy × Beef Cross Steers on Nitrogen Utilization Efficiency
C.M. Salisbury10, M. R. Beck14, Paul Beck10 and Andrew P. Foote8
Justification and Actions
Dairy x beef cross steers have economic and environmental benefits compared to purebred dairy and beef calves, and there are a growing number of dairy-beef cross steers entering feedlots each year. It is estimated that feedlot cattle account for 21% of nitrogen emissions from beef production in the United States. Studies have suggested that the adoption of better management practices, such as phase-feeding crude protein (CP) and the use of growth promoting technologies, such as anabolic hormonal implants, can increase nitrogen use efficiency by better capturing feed nitrogen into animal products. Therefore, the objective of this study was to determine how implant strategy and phase-feeding dietary CP influenced growth rates, feed and nitrogen use efficiency, urine and fecal excretions of nitrogen and phosphorus, nitrogen volatilization from manure as a percent of intake, and carcass characteristics of Holstein-Angus cross steers. Seventy-two Holstein x Angus steers were blocked by bodyweight, and treatments were randomly assigned to pens (n=16). This experiment used a 2 × 2 factorial design where cattle were fed a constant CP (control), or the CP content of the diet was reduced every 49 days (phase-fed), and cattle received either an aggressive or moderate implant strategy. All cattle were implanted on day 0 and day 98. Bodyweight was measured, and blood, urine and fecal samples were collected on days 0, 49, 98, 147 and at shipping.
Findings
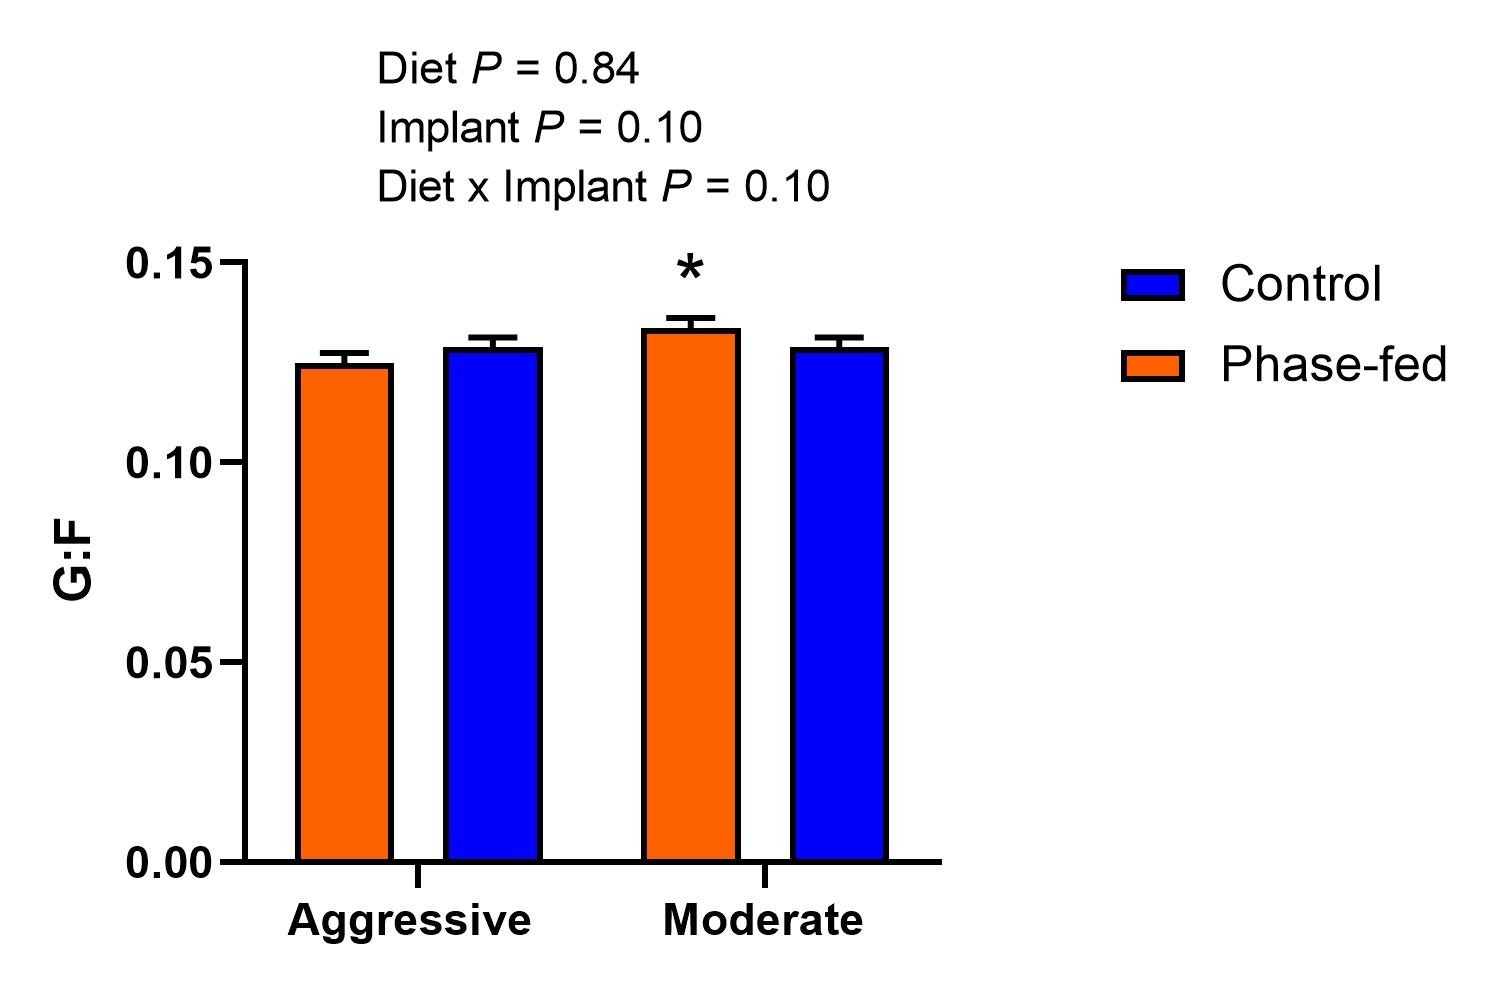
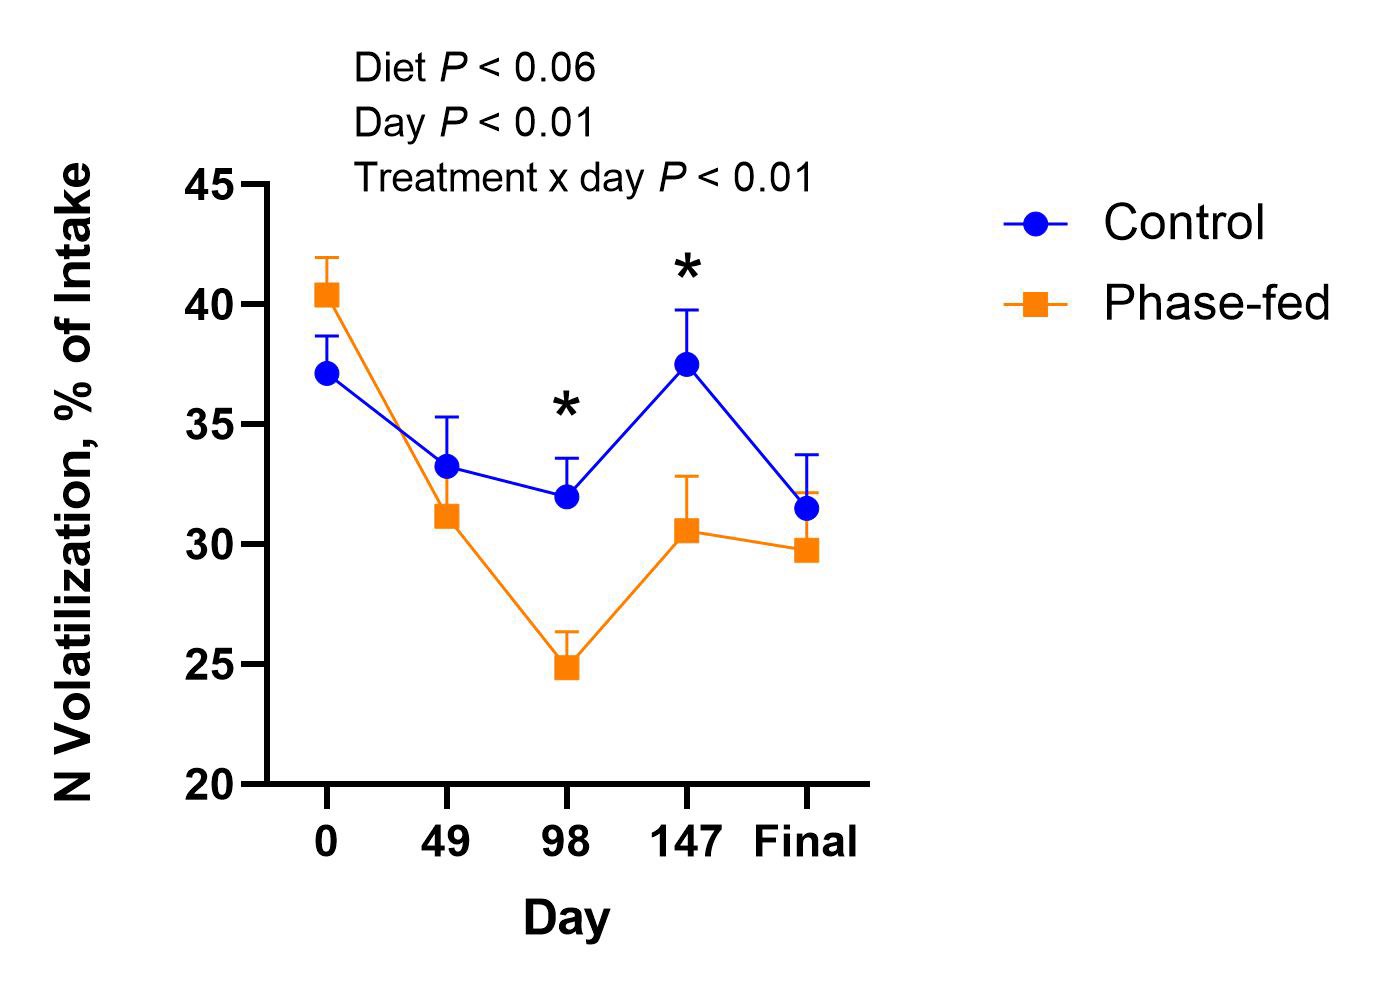
Phase-feeding CP and implant strategy had no effect (P ≥ 0.47) on dry matter intake or average daily gain. There was a tendency (P = 0.10) for a diet × implant-strategy interaction for feed efficiency, indicating that phase-fed cattle were more efficient with the moderate implant strategy than the aggressive implant strategy (figure 1). Urinary nitrogen (UN) excretions decreased (P < 0.01), on day 147 in both implant treatments, indicating that the terminal implant on day 98 may have reduced nitrogen excretion. There was a sampling-day × implant interaction (P ≤ 0.03) and a sampling-day × diet interaction (P < 0.01) for blood urea nitrogen concentrations (BUN) and total UN excretion, where BUN and total urinary N (UN) excretion were lower among the moderate implant and the phase-fed groups on day 147 compared with the aggressive implant and control-fed groups, respectively. Differences were observed in volatilization between dietary treatment groups in phase 3 after the initial decrease in dietary CP and in phase 4 after re-implant (P < 0.01; figure 2). These results suggest that phase-feeding CP can be an effective strategy to reduce nitrogen excretion from cattle in the feedlot without negatively affecting performance.
Figure 1. Effect of dietary crude protein level and implant strategy on overall feed efficiency (G:F). An *represents a significant difference between treatments.
Figure 2. Effect of dietary crude protein level and sampling day on nitrogen volatilization as a percentage of intake. An * represents a significant difference between treatments.
Sources
- American Institute for Goat Research
Arthur L. Goetsch, Fabiola Encinas, Luana P.S. Ribeiro and Wei Wang - Elanco Animal Health
F.White and K. Blue - Kansas State University
Megan Rolf - Land O’ Lakes
Olivia Genther Schroeder and Troy Wistuba - Masterhand Milling
Dusty Turner - Mississippi State University
Daniel Rivera - Phibro Animal Health Corporation
Brooke Humphrey, Evin D. Sharman, James D. Chapman and Miriam Garcia - Oklahoma State University
Amanda Holder, Andrew P. Foote, Carla Goad, Charlie Worthington, David Lalman, D.L. Peel Emma Briggs, Justin Crosswhite, Kade Horton, K. Curry Raper, Marty G. New and Megan Rolf Mikayla Moore and Zane Grigsby - OSU College of Veterinary Medicine
Jennifer Rudd, Marie Montelongo, Rosslyn Biggs, DVM, and Tim Snider - OSU Department of Animal and Food Sciences
Addie Womack, Ally Grote, Amber Wells, Blake K. Wilson, C.W. Salisbury, D. Hagen and D.W. Montgomery, F.M. La Manna, Gretchen Maf, Jacee De Vries, Jasmine A. Markey, J. Matty, Kathryn Hearn and Kris HineyMike Major, Morgan L. Denzer, Morgan Pfeifer, Paul Beck, Ranjith Ramanathan and Ryan Reuter, T.J. Garcia and T.P. Vining - OSU Extension
D.L. Zook, E.H. Ward and Scarlett King - OSU School of Electrical and Computer Engineering
Daqing Piao - Other
B.M. Freking - USDA-Agricultural Research Service
M.R. Beck and Stacey Gunter

