Regional Cropland and Pasture Values
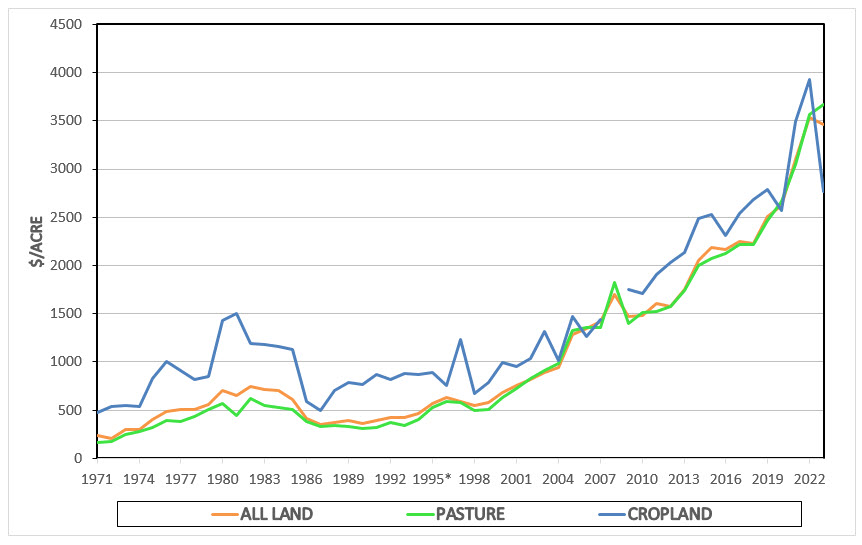
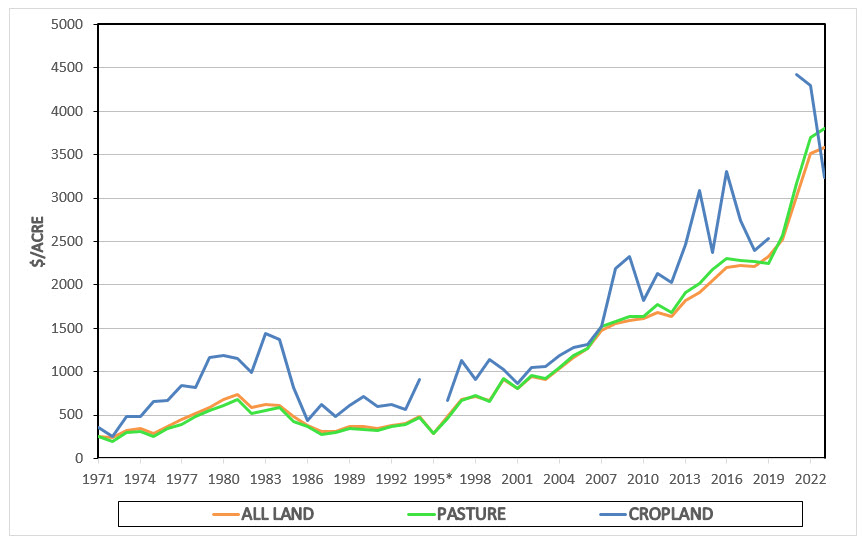
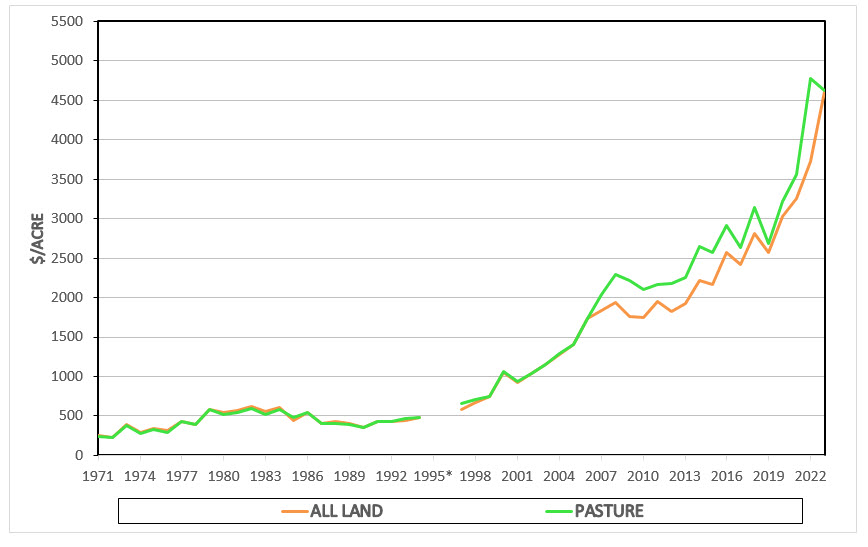
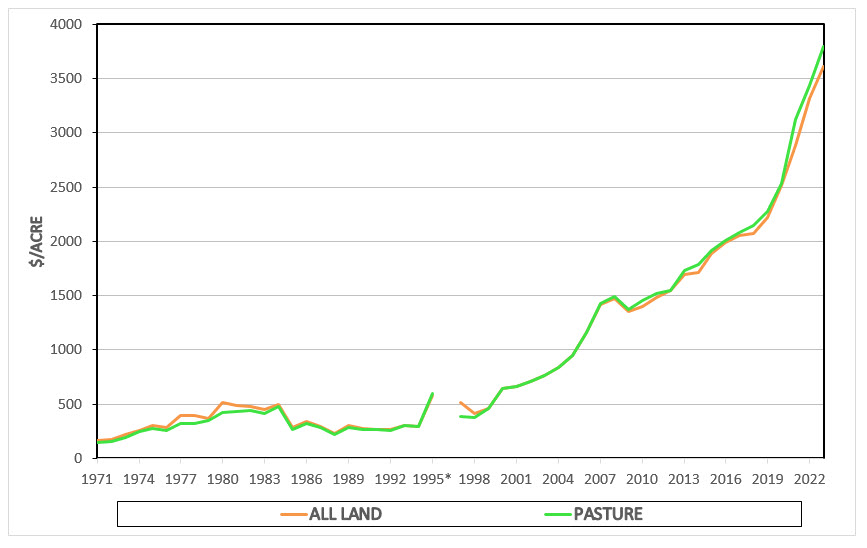
Oklahoma is divided in eight regions with each region composed of counties similar in terms of topography, crops produced, and population influences. A chart and table are provided for each region. Each chart and table shows annual average values for all land, cropland, and pasture. Only tracts 40 acres in size or larger selling up to $3,000 per acre are included in the averages through 2007. Beginning in 2008 and once again in 2021, the market ceiling was increased to $6000 and $9000, respectively. Per acre values shown for cropland and pasture are the averages of tracts having 85%+ cropland and pasture utilization. Because of unavoidable statewide data collection difficulties, relatively less sale data is available for 1995 and 1996. As a result, caution is advised when analyzing land patterns and trends during this timeframe.
Charts
Panhandle land values for all land, pasture, and cropland.
West-Northwest land values for all land, pasture, and cropland.
West-Northwest Land Values - Table
Southwest land values for all land, pasture, and cropland.
Central-North Central land values for all land, pasture, and cropland.
Central-North Central Land Values - Table
South Central land values for all land, pasture, and cropland.
South Central Land Values - Table
Northeast land values for all land, pasture, and cropland.
East-Northeast land values for all land, pasture, and cropland.
East-Northeast Land Values - Table
Southeast land values for all land, pasture, and cropland.


