County Agricultural Land Value Changes
County agricultural land values in Oklahoma have changed over the past 40+ years. The 1973-75, 2012-2014, and 2021-2023 weighted-average land value maps are color coded from light to dark, with the darkest colors showing the highest average land values. The percent change map shows changes in county land values over the past ten years between 2012-2014 and 2021-2023.
Charts are based on a three-year weighted average and include tracts 40 acres in size or larger selling for up to $3,000 through 2007. Beginning in 2008 and once again in 2021, the market ceiling was increased to $6000 and $9000, respectively. This reflects higher Oklahoma agricultural real estate values over time. The weighted average formula was selected due to an insufficient number of annual sales data at the county level and provides improved reliability when analyzing land value patterns and trends over time.
Percent Change 2012-14 to 2021-23
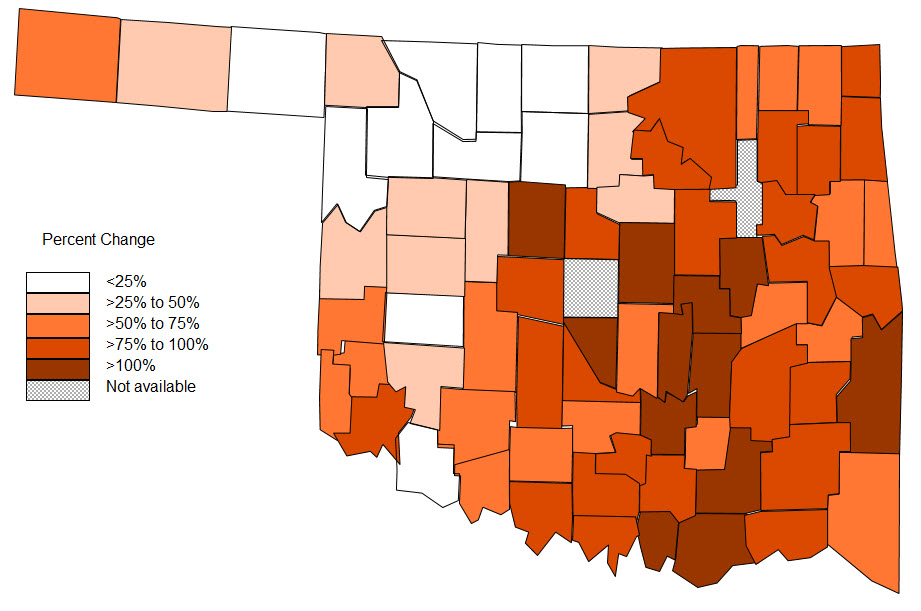
The magnitude of the shift in agricultural land values is shown on this map. Much of the greatest appreciation observed over the past ten years has been in the eastern two-thirds of the state. Tulsa and Oklahoma Counties were omitted due to an insufficient number of observations.
2021-2023 Average Land Values
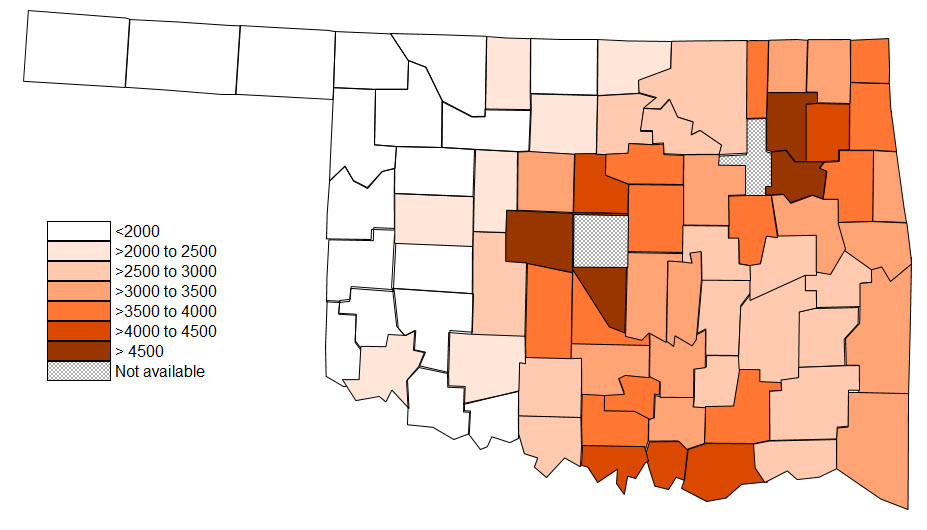
Relative values have changed considerably over many areas of the state during the past ten years. The highest average land values remain in the Tulsa and Oklahoma City metropolitan areas in addition to northeastern Oklahoma and the I-35 corridor in southern Oklahoma. Very few sales observations in Tulsa and Oklahoma Counties met these criteria; therefore they were omitted from this map.
2012-2014 Average Land Values
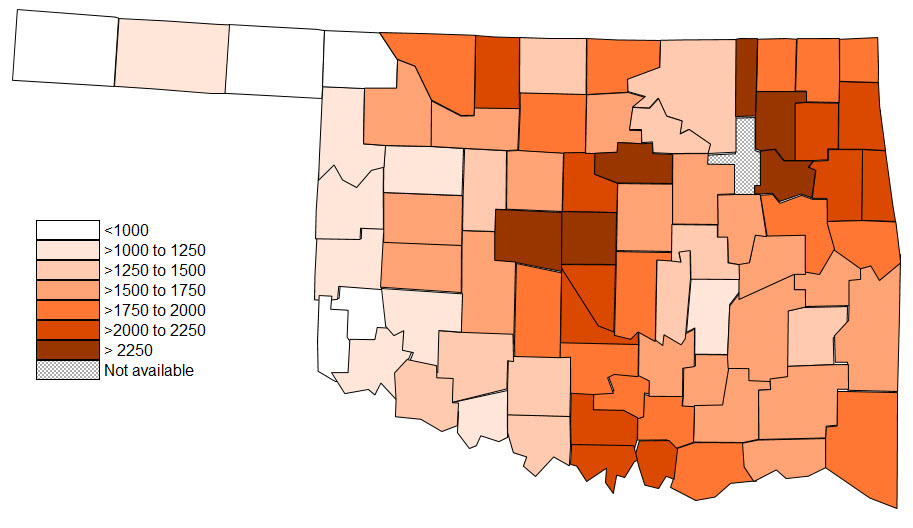
During this timeframe, the highest agricultural land values were in central and south-central Oklahoma along the I-35 corridor together with most of northeastern Oklahoma. Land values were generally less than $1500 per acre in the western one-third of the state. Very few sales observations in Tulsa County met these criteria; therefore it was omitted from this map.
1973-1975 Average Land Values

In the 1973-75 period, the highest agricultural land values were in central and north central Oklahoma. In general, the dollar values in far western Oklahoma and the panhandle were in the same range as the east and southeast parts of the state. Except for the central, north central, and metropolitan areas surrounding Tulsa and Oklahoma City, land values were less than $500 per acre. Only sales tracts 40 acres in size or larger selling for $3,000 per acre or less are included.
County Agricultural Land Value Changes
Tracts >= 40 Acres Selling for <=$3,000/Acre ($6000 beginning in 2008 and $9000 beginning in 2021), Weighted Average
| County | 2012-2014 Average Value, $ | 2021-2023 Average Value, $ | Percent Change |
|---|---|---|---|
| Adair | 2028 | 3430 | 69% |
| Alfalfa | 2182 | 2174 | 0% |
| Atoka | 1573 | 3572 | 127% |
| Beaver | 736 | 862 | 17% |
| Beckham | 1212 | 1865 | 54% |
| Blaine | 1458 | 2164 | 48% |
| Bryan | 1847 | 4165 | 126% |
| Caddo | 1585 | 2574 | 62% |
| Canadian | 2624 | 4603 | 75% |
| Carter | 2204 | 3947 | 79% |
| Cherokee | 2166 | 3616 | 67% |
| Choctaw | 1624 | 2946 | 81% |
| Cimarron | 650 | 1105 | 70% |
| Cleveland | 2224 | 5802 | 161% |
| Coal | 1633 | 2632 | 61% |
| Comanche | 1334 | 2316 | 74% |
| Cotton | 1127 | 1832 | 63% |
| Craig | 1814 | 3148 | 74% |
| Creek | 1665 | 3217 | 93% |
| Custer | 1633 | 2076 | 27% |
| Delaware | 2007 | 3743 | 87% |
| Dewey | 1218 | 1714 | 41% |
| Ellis | 1045 | 1055 | 1% |
| Garfield | 1950 | 2241 | 15% |
| Garvin | 1856 | 3206 | 73% |
| Grady | 1905 | 3713 | 95% |
| Grant | 1460 | 1760 | 21% |
| Greer | 865 | 1407 | 63% |
| Harmon | 972 | 1474 | 52% |
| Harper | 918 | 1216 | 32% |
| Haskell | 1651 | 2567 | 55% |
| Hughes | 1199 | 2678 | 123% |
| Jackson | 1226 | 2450 | 100% |
| Jefferson | 1459 | 2612 | 79% |
| Johnston | 1752 | 3187 | 82% |
| Kay | 1961 | 2485 | 27% |
| Kingfisher | 1718 | 3478 | 102% |
| Kiowa | 1176 | 1567 | 33% |
| Latimer | 1498 | 2689 | 79% |
| Leflore | 1720 | 3478 | 102% |
| Lincoln | 1568 | 3682 | 135% |
| Logan | 2196 | 4105 | 87% |
| Love | 2032 | 4019 | 98% |
| Major | 1566 | 1892 | 21% |
| Marshall | 2053 | 4121 | 101% |
| Mayes | 2229 | 4039 | 81% |
| McClain | 2191 | 3978 | 82% |
| McCurtain | 1792 | 3083 | 72% |
| McIntosh | 1527 | 2637 | 73% |
| Murray | 1852 | 3511 | 90% |
| Muskogee | 1762 | 3203 | 82% |
| Noble | 1744 | 2576 | 48% |
| Nowata | 1847 | 3040 | 65% |
| Okfuskee | 1370 | 2791 | 104% |
| Oklahoma | |||
| Okmulgee | 1749 | 3528 | 102% |
| Osage | 1404 | 2577 | 84% |
| Ottawa | 1979 | 3667 | 85% |
| Pawnee | 1281 | 2505 | 96% |
| Payne | 2657 | 3937 | 48% |
| Pittsburg | 1523 | 2708 | 78% |
| Pontotoc | 1617 | 3255 | 101% |
| Pottawatomie | 1913 | 3178 | 66% |
| Pushmataha | 1547 | 2768 | 79% |
| Roger Mills | 1141 | 1465 | 28% |
| Rogers | 2468 | 4907 | 99% |
| Seminole | 1308 | 3014 | 130% |
| Sequoyah | 1823 | 3246 | 78% |
| Stephens | 1494 | 2559 | 71% |
| Texas | 1030 | 1343 | 30% |
| Tillman | 1303 | 1524 | 17% |
| Tulsa | |||
| Wagoner | 2465 | 4793 | 94% |
| Washington | 2515 | 3996 | 59% |
| Washita | 1591 | 1904 | 20% |
| Woods | 1885 | 1740 | -8% |
| Woodward | 1512 | 1855 | 23% |