Seasonality in 2025
It has been hard not to be obsessed with the cattle markets in 2025. No price record has been safe as the market continues to climb. It is hard to remember in the scorching heat that the fall and a highly anticipated cattle marketing season are coming soon. We certainly don’t know what prices will be in the fall of 2025, but we do know there are some time-tested principles that can be applied to help us digest the market information.
Seasonality refers to the price trends that are observed within the year. They are often tied to biological or resource factors. An example I use in meetings is Yellowstone National Park. A quick Google search or ChatGPT inquiry tells us that if we want to see baby animals at Yellowstone, visit in the spring to early summer. That trend follows through to the cowherd. As the bulk of calves are born in the spring, it creates a glut of supply hitting the fall markets as weaning occurs. This, combined with feed availability, demand, and other factors, creates the high in the spring, low in the fall price seasonality that we see in the calf market. I find it interesting that even in the 2023 calendar year when prices were pushing through to new levels, the calf market took a pause in the fall to allow the market to absorb the extra supply on the market. The same trend applies to the cull cow markets. Consider our normal fall activities. We gather calves to wean or sell, preg check cows, and part ways with the opens before we must invest in them in the winter. This leads to another high supply period which is a mismatch to the market’s demand for those cows.
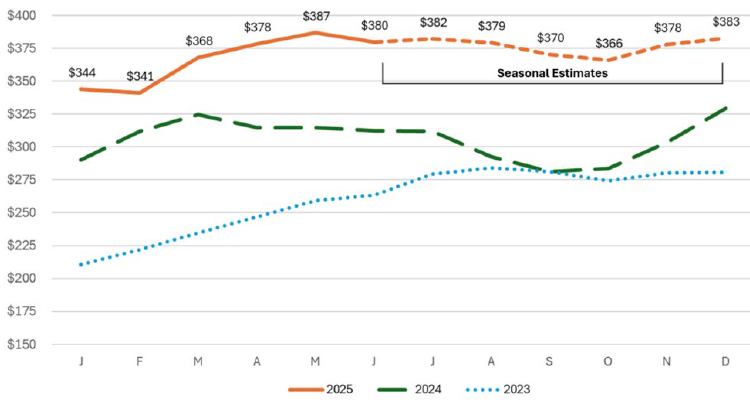
Figure 1. 2023-25: 500-600lb, M&L #1 Combined OK, Steer Prices. Data via USDA, LMIC, seasonal calculations by author
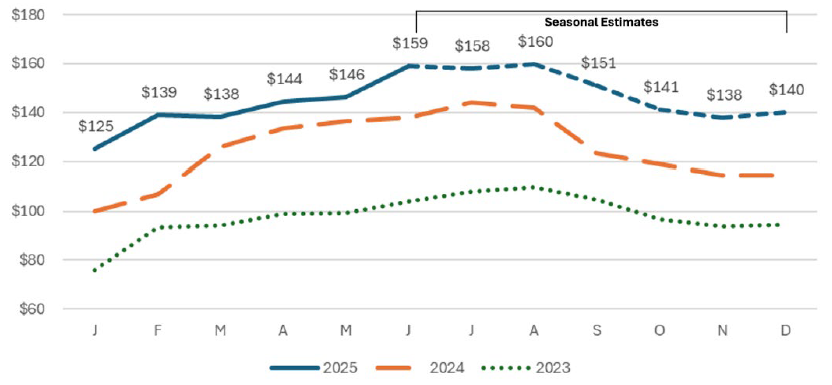
Figure 2. 2023-25 Slaughter Cows, Boners, 80-85%, Avg Dressing. Data via USDA, LMIC, seasonal calculations by author
Seasonality is limited as a price prediction tool but still has its place in the toolbox of considerations. It is a good way of incorporating the norms of the markets but struggles to consume the trendier factors at play. For example, the cull cow market is closely tied to the 90% lean trimmings market which is a primary ground beef component. Given a historically small cowherd, higher retail meat prices, and trade disruptions, could the cull cow market hold together longer into the fall than it has historically? For context, the local grocery store that I frequent has had the price of 80/20 ground beef jump over a dollar in roughly the last two weeks. For the past six months I have been waiting to see that price move. Again, how the market interprets the current information will influence how much seasonal pressure we experience.
Seasonality suggests softer market prices in the fall for calves and cull cows; it always does and is usually correct to some extent. As the manager of your operation, is there something in the production system that could be altered to avoid marketing cattle in those periods? Can we market earlier or later? Is there a way to alter our forage system to minimize the cost of retaining cattle through those periods? Can we add some additional value to offset the additional cost of keeping cattle? As we move into the fall, be aware of the seasonal market trends and consider how seasonality impacts your operation.
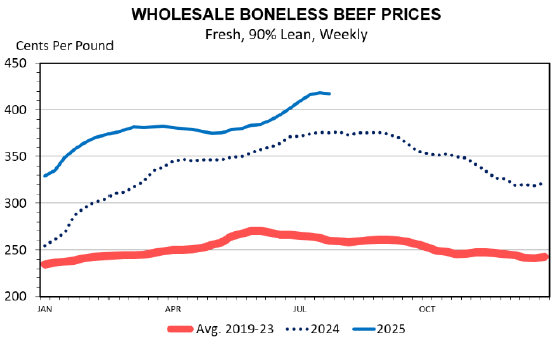
Figure 3. Wholesale Boneless Beef Prices, Fresh, 90% Lean, Weekly. Data Source USDA-AMS Livestock Marketing Information Center
| Item | Unit | Average Price |
|---|---|---|
| DAP | $/ton | $848.42 |
| Urea | $/ton | $652.14 |
| Potash | $/ton | $489.84 |
| Diesel | $/gal | $2.91 |
| Item | Unit | Average Price |
|---|---|---|
| 20% Cubes | $/ton >24 ton | $352.57 |
| 20% Cubes | $/bag | $10.77 |
| 14% Creep | $/ton> 24 ton | $298.70 |
| 14% Creep | $/bag | $9.20 |
| DDG | $/ton | $265.13 |
| Wheat Midds | $/ton | $225.00 |
| Gluten | $/ton | $247.50 |
| CS Meal | $/ton | $517.50 |
| Soy Hulls | $/ton | $231.50 |
| Weight | $/lb | Value/hd | Added lb. | Added $ | $/lb Added |
|---|---|---|---|---|---|
| 331 | $5.3570 | $1,773.17 | |||
| 370 | $5.0342 | $1,862.65 | 39 | $89.49 | $2.29 |
| 428 | $4.6098 | $1,972.99 | 58 | $110.34 | $1.90 |
| 473 | $4.3863 | $2,074.72 | 45 | $101.73 | $2.26 |
| 534 | $4.0430 | $2,158.96 | 61 | $84.24 | $1.38 |
| 574 | $3.8972 | $2,236.99 | 40 | $78.03 | $1.95 |
| 621 | $3.7375 | $2,320.99 | 47 | $83.99 | $1.79 |
| 670 | $3.6084 | $2,417.63 | 49 | $96.64 | $1.97 |
| 728 | $3.5085 | $2,554.19 | 58 | $136.56 | $2.35 |
| 772 | $3.3836 | $2,612.14 | 44 | $57.95 | $1.32 |
| 878 | $3.1927 | $32,803.19 | 106 | $191.05 | $1.80 |
| 922 | $3.1785 | $2,930.58 | 44 | $127.39 | $2.90 |
| Value | Long Stocker Run | Long Stocker Run | Short Stocker Run | Short Stocker Run | Heavy Stocker Run | Heavy Stocker Run |
|---|---|---|---|---|---|---|
| Starting | 331 | $1,773.17 | 331 | $1,773.17 | 621 | $2,320.99 |
| Ending | 992 | $2,930.58 | 534 | $2,158.96 | 922 | $2,930.58 |
| Total Grain | 591 | $1,157.41 | 203 | $385.80 | 301 | $609.59 |
| VOG | $1.96 |
$1.90 | $2.03 |