

Cow-Calf Corner | August 17, 2026
The Hay Situation
Derrell S. Peel, Oklahoma State University Extension Livestock Marketing Specialist
The August Crop Production report from USDA-NASS included forecasts for 2026 hay production. The hay crop year runs from May – April so the total hay supply includes May 1 carryover hay stocks plus current year production. Total U.S. May 1 hay stocks were up 19.5 percent year over year, but total hay production is expected to be down 9.3 percent leading to a 7.2 percent decrease in the 2026 total hay supply (Table 1a-1d.).
Table 1a-1d shows the top ten states for each category: May 1 Stocks, All Hay Production, Alfalfa Hay Production and Other Hay Production. The top ten states for May 1 stocks accounted for 62.6 percent of total May 1 stocks with stocks higher year over year for each of the ten states. Total May 1 stocks were up 19.5 percent over the 2015-2024 average.
| Rank | State | 1,000 Tons | % chg.* |
|---|---|---|---|
| 1 | TX | 2000 | +11.2 |
| 2 | SD | 1950 | +10.9 |
| 3 | MO | 1650 | +50.9 |
| 4 | OK | 1650 | +48.4 |
| 5 | NE | 1550 | +42.5 |
| 6 | KS | 1530 | +51.2 |
| 7 | ND | 1270 | +17.6 |
| 8 | KY | 1100 | +48.1 |
| 9 | MT | 1050 | +13.0 |
| 10 | MN | 820 | +56.8 |
| Top 10 | 14570 | +30.8 | |
| U.S. | 2026 | 23287 | +19.5 |
| 2025 | 24091 | ||
| 10 yr avg. | 2015-2024 | 19486 |
| Rank | State | 1,000 Tons | % chg.* |
|---|---|---|---|
| 1 | TX | 8140 | -14.8 |
| 2 | MO | 5993 | -2.0 |
| 3 | NE | 5093 | -14.6 |
| 4 | OK | 4960 | -10.8 |
| 5 | KY | 4550 | -10.1 |
| 6 | ID | 4335 | -13.6 |
| 7 | KS | 4317 | -20.7 |
| 8 | CA | 4136 | -24.6 |
| 9 | SD | 4090 | -24.8 |
| 10 | MT | 4050 | -19.0 |
| Top 10 | 49664 | -15.3 | |
| U.S. | 23287 | -9.3 | |
| 123031 | |||
| 10 yr avg. | 124862 |
| Rank | State | 1,000 Tons | % chg.* |
|---|---|---|---|
| 1 | ID | 3567 | -17.2 |
| 2 | IA | 3120 | +18.0 |
| 3 | CA | 3080 | -24.0 |
| 4 | WI | 2952 | +12.7 |
| 5 | NE | 2853 | -14.2 |
| 6 | MT | 2700 | -23.5 |
| 7 | SD | 2660 | -21.8 |
| 8 | MN | 2446 | +1.4 |
| 9 | CO | 2244 | -10.5 |
| 10 | ND | 2112 | -1.6 |
| Top 10 | 27734 | -10.4 | |
| U.S. | 47685 | -10.4 | |
| 50213 | |||
| 10 yr avg. | 53230 |
| Rank | State | 1,000 Tons | % chg.* |
|---|---|---|---|
| 1 | TX | 7840 | -12.9 |
| 2 | MO | 5360 | -1.9 |
| 3 | OK | 4500 | -8.1 |
| 4 | KY | 4300 | -6.8 |
| 5 | TN | 3300 | -14.0 |
| 6 | AR | 2940 | +19.7 |
| 7 | KY | 2700 | -15.5 |
| 8 | VA | 2280 | -2.9 |
| 9 | NE | 2240 | -15.1 |
| 10 | AL | 1976 | -0.8 |
| Top 10 | 37436 | -7.4 | |
| U.S. | 65586 | -8.4 | |
| 72818 | |||
| 10 yr avg. | 71632 |
*% Change 2026 to 2015-2024 Average
Total U.S. hay production in 2026 is expected to be down 9.3 percent from the 2015-2024 average and down 7.9 percent year over year. All of the top ten hay production states are down individually and the group is down 15.3 percent from the ten-year average while accounting for 43.8 percent of total U.S. hay production.
The top ten states for alfalfa hay production are mostly northern beef cow states and/or big dairy states with 2026 alfalfa hay production down 10.4 percent from the ten-year average. These states accounted for 58.2 percent of total U.S. alfalfa hay production. Alfalfa hay production was down in seven of the top ten states but up in Iowa, Wisconsin and Minnesota. Total U.S. alfalfa hay production is forecast down 10.4 percent from the ten-year average and down 5.0 percent year over year.
Total 2026 other hay production is forecast to be down 8.4 percent from the ten-year average and down 9.9 percent from last year. The top ten states for other hay production account for 57.1 percent of total other hay production. Nine of the ten largest other hay producing states are down from the ten-year average with the increase in Arkansas the sole exception.
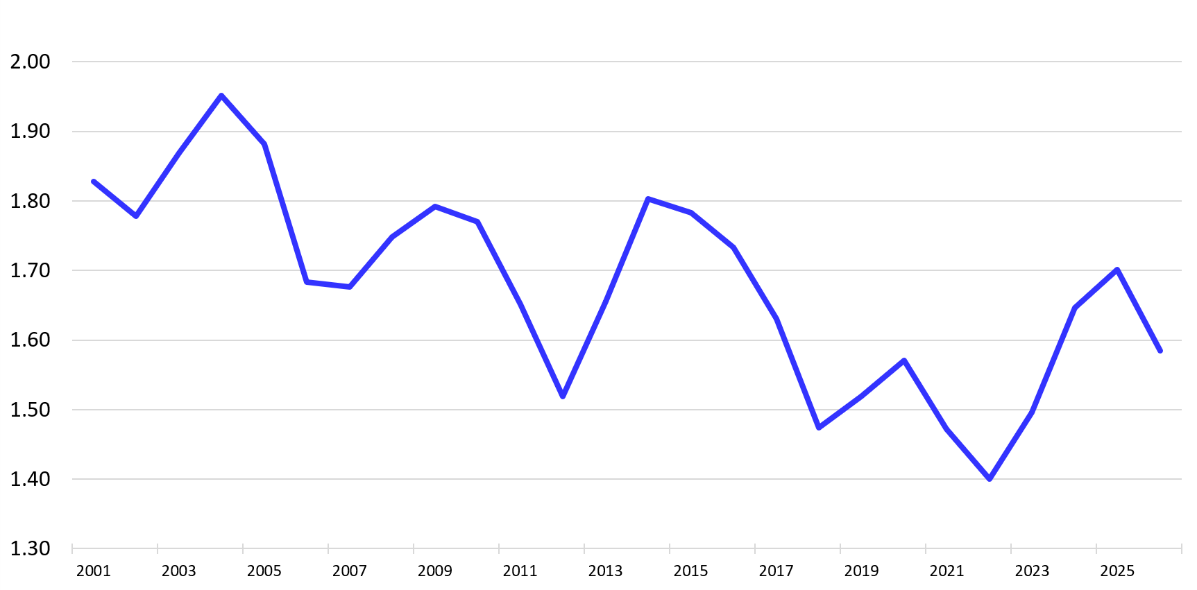
Figure 1. Hay Supple per Head - All Cattle and Calves Inventory/Total Hay Supply, Tons
A broad measure of the relative hay situation is the hay supply per head of cattle (Figure 1). Figure 1 shows total annual hay supply divided by the January 1 inventory of all cattle and calves. For 2026 the hay supply per head is 1.59 tons, down from last year but about equal to the average of the past 15 years.
The Basics of Livestock Risk Protection, Part 1
Scott Clawson, Oklahoma State University NE Area Extension Agricultural Economist
Livestock Risk Protection (LRP) has gained popularity in the cattle community over the past several years. Hopefully, this can help answer some of the fundamental questions surrounding it.
What is it?
LRP is an insurance product from USDA-Risk Management Agency. Think of it as the cattle producer’s version of crop insurance.
What does it do?
LRP protects against price declines in the cattle market. This product addresses price risk only. Production risk (mortality, gains, etc.) is still with the producer.
How does it work?
A producer will look at the length of coverage (13-52 weeks) and the coverage price (75%-100%) offered that day. The producer will select the length that closely matches how long price protection is needed and a coverage price (“price floor”) that they feel is appropriate. At the end of the insured period, if the actual ending value is ABOVE the coverage price, no indemnity is paid. If it is below, the producer will receive a payment to offset the loss.
How is the ending value determined?
The ending value is linked to the CME Feeder Cattle Index, not the actual price that the cattle are sold for. The CME Feeder Cattle Index is then adjusted if needed to fit the cattle that were insured based on their sex, weight, etc. which are all known upfront. Fortunately, Oklahoma’s cattle numbers provide a sizeable contribution to the CME Feeder Cattle Index which means our Oklahoma prices are well represented in the index.
What are the benefits versus using options or hedging?
One significant benefit is it being a per head product. It can be used on a variety of classes of cattle from lightweight calves to heavier yearlings. There is also a fed cattle and an unborn option. Another feature is that should prices continue to rise, a producer will still benefit from the upward price move. Lastly, the premium is paid at the end of the policy so it will not tie up operating capital.
What should someone do that is interested in implementing LRP?
Gather more information. Contact insurance providers that sell this product and discuss your specific situation. Also, there is an abundance of information from cooperative extension services across the country, and LRP price quotes are publicly available daily. A quick online search will satisfy those.
In my discussions with Oklahoma cattle producers, I regularly hear references to the strong prices of 2014 and the decline in 2015. This is the tool that can prevent us from fully realizing that price risk. However, even in these record price years we have experienced periods of retreat in the markets that have had serious negative financial impacts on ranches. LRP is the mechanism we can use to protect equity and cash flow should the market turn, temporarily or cyclically.
Part 2 will address how Oklahoma producers used LRP in 2025/26.
Calf Management for Early Weaning
Paul Beck, Oklahoma State University Extension Beef Cattle Nutrition Specialist
As Mark Johnson discussed in his article on August 3, early weaning substantially reduces the nutrient requirements of the cow and forage demand during drought or periods of limited pasture. Once the decision to early wean has been made, however, the focus needs to shift to the calf. These calves are younger, lighter and have different nutritional and management needs than the 500- to 600-pound calves we normally wean in the fall.
Calves can be successfully weaned at 45 to 60 days of age. For most spring-calving herds considering early weaning during late summer, calves will be 3 to 5 months old and may weigh 300 to 400 pounds. At this age, calves are fully capable of consuming and utilizing a high-quality diet. The challenge is making the transition from milk and forage to a prepared diet as smooth as possible.
Young Calves are Efficient
One advantage of managing an early-weaned calf is its excellent feed efficiency. Lightweight calves grown in dry lot on the diet below can be expected to need only 4 to 5 pounds of feed per pound of gain when properly managed. Depending on frame size and growth potential, growing diets can be formulated for gains of 2 to 2.5 pounds per day without adding excessive fat cover.
A 300- to 400-pound calf can consume up to 3% of its body weight in dry matter daily once it is fully adapted to the diet. Because feed intake is relatively low while requirements for muscle and skeletal growth are high, these diets need to be nutrient dense. Calves weighing less than 400 pounds require diets containing 18% crude protein on a dry matter basis, compared to 15% crude protein for heavier conventionally weaned calves. We should also provide plenty of high quality clean and palatable hay free-choice.
The objective is not to feed these calves like finishing cattle. They need a highly palatable growing diet containing adequate protein, energy, minerals and effective fiber.
An example diet for lightweight early-weaned calves is shown below. This is only an example; producers should work with their county Extension educator, nutritionist or feed supplier to develop a ration using palatable feeds that are locally available and economical.
| Ingredient | % of Ration, As Fed basis | Pounds per ton |
|---|---|---|
| Cottonseed Hulls | 14.0 | 280 |
| Alfalfa pellets | 140. | 280 |
| Rolled corn | 20.0 | 400 |
| Distiller’s Grains with solubles | 25.0 | 500 |
| Soybean hulls | 15.7 | 314 |
| Soybean meal | 5.0 | 100 |
| Cane molasses | 5.0 | 100 |
| Limestone | 1.0 | 20 |
| Salt | 0.25 | 5 |
| Diet Composition, DM basis | ||
| Crude Protein, % | 18.1 | |
| TDN, % | 68.8 | |
| NEm, Mcal/lbs | 0.72 | |
| NEg, Mcal/lbs | 0.45 |
The First Few Days are Critical
Getting calves to eat and drink quickly is more important than trying to maximize gain or least cost feeding immediately after weaning. Feed should be fresh, palatable and easy for calves to find. Good-quality hay helps attract calves to the bunk, and clean, readily accessible water is essential. Avoid dusty, stale, or fermented feeds such as silage during early weaning.
Reduce Stress at Weaning
Early weaning is already a major change for a calf. Whenever possible, avoid combining weaning with other stressful events, such as transportation long distances, castration, and dehorning.
Fenceline weaning can be particularly useful because calves maintain visual and limited physical contact with their dams while learning their new routine. Keeping early-weaned calves at the ranch also avoids adding transportation, commingling and a completely unfamiliar environment at the same time they are adjusting to weaning. Calves should also be familiar with people, feed bunks and water sources before separation from their dams whenever practical.
Think About Marketing and Management Before Weaning
Before pulling calves off the cows, producers should know what they are going to do with them. Early weaning does not automatically mean calves need to be sold immediately.
Calves can be retained and grown to a more traditional marketing weight by grazing on high-quality forage when it becomes available or growing in dry lot on a properly formulated ration. With efficient feed conversion, retaining early-weaned calves may be an attractive alternative when selling very lightweight calves. Early weaning can be an extremely useful management tool, particularly when forage is limited. It is key to recognize that removing the calf from the cow is only the first step.
Dr. Mark Johnson discussed the benefits of early weaning and considerations for cattle operations on SunUpTV from August 8, 2026.
Source
David Lalman. The Use of Early Weaning in Practical Cattle Management - AFS-3278