Oklahoma Farm and Ranch Custom Rates, 2017-2018
This Current Report summarizes data collected from Oklahoma farmers, ranchers and
custom operators during the fall of 2017. Respondents were recipients of a mailing
by the Oklahoma Agricultural Statistics Service. Custom work is defined as machine
operations performed for the customer with the custom operator furnishing the machine,
fuel, labor and other inputs directly associated with the machine. Custom operators
do not usually furnish materials such as seed or fertilizer unless it is explicitly
stated. The change in custom rates was mixed since the 2015 survey. While relatively
low fuel prices over the past several years may have helped stabilize custom rates,
higher repair and ownership costs have more than offset the cost savings in many situations.
Approximately 260 surveys were returned with usable data.
Summary Procedure
The rates quoted herein were collected by a survey of both farmers and custom operators.
A list of over 150 operations was provided from which each respondent quoted rates
for only selected operations. Some respondents quoted rates for only one or two operations
while others were familiar with rates for many of the machines listed. Fair rates
are negotiated. Regional or state average rates may be used as a beginning point for
discussion. However, differences in operations, requirements, and circumstances may
impact rates.
The rates summarized on the inside pages were edited to remove those replies for which
the respondent’s interpretation of the information being requested did not match the
interpretation of other respondents.
Interpreting the Rate Tables
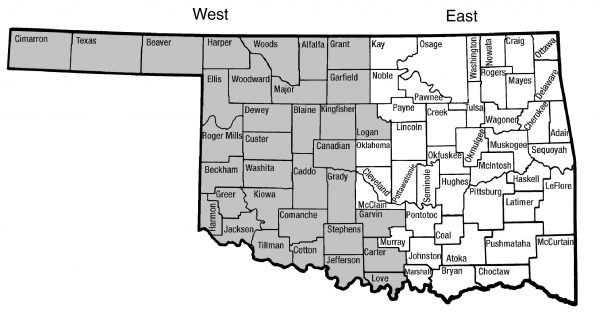
A statewide rate summary for each operation is quoted in the included table. If available, separate quotes are listed for each area of the state as shown in Figure 1. The number of estimates obtained, the average rate, and the median rate are shown. The average rate for a specific operation provides an estimate of the prevailing charge with its reliability improving as the number of responses increase. Median values provide an additional measure of the central tendency of the survey response distribution. The cost of following up with individual surveys prohibited questioning or affirming doubtful replies. In most cases the number of observations was insufficient to allow statistical analysis. Results must be interpreted, therefore, with these limitations in mind.
Figure 1. Regions used in reporting custom rate survey results.
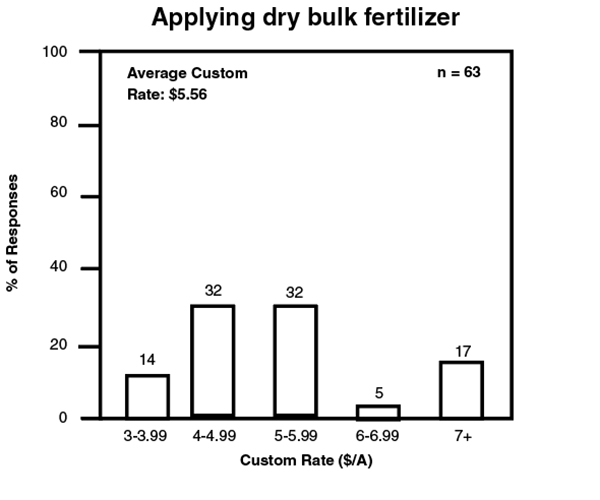
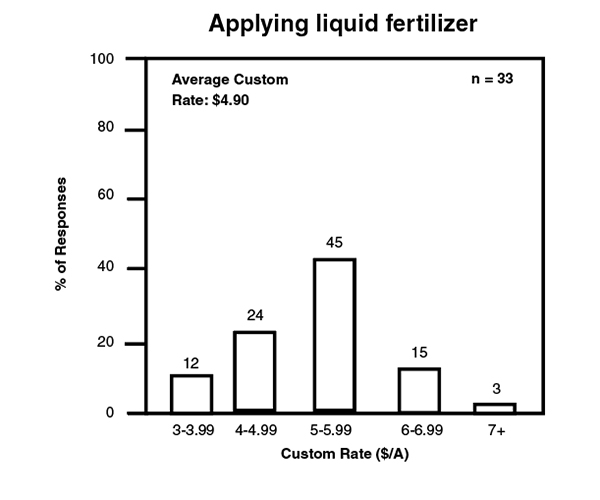
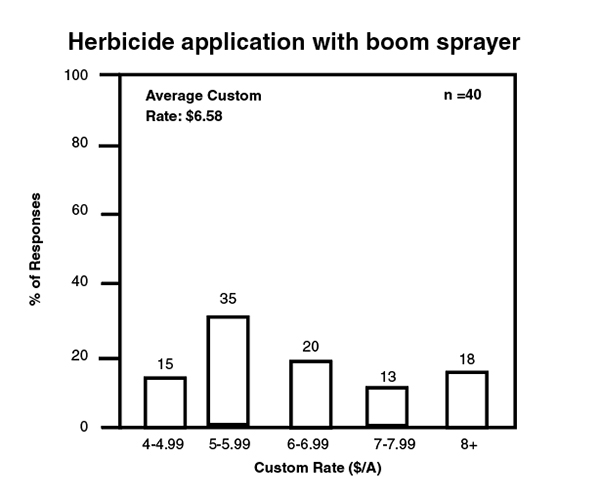
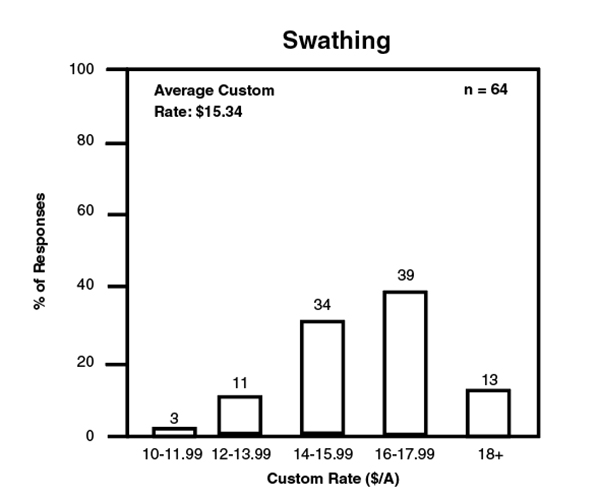
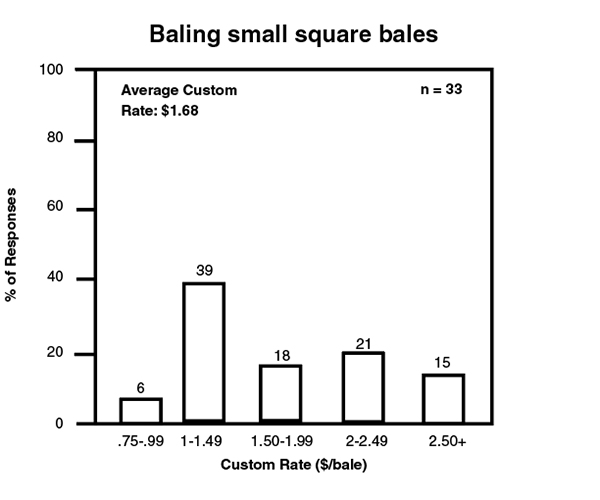
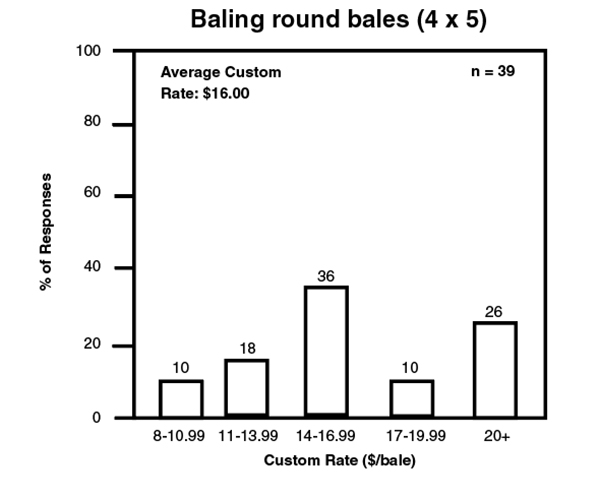
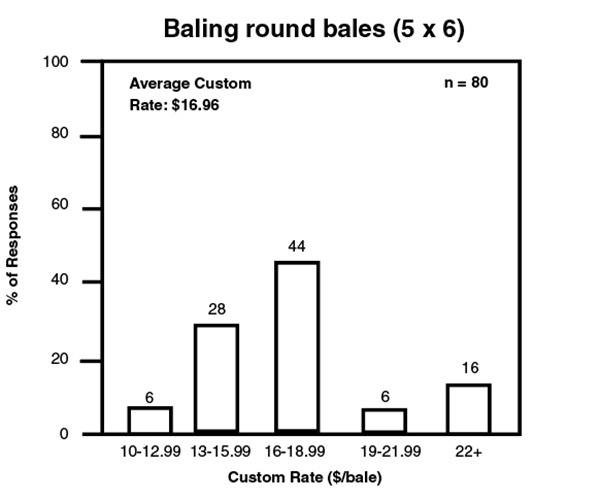
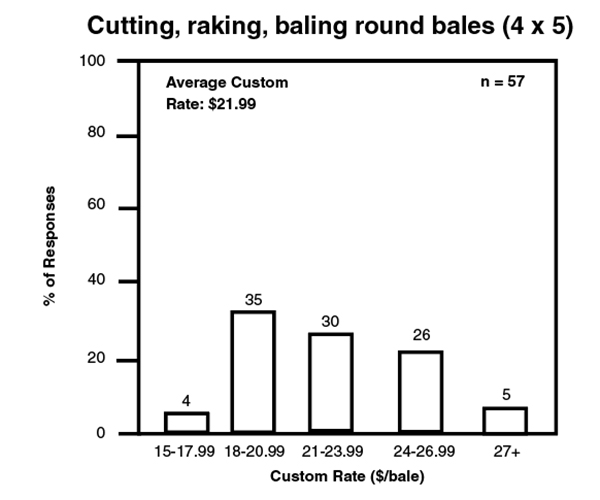
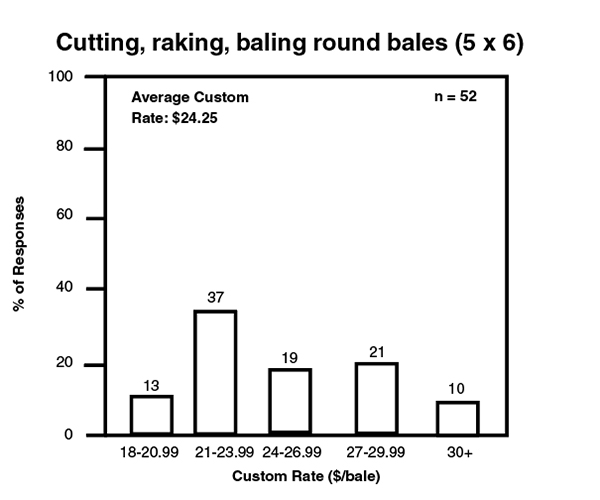
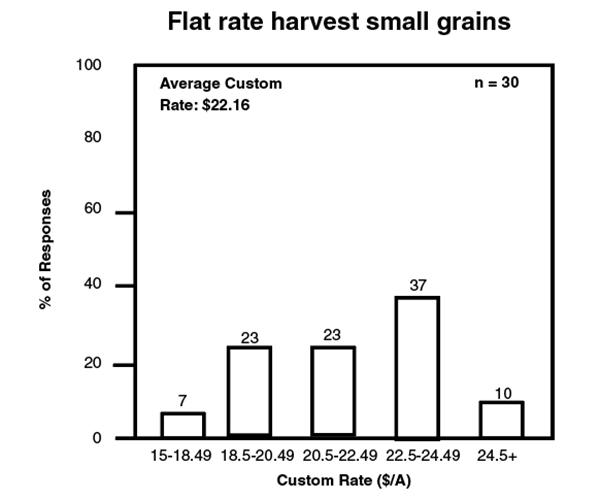
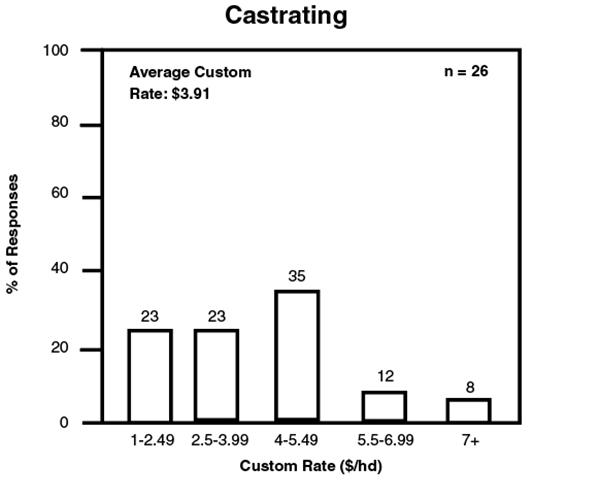
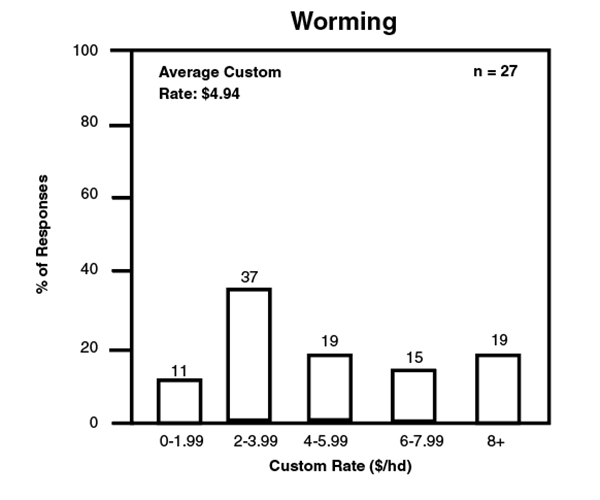
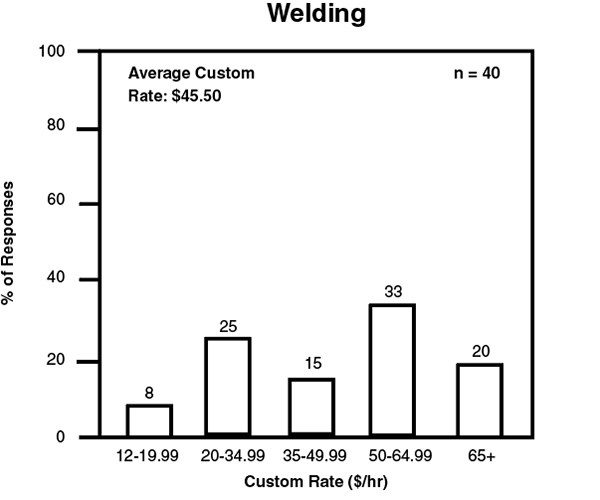
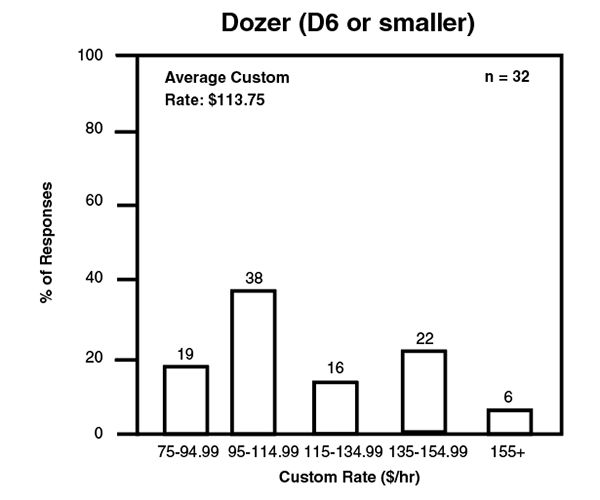
Figure 2 shows the distribution of survey responses for operations with at least 25
observations. For example, a distribution of 80 responses for baling a 5×6 round bale
is one of several graphs shown. None of the respondents reported a rental rate less
than $10 per bale, 6 percent reported a rental rate between $10 and $13 per bale,
28 percent reported a rental rate between $13 and $16 per bale, 44 percent reported
a rental rate between $16 and $19 per bale, 6 percent reported a rental rate between
$19 and $22 per bale, and 16 percent of the respondents reported a rental rate of
$22 or more per bale.
If you are interested in a rate quotation for a specific operation in an area which
shows a small number of reports, consider rates for other areas of the state where
the operation is more common or refer to the statewide summary. Additional adjustments
for field size, terrain and soil type may be necessary.
Figure 2A.
Figure 2B.
Figure 2C.
Figure 2D.
Figure 2E.
Figure 2F.
Figure 2G.
Figure 2H.
Figure 2I.
Figure 2J.
Figure 2K.
Figure 2L.
Figure 2M.
Figure 2N.
Reporting Regions
Area rates are summarized for the State of Oklahoma as shown in Figure 1. Regional differences are apparent in the rate table with higher rates prevailing when:
- Fields are small.
- Soils are heavy.
- Slopes are steep.
- Machines are scarce.
- Custom operators are not available.
Rates tend to be lower than expected when exchange work is common between relatives
and neighbors. Under these circumstances, fixed costs of ownership such as depreciation
and interest on investment (sometimes even labor) tend to be discounted when a rate
is established for a particular job.
Custom Service vs. Ownership
Individual circumstances–cash flow, ownership and operating costs, labor availability,
reliability and timeliness of custom operators, pride of ownership–will influence
an individual’s decision on whether to buy or lease machinery and equipment or custom
hire work done. A worksheet at the end of this article is designed to help evaluate
the cost of machinery ownership and operation.
Possible Advantages of Using Custom Operations
- Ownership costs are avoided.
- Capital and labor can be channeled to other uses.
- Machine use can be readily adjusted to changes in crop mix and market conditions.
- Specialized operations may benefit from experience and skilled operator.
- Jobs may be completed faster using several machines.
Possible Disadvantages of Using Custom Operations
- Service may not be available at the best time.
- Reliability of the custom operator may not be known.
- Rates may be excessive in special situations.
Each manager must choose the best combination of owned and hired machines. The quotations here will be helpful in estimating custom costs and to provide a base figure for agreement on a rate when well established local rates are not available. If you have questions, ask your Extension Educator- Agriculture or Area Agricultural Economics Specialist for additional information.
Considerations to Keep in Mind
Keep in mind there is a wide variation in rates charged for most jobs, even within
the same geographic area, partly because some custom work is done for friends, relatives,
and neighbors at reduced rates, partly because some custom work is done late by farmers
who do their own work first and therefore do not attempt to include the full cost
of machine ownership in their rates, and partly because it is easy to under‑estimate
the full cost of ownership and operation of machinery.
A small number of reports for a given machine in a particular area may not be representative.
In this case, it is particularly important to check rates in other areas or statewide
where a larger number of reports are found.
The author gratefully acknowledges Derrel Kletke, Professor Emeritus and Damona Doye, Associate Director for Extension for past contributions to this publication.
Roger Sahs
Extension Assistant Specialist

