

The Economic Impact of Oklahoma State University's Wheat Breeding Program
Introduction
Oklahoma State University operates a wheat breeding team known as the Oklahoma Wheat Improvement Team. Funding for the program comes, in part, from royalties paid on the varieties developed and protected under the Plant Variety Protection Act. Until recently, the economic impact of the Team’s efforts was unknown. Recently, Lambert et al. (2026) employed statistical tools to look at 17 years of OSU wheat variety use within the state, as well as the changes in average yield and variability resulting from the acres harvested of OSU wheat varieties. The results of the study demonstrate that the Team adds $4.6 million annually to Oklahoma’s wheat crop.
Data and Methods
Data from the USDA’s National Agricultural Statistics Service (2007–2024) on wheat yields, wheat acres planted and harvested and marketed-year-average prices were analyzed. Data were reported for nine agricultural statistical districts (ASD) annually. Due to reporting rules, data for eastern Oklahoma counties were reported as “Other” ASD. Percentages of wheat acres planted to various varieties were collected from USDA NASS, including 100 unique varieties planted over 17 years (see Table 1).
The study estimated the change in annual yields due to OSU and OSU-Clearfield wheat varieties, after controlling for regional growing conditions, changes in wheat production technology and the acres of other planted varieties. The change in wheat revenue in each was calculated using acres harvested, marketing-year-average price and the change in wheat yield attributed to OSU varieties and OSU Clearfield varieties.
The yield model regressed ASD-level yields on a fixed effect for each ASD, the percentage of wheat acres planted to OSU varieties, OSU Clearfield varieties and other varieties, and a non-linear time trend. To compute the impact on yield, we utilized the estimated coefficients on percentages of acres planted to OSU wheat varieties and OSU Clearfield wheat varieties. These estimated coefficients are the change in wheat yield by ASD due a 1% change in the use of these variety groups. When multiplied by the number of acres harvest in each ASD, the change in wheat production by ASD and year is calculated. This change in wheat production due to the adoption of OSU varieties is then multiplied by marketing-year-average price to find the change in revenue in each ASD by year. When summed across ASDs, the yearly change in revenue due to OSU variety adoption is computed. Last, the annual impacts are summed across years to get the total impact of 17 years of OSU wheat use and the annual average computed. The calculated change in revenue is outlined in equation 1.
(1) Change in revenue= ΣyearΣASD%acres harvest from OSU varietiesASDyear ×yield increaseASDyear ×Acre harvestedASDyear ×MYA Priceyear.
Results
The estimate regression coefficients represent the impact of a 1% change in adoption of OSU and other varieties. Wheat yield impacts varied by ASD, but statewide average yield increased by 0.78 bushels per acre for every 1% increase in OSU variety usage. Table 1 and Table 2 report the economic impacts of OSU’s wheat breeding efforts. Returns vary by ASD, with the most significant impacts in the North Central, Southwest and West Central districts. These districts had the largest wheat acres harvested and the highest adoption of OSU and OSU Clearfield varieties (Figure 2). Returns to OSU and OSU Clearfield varieties average $4.619 million annually (in 2023 $s) and totaled $78.6 million over the 17 years of the study’s data.
Conclusions
OSU’s Wheat Improvement Team clearly makes significant economic contributions to the Oklahoma agricultural economy. With an annual average impact of $4.6 million and the Team’s operating expenses, including salaries, totaling $537k annually (DeVuyst et al., 2025), the return on investment is 860%. Given that most of the funding for the program comes from royalties, the return to taxpayer dollars is even higher than the 860% ROI.
| Source (#) | Oklahoma wheat varieties (2007-2023) |
|---|---|
| OSU (23) | Chisolm, Custer, Deliver, Duster, Endurance, Gallagher, Garrison, GreenHammer, Iba, Intrada, OK101, OK102, OKBullet, OKCorral, RubyLee, 2174, Bentley, BakerAnn, ButlerGold, Showdown, SmithGold, Triumph64, Uncharted |
| OSU-Clearfield (4) | Centerfield, DoublestopCL, Okfield, StradCLPlus |
| KSU (1) | LCSChrome, 1863, 2137, 2157, 2158, Bob Dole, Everest, Jagger, Karl-92, Overley, Zenda |
| TAMU (13) | Lockett, TAM101, TAM105, TAM107, TAM110, TAM111, TAM112, TAM113, TAM114, TAM115, TAM200, TAM203, TAM204, TAM401, TAMW101 |
| CSU (3) | LCSMint, Prairie Red, AP503CL2 |
| Heritage (14) | BigMax, Chisolm, Custer, ElevatorRun, JEI110, OK101, OK102, Scout, TAM101, TAM105, TAM107, TAMW101, Triumph64, HG9 |
| Syngenta (19) | CJ, Coronado, Cuttre, Dumas, Doans, Fannin, Fuller, Greer, Jackpot, Jagalene, Longhorn, Ogallala, Post Rock, SYFLint, SYLlano, SYMonument, SYRazor, SYRugged |
| Bayer (13) | Armour, SantaFe, Shocker, WB4269, WB4303, WB4401, WB4458, 2B4515, WBCedar, WB4699, WBGrainfield, WBRedhawk, Winterhawk |
| Limagrain Central Seeds (5) | LCSATomicAX, LCSFusion, LCSHelixAX, LCSWizard, LCSPhoton |
| Trio (1) | T158 |
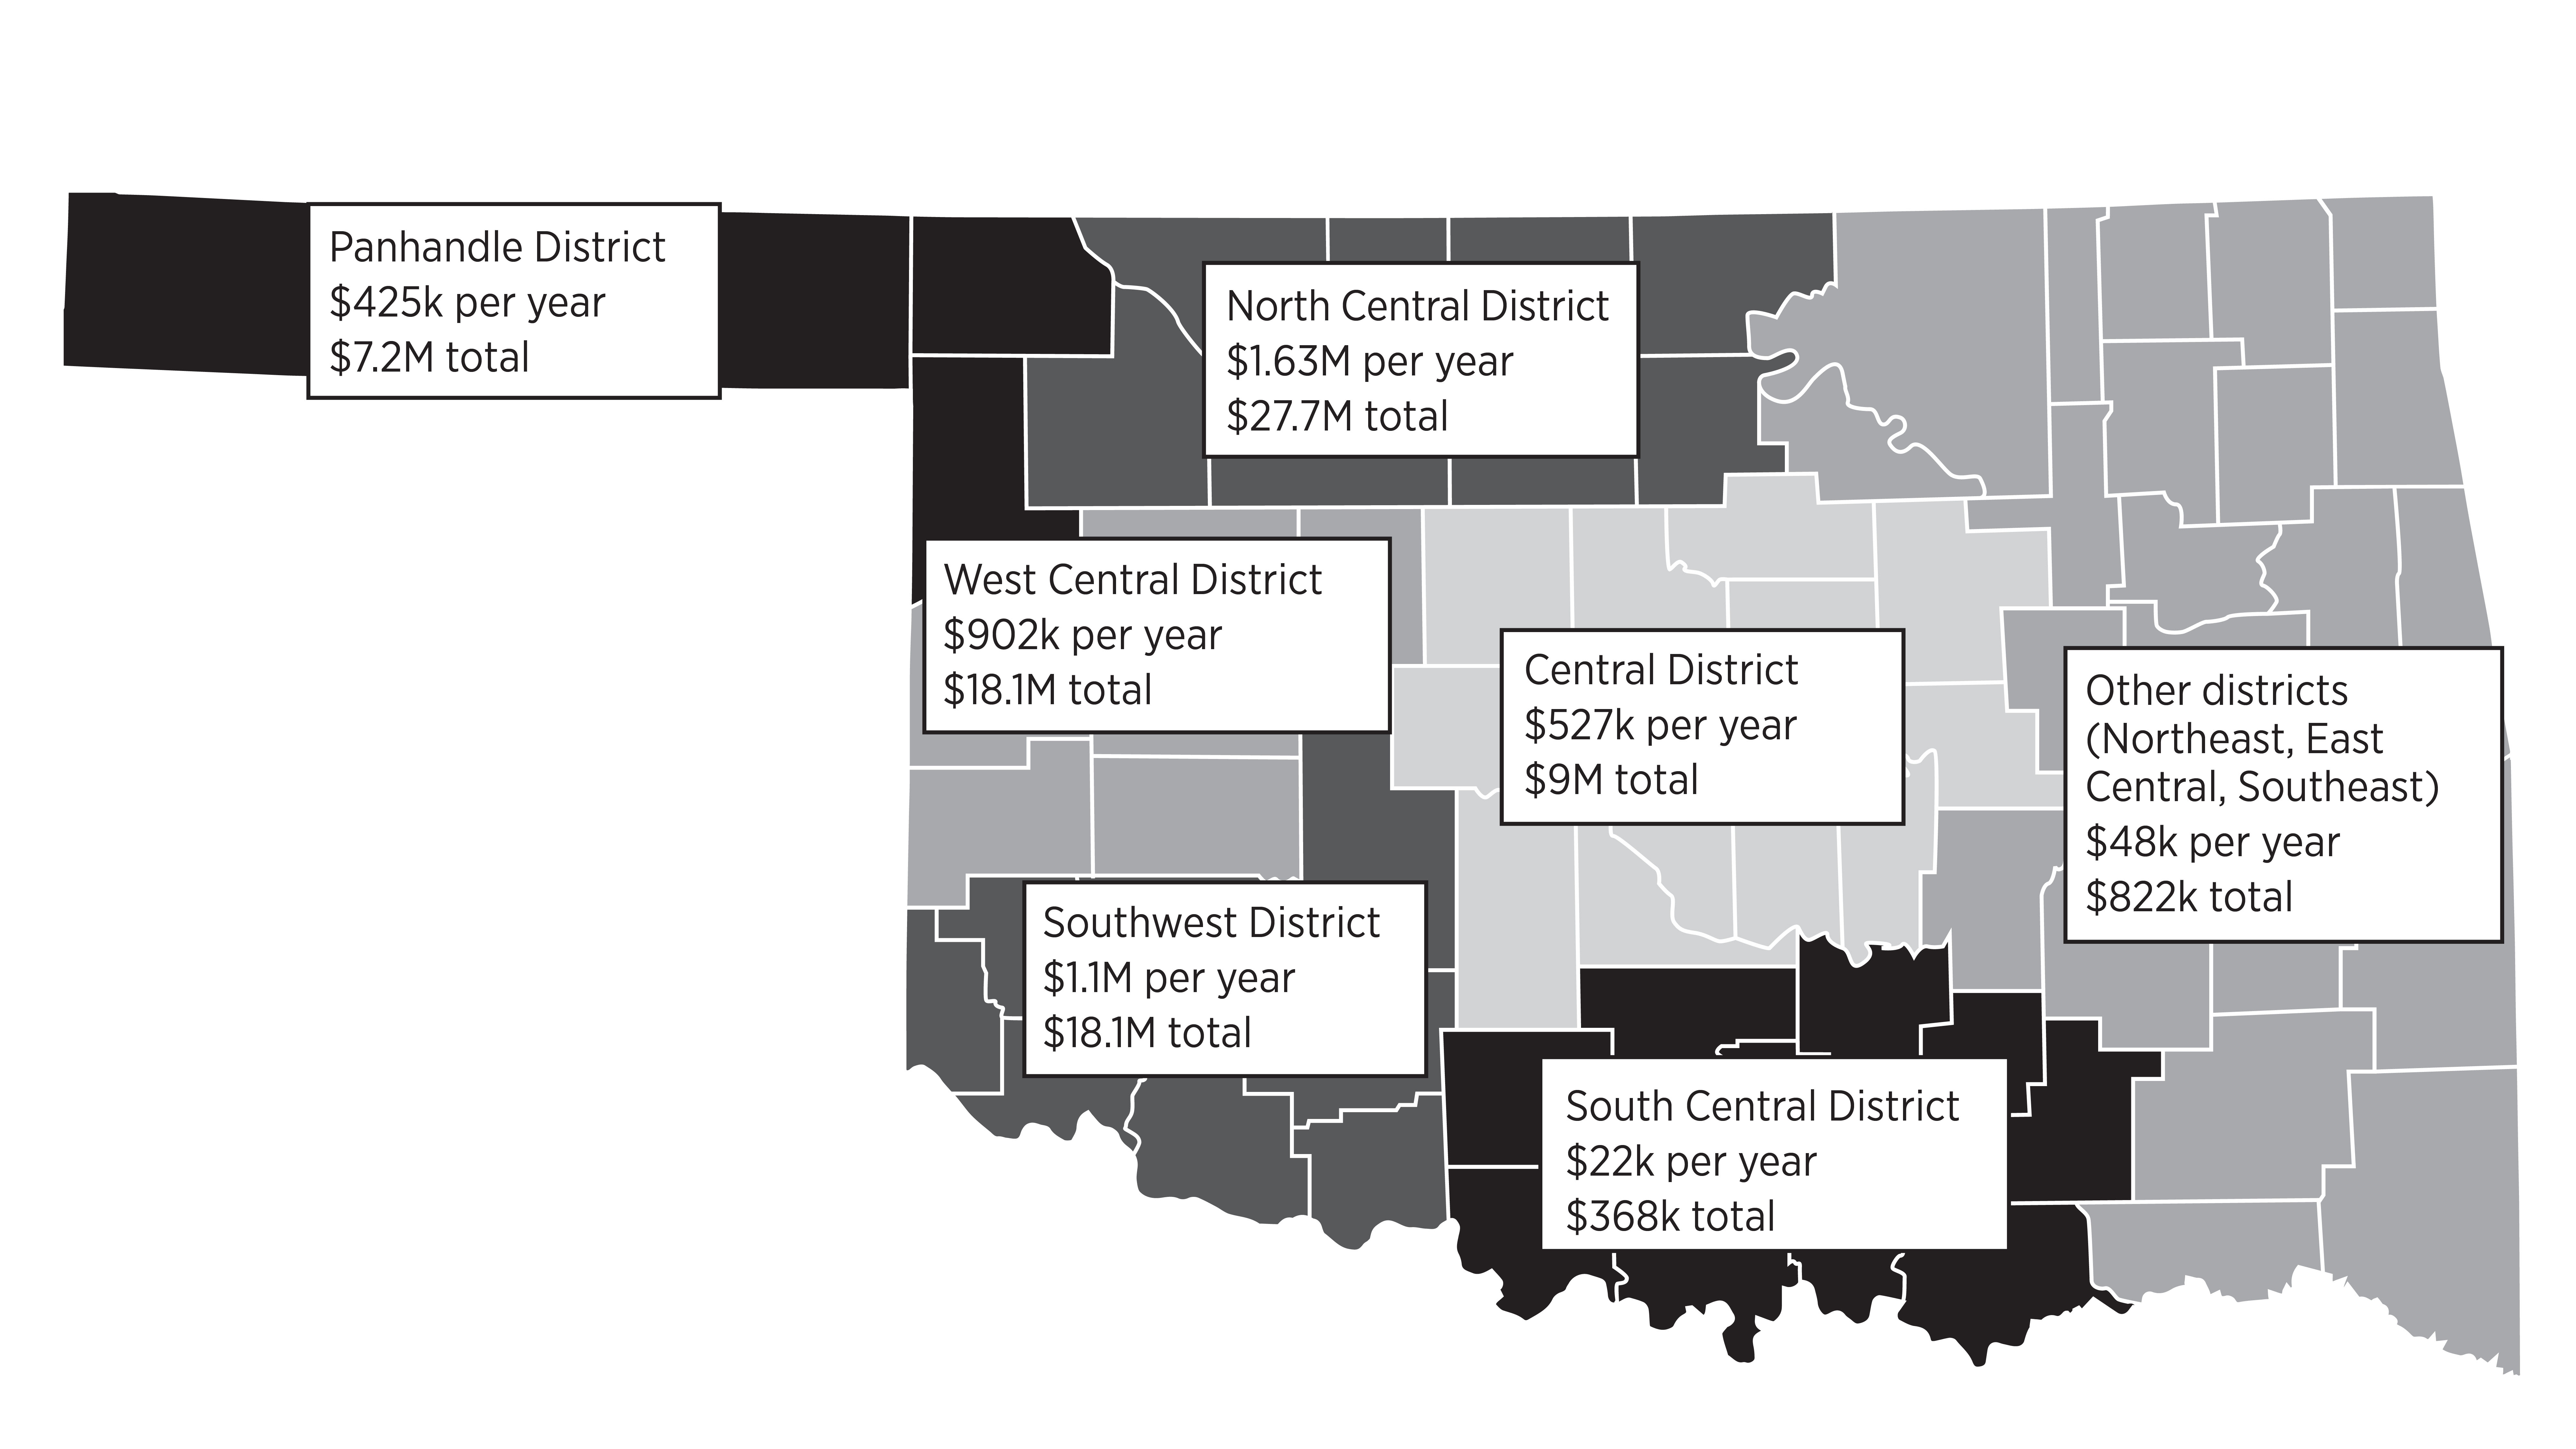 Figure 1. Value of wheat yield increases due OSU wheat variety adoption by district.
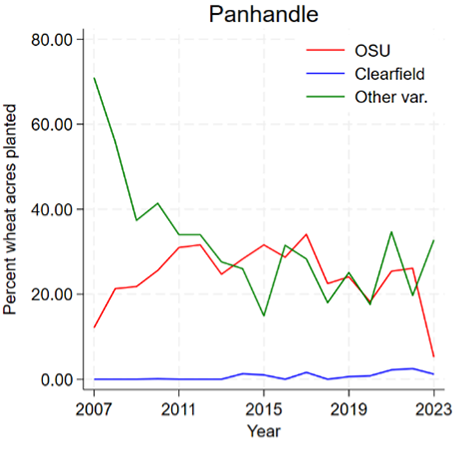 Figure 2a. Variety adoption of wheat in the Panhandle.
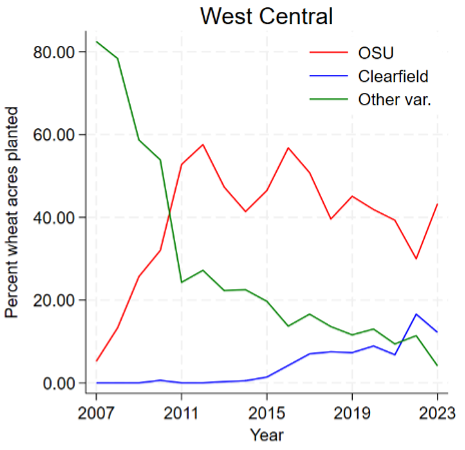 Figure 2b. Variety adoption of wheat in west central Oklahoma.
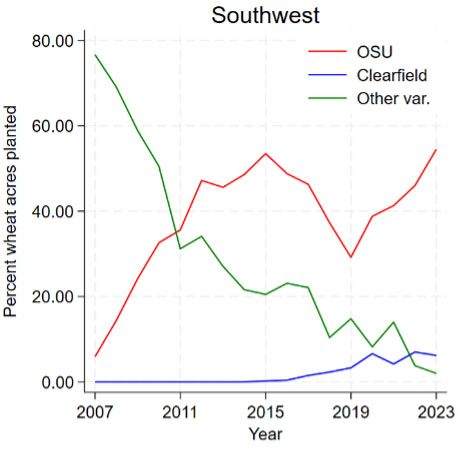 Figure 2c. Variety adoption of wheat in southwest Oklahoma.
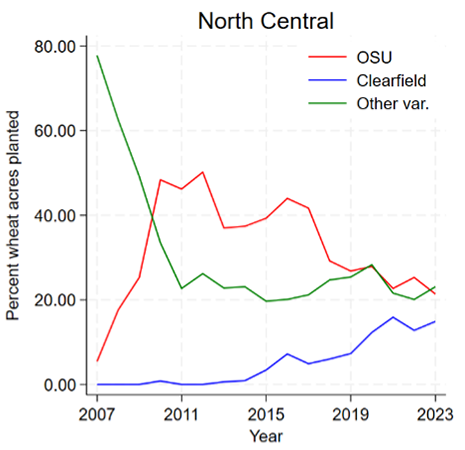 Figure 2d. Variety adoption of wheat in north central Oklahoma.
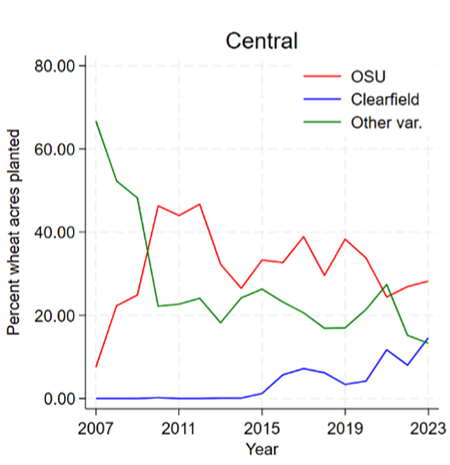 Figure 2e. Variety adoption of wheat in central Oklahoma.
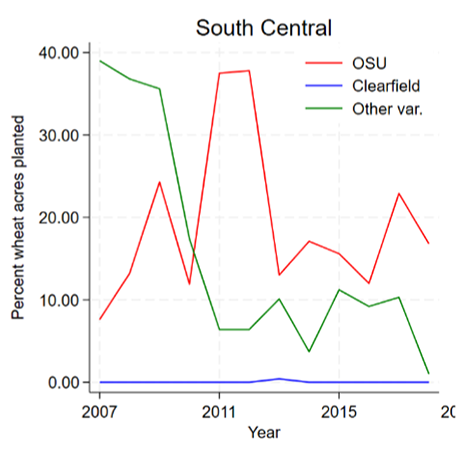 Figure 2f. Variety adoption of wheat in south central Oklahoma.
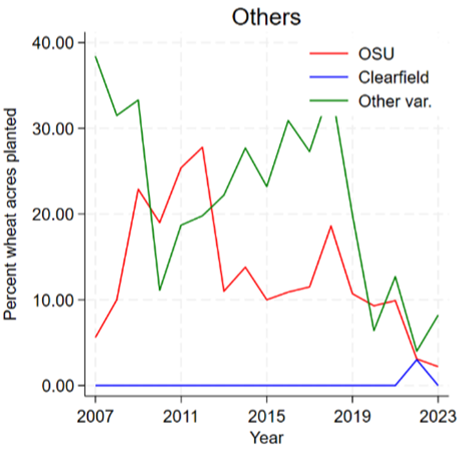 Figure 2g. Variety adoption of wheat in other districts (Northeast, East Central and Southeast) of Oklahoma.
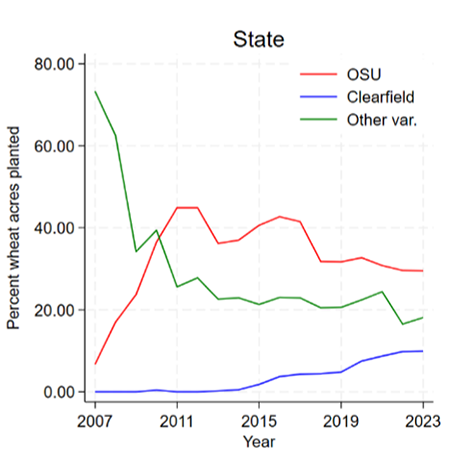 Figure 2h. Variety adoption of wheat in Oklahoma.
| Region | Average annual returns ($1,000s) | Standard deviation of average returns ($1,000s) | Total returns ($1,000s) | Total returns standard deviation ($1,000s) |
|---|---|---|---|---|
| Panhandle | $425 | $50 | $7,225 | $481 |
| West Central | $902 | $99 | $15,337 | $1,049 |
| Southwest | $1,067 | $118 | $18,138 | $1,203 |
| North Central | $1,632 | $178 | $27,738 | $1,958 |
| Central | $527 | $47 | $8,966 | $604 |
| South Central | $22 | $5 | $368 | $31 |
| Others | $48 | $7 | $822 | $56 |
| State | $4,619 | $438 | $78,595 | $5,382 |
References
D. Lambert, DeVuyst, E.A., and B. Carver. 2026. “The Economic Impact of a Public Wheat Breeding Program,” Journal of Agricultural and Resource Economics, in review 1–17, doi:10.1017/aae.2026.10054.