

2026 Annual Research Summary for the Department of Animal and Food Sciences
Forward
TO: Livestock Producers, Researchers, Educators and other Stakeholders of the OSU Department of Animal and Food Sciences
RE: 2026 Annual Research Summary of the Department of Animal and Food Sciences
We are pleased to share research summaries and updates from faculty and graduate students in the Oklahoma State University Department of Animal and Food Sciences, as well as Area Extension specialists and county Extension educators. Whether fundamental or applied, the mission of our research program is to solve problems and capitalize on opportunities in animal agriculture, companion animals, and the food industry.
This report highlights a broad range of research conducted at OSU livestock units and laboratories and, in some cases, on cooperating farms and ranches across Oklahoma. These efforts reflect the department’s commitment to scientific discovery and to developing practical solutions that benefit producers, industry partners and consumers.
Our faculty continue to secure competitive funding to support an ambitious research program. Equally important is the education and professional development our students receive through their participation in these projects. Over the past two years, 21 masters and 28 doctoral students completed work toward their graduate degrees. These graduates are well prepared to become leaders in animal agriculture, food science, academia, government and related industries.
We are grateful for the generous support of our industry partners, cooperating producers, funding agencies and other collaborators. Their investments of funding, facilities, animals, products, expertise and time make much of this work possible.
We hope you find this research report useful and informative.
David Lalman
Extension Specialist for Beef Cattle
Paul Beck
Extension Specialist for Beef Nutrition
Impact of Frozen Versus Thawed Fabrication and Refreezing on Beef Strip Loins
Jade E. Edwards, Keayla M. Harr, Morgan Denzer, Morgan Pfeiffer, Gretchen G. Mafi, and Ranjith Ramanathan
Department of Animal and Food Sciences, Oklahoma State University, Stillwater, OK 74078, USA
Justification and Actions
Freezing is widely used in the meat industry to extend shelf-life, minimize microbial spoilage, and provide flexibility in storage and distribution. However, consumer perception often associates freezing with reduced quality, despite mixed scientific evidence. Recent disruptions in the beef supply chain, including those caused by the COVID-19 pandemic, have increased reliance on freezing and thawing cycles prior to fabrication and distribution. This practice has raised concerns regarding palatability, yield and economic implications.
The current study evaluated how fabricating beef strip loins in a frozen versus thawed state, followed by subsequent long-term storage at different frozen temperatures, affected palatability traits, thaw loss, cook loss and product value. Understanding these effects is critical for both foodservice and export markets, where multiple freeze–thaw cycles are common.
Twenty USDA Choice paired strip loins were collected at 2 days postmortem. Subprimals were wet-aged for 21 days at 39°F and then frozen at −6°F for 14 days to simulate an initial freezing cycle. Loins were then assigned to either remain frozen or be thawed before fabrication. Thawed loins were held at 39°F for 7 days, while frozen loins were maintained at −6°F. Each loin was fabricated into 2.54 cm steaks, which were subsequently assigned to frozen storage at 10°F, 0°F, or −6°F for 180 days. Steaks were designated for Warner-Bratzler shear force (WBSF), trained sensory analysis, consumer sensory panels, or lipid oxidation measurements. Thaw and cook loss were calculated gravimetrically, while instrumental tenderness was assessed by WBSF. Sensory evaluations followed American Meat Science Association (AMSA) guidelines. A total of 160 untrained consumers provided hedonic ratings, and eight trained panelists conducted descriptive analysis.
Findings
Loins thawed before fabrication exhibited significantly higher thaw loss than loins fabricated while frozen. A 5% difference in moisture loss was recorded, equating to an additional 292 g of lost water per loin. Steaks from thawed loins lost more value due to purge, with economic losses of $2.02 per loin compared to $1.64 for those undergoing a single freeze–thaw cycle. Overall, loins fabricated frozen retained $5.71 more in value than thawed counterparts. Importantly, frozen storage temperature (10°F, 0°F, or −6°F) did not significantly affect thaw or cook loss. Steaks subjected to two freeze–thaw cycles exhibited lower WBSF values, indicating improved instrumental tenderness compared to those exposed to a single freeze–thaw cycle. However, both groups fell below the threshold for “Certified Very Tender” designation, meaning consumers would likely not perceive differences.
Neither trained nor consumer panelists detected significant differences in tenderness, juiciness, beef flavor or off-flavor between fabrication states, freeze–thaw cycles or frozen storage temperatures. Consumers identified flavor as the most important palatability trait, followed by tenderness and juiciness. Internal cooked color, assessed both instrumentally and by trained panels, was unaffected by fabrication state or storage temperature. Neither repeated freeze–thaw cycles nor variation in storage temperature contributed to lipid oxidation under the conditions tested.
Implications
This study demonstrates that fabrication of beef strip loins in a frozen state does not negatively affect palatability, tenderness or oxidative stability compared to thawed fabrication. Instead, fabricating in a frozen state improves yield by reducing thaw loss, translating to economic advantages. For foodservice companies and beef exporters, minimizing thawing before fabrication is a practical strategy to preserve value without compromising eating quality. The findings also dispel common consumer misconceptions that freezing inherently reduces beef quality. From an industry perspective, fabricating beef in a frozen state provided a $5.71 per-loin economic benefit due to reduced purge and moisture loss. Scaled across large volumes of product, this represents a substantial financial advantage.
Published in Meat and Muscle Biology, doi:10.22175/mmb.18932
Impact of Sodium Nitrite and Tocopherol-Infused Poly (Lactic Acid) Biodegradable Films on Dark-Cutting Beef Color
Trinity Smith1, Anibal Bher2, Rafael Auras2, Timothy Bowser3, Morgan Denzer1, Mansour Alnajrani4, Wesley Osburn4, Gretchen Mafi1, Morgan Pfeiffer1, and Ranjith Ramanathan1
1Department of Animal and Food Sciences, Oklahoma State University, Stillwater, OK 74078, USA
2School of Packaging, Michigan State University, East Lansing, MI 488243, USA
3Department of Biosystems Engineering, Oklahoma State University, Stillwater, OK 74078, USA
4Department of Animal Science, Texas A&M University, College Station, TX 77843, USA
Justification and Actions
Meat color is one of the most important quality attributes influencing consumer purchasing decisions. Consumers prefer a bright cherry-red appearance in beef, and deviations such as dark-cutting beef significantly reduce marketability. Dark-cutting beef occurs when pre-slaughter stress depletes muscle glycogen, resulting in higher ultimate pH and darker meat. Traditional interventions include modified atmosphere packaging and antioxidant treatments. More recently, nitrite-embedded packaging has been explored to enhance redness by forming nitric oxide myoglobin. However, its drawback is persistent red color after cooking, which can mislead consumers. Simultaneously, environmental concerns have increased interest in biodegradable films to replace single-use plastics. Poly (lactic acid) (PLA) is a promising material that can incorporate active compounds such as sodium nitrite and α-tocopherol. This study investigated whether nitrite embedded PLA films could improve dark-cutting beef color while minimizing cooked color defects.
Two PLA film formulations were produced using a twin-screw extruder: a low concentration (LC-PLA) containing 0.12% sodium nitrite and 0.5% α-tocopherol, and a high concentration (HC-PLA) with 0.6% sodium nitrite and 2.5% α-tocopherol. These films were hot-pressed into sheets and applied directly to the surface of steaks before vacuum packaging. The steaks, comprising seven normal-pH and seven dark-cutting loins, were assigned to one of five treatments: normal-pH in PVC overwrap, dark-cutting in PVC overwrap, dark-cutting in vacuum, dark-cutting in vacuum with LC-PLA film and dark cutting in vacuum with HCPLA film. The packages were stored for six days under simulated retail display conditions at 2°C with LED lighting. Throughout this period, color measurements were taken daily using spectrophotometry and a trained panel. Additionally, cooked color was assessed after day five, while microbial counts and lipid oxidation were evaluated on day six. Residual nitrite and nitrate transfer were also quantified.
Findings
Both LC-PLA and HC-PLA films had similar oxygen permeability, transparency and thermal stability, with HC-PLA appearing more yellow due to tocopherol content. When used to package raw meat, both increased redness within 24 hours, with HC-PLA maintaining higher redness. HC-PLA transferred more nitrite and nitrate, indicating dose-dependent migration. Upon cooking, HC-PLA steaks showed higher redness similar to cured meat, while LC-PLA steaks resembled vacuum-packaged controls. No differences in microbial growth or lipid oxidation were observed; packaging environment was the primary factor. Visual assessments confirmed that HC-PLA enhanced raw redness but resulted in a pinker cooked color, whereas LC-PLA improved raw color without undesirable cooked effects.
This study shows that biodegradable PLA films with sodium nitrite and α-tocopherol can improve dark-cutting beef's color. High-concentration films enhance redness but may cause pinking in cooked meat, while low-concentration films improve raw color without affecting cooked appearance. Neither film type impacted microbial growth or lipid oxidation. Using low nitrite levels in PLA films offers a sustainable way to improve raw beef color and reduce cooked defects, supporting consumer acceptance and environmental benefits.
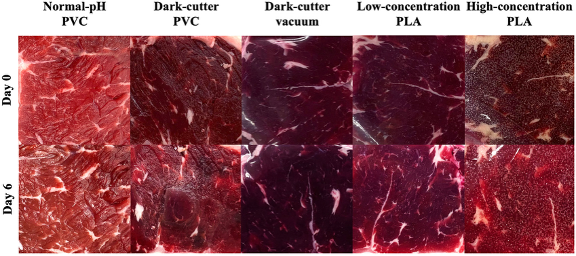 Figure 1. Effects of polylactic acid nitrite film and tocopherol on dark-cutting beef color.
Published in Meat and Muscle Biology 8(1): 17006, 1–15 (2024), doi:10.22175/mmb.17006.
Using Cube Feeder Calibration Clinics to Evaluate Feeding Accuracy
Marty New, Dana Zook, Sam Talley, David Lalman, Paul Beck
Oklahoma State University Cooperative Extension Service
Justification and Actions
In Oklahoma cattle operations, supplementing protein is a common practice, especially when cattle are grazing low-quality standing forage or consuming hay that is deficient in protein. This typically occurs during late fall, winter and early spring. To meet these needs, producers often deliver protein supplements using pickup-mounted bulk feeders, commonly called “cube or cake feeders.” These feeders vary widely in how they dispense feed. Depending on the brand, delivery mechanisms may include augers, trip gates or chain-driven systems. Because of this variation, feeders differ in the rate of feed delivery as well as the method of adjusting the delivery rate. In most cases, conditions (feed type, etc.) used to establish delivery rate settings at the factory are unknown. Although many producers assume their feeders are calibrated to deliver a consistent and accurate amount, actual delivery can be influenced by feeder design, feed type, delivery mechanism and wear or damage.
Given this variability, 50 feeder calibration clinics were hosted from 2021-2024 by OSU Extension educators in 19 counties across western Oklahoma and south-central Kansas to help producers improve supplement feeding accuracy. Each of these clinics was organized and hosted by County OSU Extension educators in partnership with local feed companies or co-ops. During the clinics, educators collected data from producers about their cube feeder which included feeder brand, feed type, method to control the amount of feed dispensed and expected feed delivery rate. To determine the difference between observed and expected feed delivery, each feeder was operated for a predetermined number of drops, clicks or period of time. Feed was collected in a bucket and subsequently weighed on a True Test© Scale. This process was repeated between two and five times for each cube feeder. The average observed feed delivery rate was divided by the expected feed delivery rate to calculate the percent of expected delivered for each producer.
Findings
Within 50 clinics, 7 common feeder brands were evaluated. An “other” category was used to account for brands that were not represented as commonly or were of unknown brand. In most cases, expected feed delivery rate was based on the settings from the factory. However, out of 341 producers who attended clinics, 52% could provide an expected feed delivery rate. Feed delivery rate or amount was tested and provided to all producers, whether they were able to provide an expected delivery rate or amount. Given this, the following statistical analysis in Table 1 includes only data collected from cube feeders for which an expected delivery rate or amount was available.
Feeders equipped with digital counters had less variability in feed delivery compared to other delivery mechanisms, although no significant difference was detected across brands.
Averaged across all brands, feeders dispensed about 13% more feed than expected. The 3C brand was the most popular with 68 observations. Notable results were that the 68 producers using 3C feeders were the most accurate (104%) feeding only 4% more than they expected, and their expectation of feed delivery was highly correlated (0.86) to what was delivered. While producers using the Bar-6 feeders appeared to be accurately feeding (102%), a neutral correlation (-0.01) indicates inconsistent results between expected and actual feed delivery values. Nine producers using Hydrabed feeders fed 33% more than expected and a strong correlation (0.71) indicated strong predictability for overfeeding.
A real-world example of this would be a producer feeding 50 cows 5 pounds of cubes per day that cost $350/ton. By feeding an extra 13% per day, this producer would instead be feeding 0.65 additional pounds per cow or 32.5 additional pounds to the group per day. This extra cost would inflate their feed bill by $5.68 daily or $681.60 over a 4-month feeding season.
| Feeder Type | # Producers | % Expected Delivery Correlation | Correlation (Expected vs. Actual) |
|---|---|---|---|
| All Data | 162 | 113 | 0.50 |
| 3C | 68 | 104 | 0.86 |
| Trip Hopper | 39 | 120 | 0.39 |
| Bar-6 | 22 | 102 | -0.01 |
| Crownline | 13 | 136 | 0.20 |
| Hydrabed | 9 | 133 | 0.71 |
| Deweese | 2 | 122 | n/a |
| Bar-S | 1 | 98 | n/a |
| Other | 8 | 120 | 0.18 |
Beef × Dairy vs. Native Beef: Production System and Preweaning Nutrition Effects on Carcass Traits
Timothy P. Vining, Justin D. Crosswhite1, Olivia N. Genther-Schroeder2, Michael D. Major1, and Paul A. Beck1
1Department of Animal and Food Sciences, Oklahoma State University, Stillwater, OK
2Purina Animal Nutrition, LLC
Justification and Actions
It has become common practice for dairy producers to use beef sire genetics to produce beef x dairy hybrid calves via artificial insemination. Because BOD calves are immediately removed from the dam and fed milk replacer and calf starter, there is a need to evaluate early life nutrition. This study compared carcass traits across rearing systems by evaluating growth and carcass traits of BOD steers and heifers with conventional Angus crossbred (Native Beef; NB) steers and heifers.
Findings
A total of 52 Beef-on-Dairy (BOD; Angus × Holstein) calves were sourced from the Purina Animal Nutrition Research Facility in Gray Summit, Missouri. Calves were reared at Purina and weaned at 56 days of age and fed starter diets before being transported to Oklahoma State University Range Cow Research Center South Range Unit on November 9, 2023, at 94-days of age. Prior to weaning, BOD calves were randomly assigned to one of two preweaning nutrition programs. The Lower Preweaning Nutrition (LPN) treatment consisted of 12 steers, and 14 heifers fed a milk replacer containing 22% crude protein (CP) and 20% fat mixed at 15% milk solids with ad libitum starter feed containing 21% CP. The Greater Preweaning Nutrition (GPN) consisted of 13 steers, and 14 heifers fed a milk replacer containing 26% CP and 20% fat mixed at 12% milk solids with ad libitum starter feed containing 26% CP. Twelve Native Beef (NB; 6 steers and 6 heifers) calves reared at OSU were included in this study following weaning. These NB calves were weaned at 7 months of age and preconditioned for 60 days. All calves grazed wheat pasture beginning in December for 153-days and bermudagrass for 56-days before finishing at USDA-ARS Fort Reno (El Reno, OK) beginning on July 9, 2024. Calves were harvested at a targeted 0.5 inch of 10th rib back fat endpoint. Beef x dairy calves were fed for 191 days, and NB calves for 100 days. As expected at any given date before finishing the NB were heavier and ultrasound indicated that ribeye areas and back fat measurements were greater for NB than BOD calves (P < 0.0001). The NB heifers also had greater IMF% than both LPN and GPN heifers (P < 0.0001) before harvest. At harvest, treatment groups did not differ for any trait except dressing percentage. Dressing percentage was greater for NB calves (63%) compared to both BOD groups (62%; P < 0.001). Steers were heavier at harvest than heifers (P = 0.008), but NB and BOD did not differ in BW at harvest or other carcass characteristics. This research shows that BOD produce similar carcasses to NB when harvested at the same degree of finish.
| Treatment Trait | Treatment LPN Scan Date | Treatment LPN Steers | Treatment LPN Heifers | Treatment GPN Steers | Treatment GPN Heifers | Treatment NB Steers |
|---|---|---|---|---|---|---|
| Body Weight, lbs | Day 0 | 710a | 670a | 714a | 664a | 1074b |
| Body Weight, lbs | Day 64 | 1040b | 986a | 1053b | 1016a | 1394d |
| Body Weight, lbs | Day 114 | 1272b | 1188a | 1270b | 1230a | ---- |
| Rib Eye area, in2 | Day 0 | 6.3a | 5.9a | 6.1a | 6.6a | 9.2b |
| Rib Eye area, in2 | Day 64 | 10.0a | 10.0a | 10.4a | 10.5a | 14.0b |
| Rib Eye area, in2 | Day 114 | 12.2a | 12.4a | 1270b | 13.7b | 12.7b |
| Back fat, in | Day 0 | 0.19a | 0.20a | 0.22a | 0.24a | 0.44b |
| Back fat, in | Day 64 | 0.35a | 0.38a | 0.34a | 0.40a | 0.83b |
| Back fat, in | Day 114 | 0.53a | 0.52a | 0.57a | 0.56a | ---- |
| Intramuscular fat, % | Day 0 | 3.3a | 3.0a | 3.2a | 3.6a | 4.1b |
| Intramuscular fat, % | Day 64 | 4.3a | 4.0a | 3.6a | 4.3a | 4.7a |
| Intramuscular fat, % | Day 114 | 7.3a | 6.6a | 6.5a | 8.1b | ---- |
| Treatment Trait | Treatment NB Heifers | Treatment P-values SEM | Treatment P-values Trt | Treatment P-values Sex | Treatment P-values Trt:Sex |
|---|---|---|---|---|---|
| Body Weight, lbs | 1029b | 32.4 | <0.001 | 0.098 | 0.978 |
| Body Weight, lbs | 1305c | 23.6 | <0.001 | 0.007 | 0.656 |
| Body Weight, lbs | ---- | 27.1 | 0.478 | 0.023 | 0.436 |
| Rib Eye area, in2 | 9.1b | 0.34 | <0.001 | 0.957 | 0.36 |
| Rib Eye area, in2 | 13.2b | 0.53 | <0.001 | 0.74 | 0.832 |
| Rib Eye area, in2 | ---- | ---- | 0.44 | 0.375 | 0.163 |
| Back fat, in | 0.48b | 0.02 | <0.001 | 0.124 | 0.117 |
| Back fat, in | 0.77b | 0.03 | <0.001 | 0.202 | 0.242 |
| Back fat, in | ---- | 0.03 | 0.552 | 0.113 | 0.891 |
| Intramuscular fat, % | 5.5b | 0.21 | <0.001 | 0.308 | 0.003 |
| Intramuscular fat, % | 6.6b | 0.38 | <0.001 | 0.073 | 0.04 |
| Intramuscular fat, % | ---- | 0.45 | 0.286 | 0.364 | 0.05 |
| Treatment Trait | Treatment LPN | Treatment GPN | Treatment NB | Treatment SEM | Treatment P-values |
|---|---|---|---|---|---|
| Body weight, lbs | 1495 | 1513 | 1435 | 17.0 | 0.302 |
| Hot carcass weight, lbs | 926 | 937 | 900 | 10.6 | 0.479 |
| Yield Grade | 3.3 | 3.3 | 3.2 | 0.74 | 0.793 |
| Marbling | 597 | 607 | 632 | 15.6 | 0.747 |
| Rib Ey area, in2 | 14.2 | 14.1 | 14.7 | 0.18 | 0.456 |
| Back far, In | 0.58 | 0.56 | 0.60 | 0.04 | 0.456 |
| Dressing percentage | 62a | 62a | 63b | 0.03 | <0.001 |
Table 1 and 2 notes:
Superscripts a,b,c and d indicate means are significantly different at P ≤ 0.05
LPN = Lower Preweaning Nutrition (BOD)
GPN = Greater Preweaning Nutrition (BOD)
NB = Native Beef
Characterization of Daily Attendance and Blood Urea Nitrogen Dynamics in Mature Beef Cows Grazing Native Range
Caitlyn Kleffner, Mariana Garcia-Ascolani, Steven Meyers, Candace Adams, Mason Henson, Andrew Foote, Ryan Reuter, David Lalman
Justification and Actions
Liquid protein supplementation is often used in cow/calf systems to support cow performance when forage quality is limited. However, little is known about individual variation in supplement intake among cows. Recent advancements in electronic identification technology offer an opportunity to measure individual feeding behavior under grazing conditions.
Blood urea nitrogen concentration has been shown to reflect differences in dietary protein availability in cattle grazing lowquality forages. Therefore, we hypothesized that more frequent visits to the liquid feeder or greater average daily time spent at the liquid feeder would result in increased circulating BUN concentrations. Therefore, the objective of this experiment was to characterize the daily liquid feeder attendance patterns of mature beef cows grazing tallgrass prairie rangeland and to assess the relationship between feeder attendance metrics and BUN concentration.
Nineteen mature Angus and Angus-cross cows were managed on a 31.4-hectare native range pasture at the Oklahoma State University Range Cow Research Center, North Range Unit. The cows underwent a 28-day adaptation period to a liquid supplement provided through a four-wheel lick tank equipped with a HerdView Tag Reader (HerdX Inc., Dallas, TX). Each cow was fitted with an ultra-high-frequency RFID ear tag, and the start and end times of feeder visits were recorded continuously over a 25-day period. Feeder visits lasting less than 10 seconds were excluded from the analysis.
For each cow, we calculated daily feeder visit duration, total time spent at the feeder each day, and the number of feeder visits per day. We summarized feeder attendance by hour of the day to evaluate temporal feeding patterns. Blood samples were collected on day 22 to determine blood urea nitrogen (BUN) concentration. Pearson correlation coefficients were used to assess relationships between feeder attendance metrics and BUN concentration. A post hoc power analysis was conducted using the herd mean and standard deviation for total daily feeder time to estimate the sample sizes needed to detect differences in feeder attendance. This information helps researchers design future studies with sufficient statistical power to identify meaningful behavioral differences while avoiding under- or over-sampling.
Findings
Cows showed highly consistent feeder attendance, averaging 25 ± 1 d of feeder use, with missed feeder days occurring primarily around calving. On average, each cow spent a total of 31.6 ± 10.5 minutes at the feeder daily, with a range of 12.5 to 48.0 minutes (Figure 1). This indicates substantial variation among cows in the average total time per day spent at the liquid feeder. While we did not measure individual animal supplement intake, this data suggests substantial variability in supplement intake. On average, cows visited the feeder during 4.6 ± 2.1 different hours each day, showing that supplement intake was spread throughout the day instead of being concentrated in one feeding period. The hourly distribution of feeder visits for the group is shown in Figure 2 and indicates that feeder use was concentrated primarily during the late afternoon and evening. Overall, cows visited the feeder multiple times per day and spent substantial time at the feeder, indicating consistent supplement use despite considerable variation in daily feeder time among individuals.
Blood urea nitrogen (BUN) concentration was positively correlated with the total number of feeder visits (r = 0.79) and the average daily time spent at the feeder (r = 0.67). This suggests that cows with greater cumulative feeder attendance consumed more liquid feed. A post hoc power analysis indicated that detecting small differences in total daily feeder time requires significant sample sizes. To detect differences of 1, 2, 3, 4, 5, or 10 minutes per day, sample sizes of 1732, 434, 194, 110, 71, and 19 cows per group would be necessary, respectively.
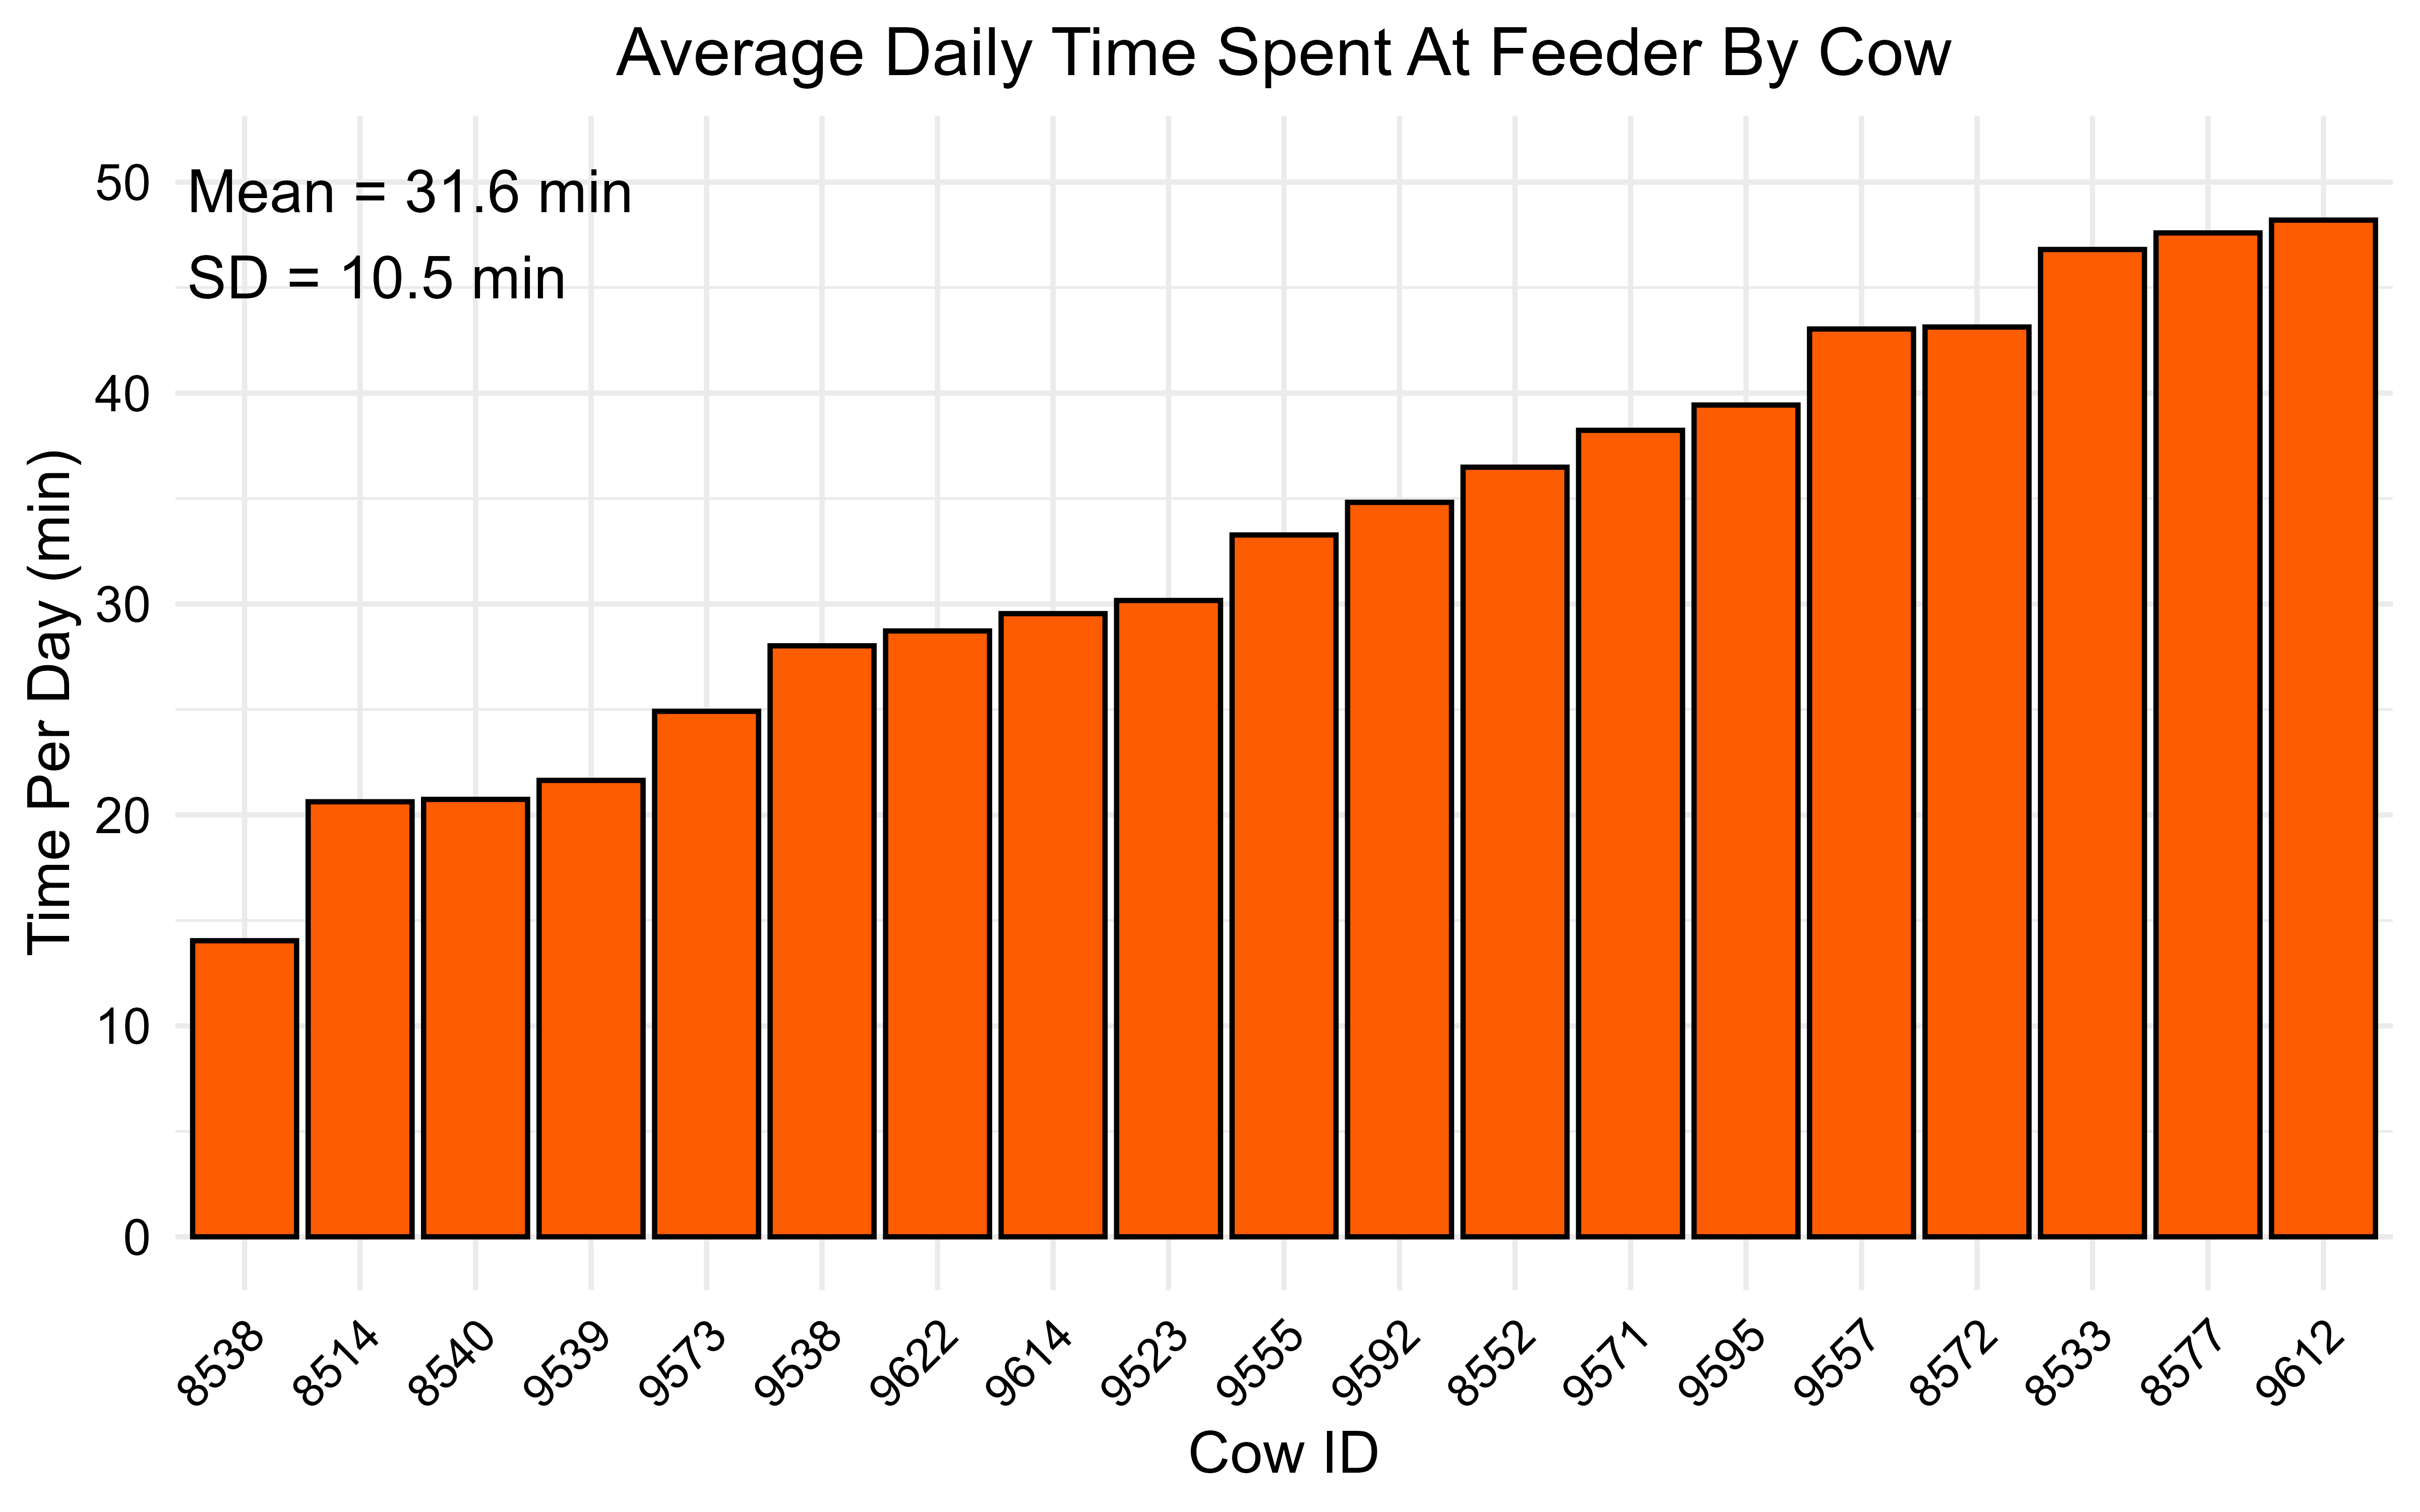 Figure 1. Average Daily Time Spent at Feeder by Cow.
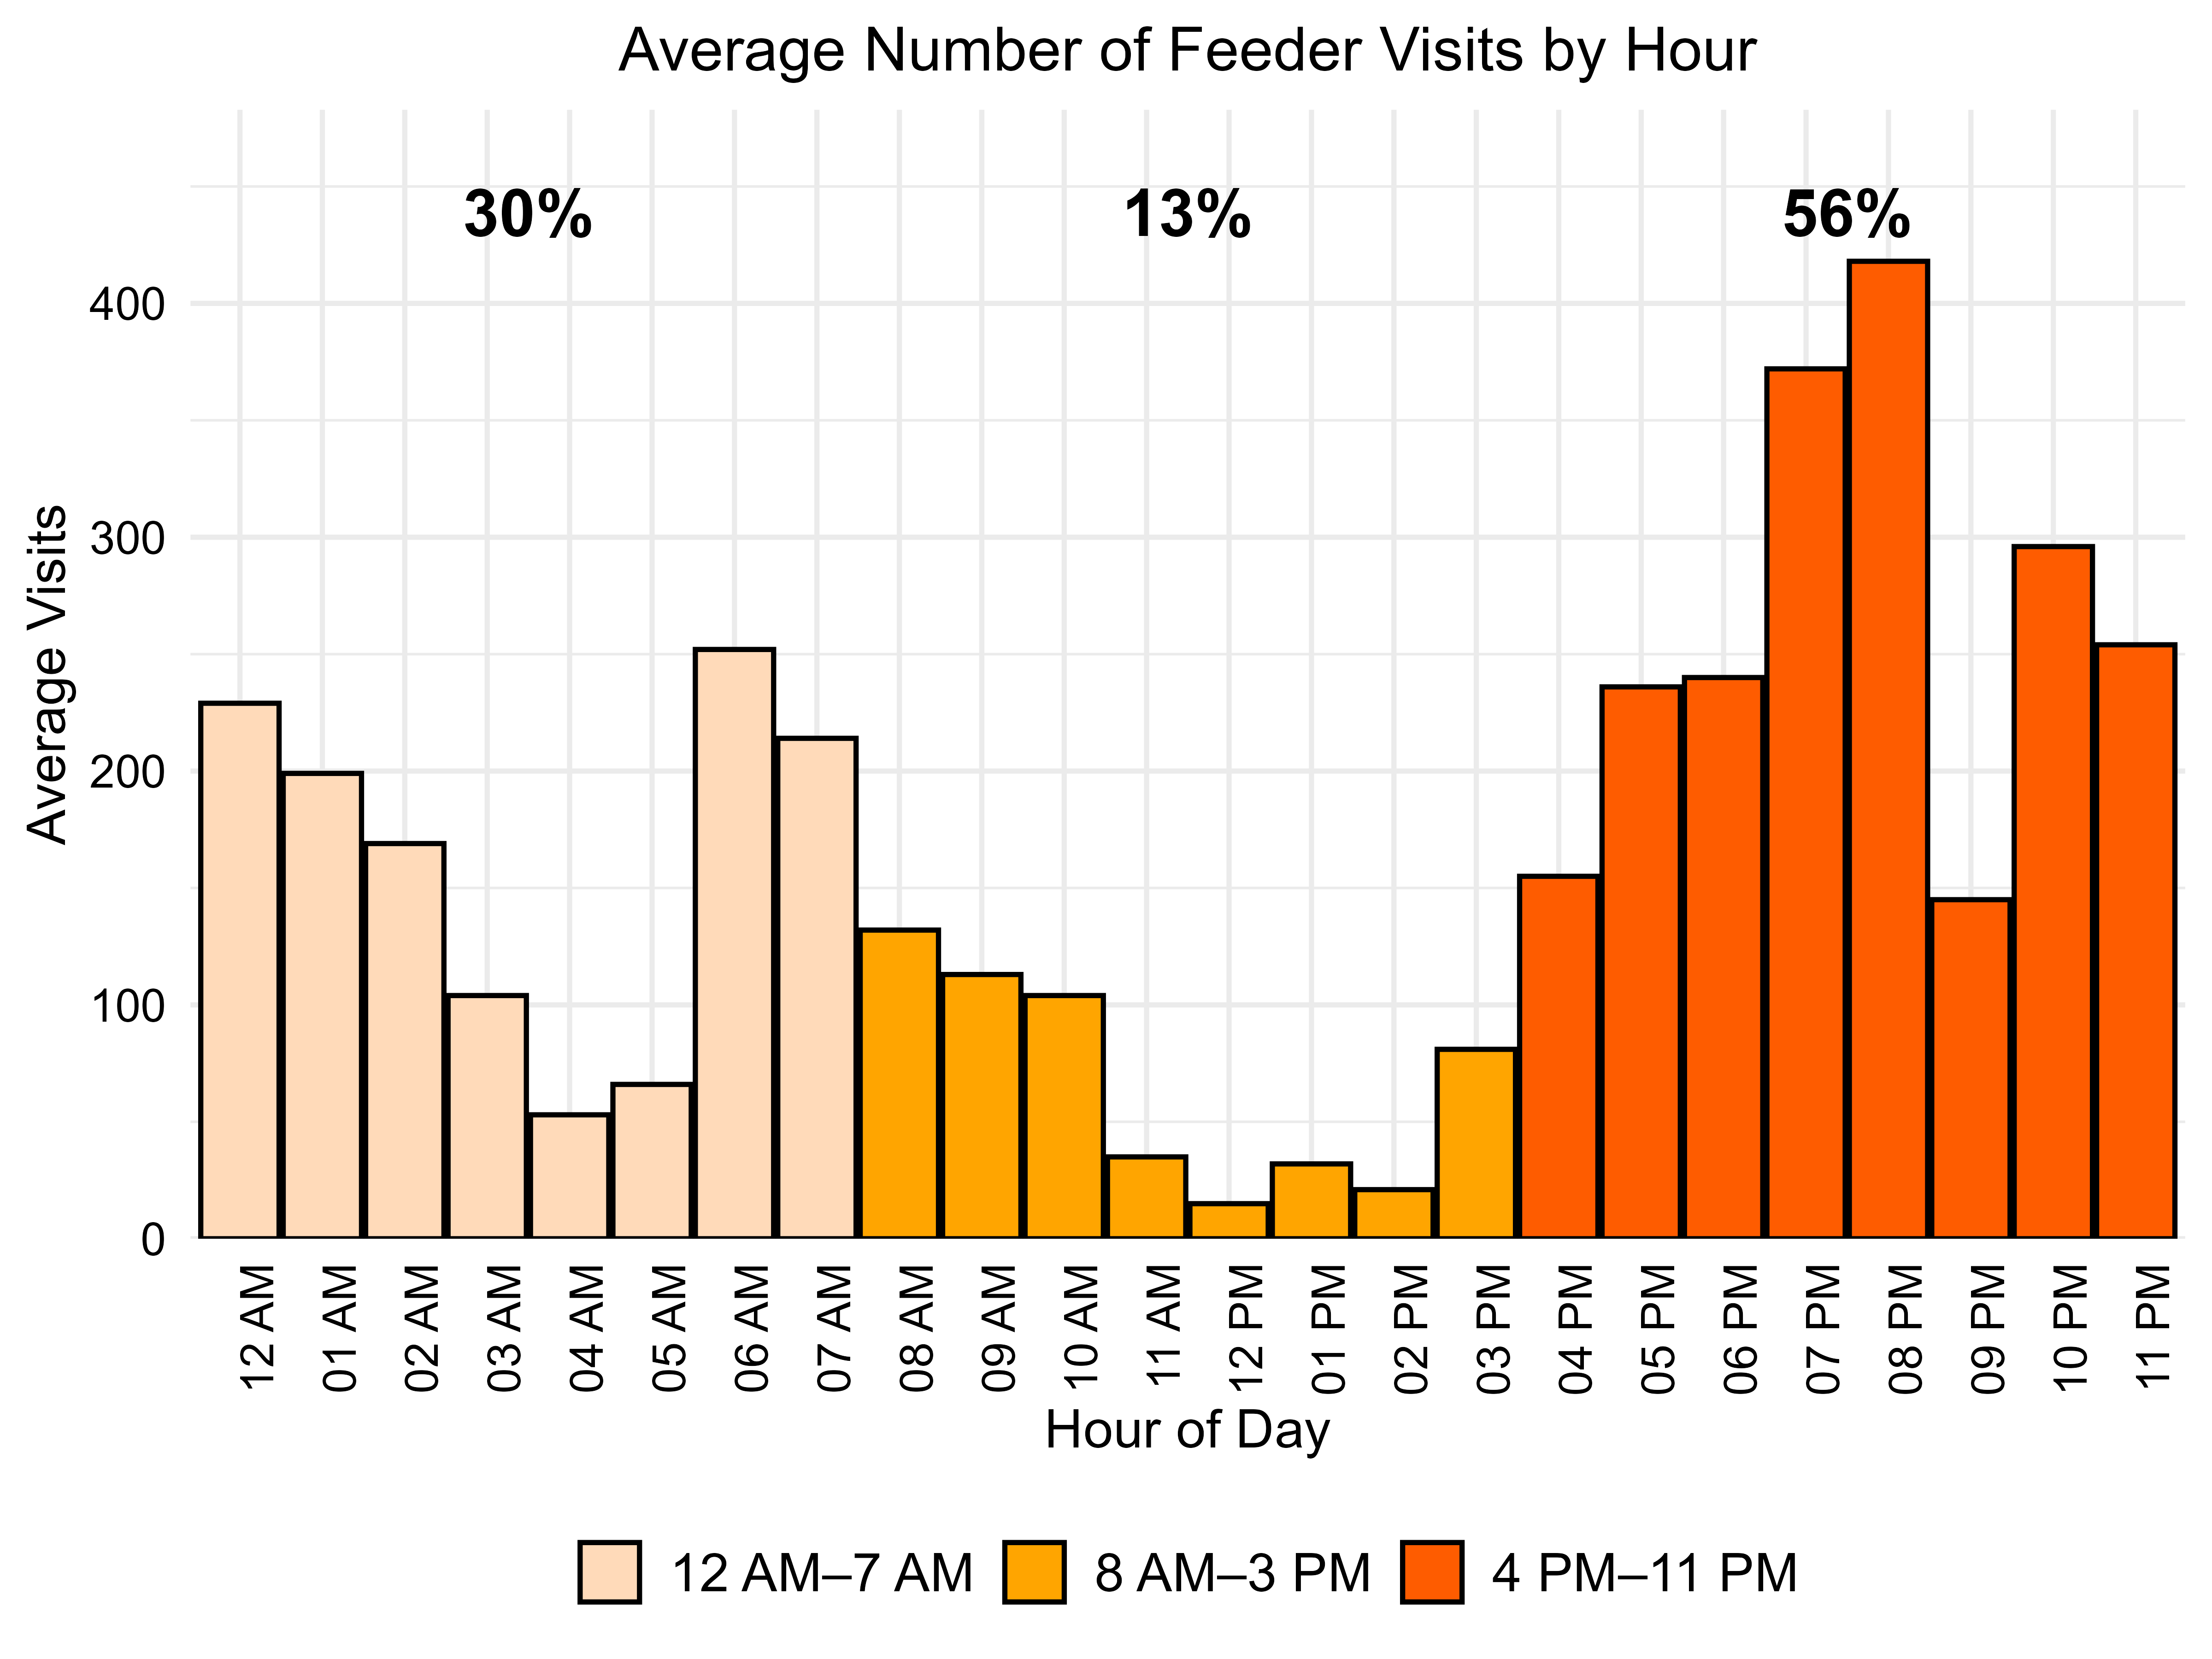 Figure 2. Average Number of Feeder Visits by Hour.
Summer Cover Crop Grazing Impacts on Steer Performance Following a Winter Wheat Crop
Cody Gruber, Ryan Reuter, Paul Beck, and Andrew Foote
Oklahoma State University Department of Animal and Food Sciences, Stillwater, OK 74078
Justification and Actions
This study compared no-tilling in a cover crop mix to allowing the pasture to transition to crabgrass and ryegrass, and either not applying N fertilizer, or applying N fertilizer at a prescribed rate in accordance with a soil test to bring the soil N up to 107.06 lbs N per ac and was carried out at the OSU Wheat Pasture Research Unit in Stillwater, OK. Treatments were applied to pastures in a 2×2 factorial arrangement with 4 treatments: 1) volunteer annuals with no fertilization (Volunteer), 2) Volunteer + Fert (No cover crops interseeded with N fertilization), 3) Cover crops with no fertilization (CC), and 4) CC+Fert (Cover crops with N fertilization). The cover crop seed mix consisted of 9.8 lb/ac of BMR Sorghum Sudan, 14.3 lb/ac of Sunn Hemp, 9.8 lb/ac of mung bean, 19.6 lb/ac of cowpea, and 4.5 lb/ac of okra. In total, 68 steers with an average body weight (BW) of 741 ± 110.8 grazed over a 56-day period from June 19th to August 14th, 2025. Steers designated as testers (n = 40) grazed their respective pastures for the entirety of the grazing season and were used for performance measurements. Forage mass was estimated weekly using calibrated rising plate measurements with separate calibration curves formed for volunteer pastures and pastures planted with the cover crop mix. Steers were weighed twice at the start and end of the study for an average on and off weight, and every 28 days following turnout. Steers were stocked in accordance with forage mass estimates to allow for 3.5 lb DM/lb steer BW, and this was maintained through individually adding/removing the extra 28 steers as required every two weeks.
Findings
Final BW did not differ (P = 0.3643) among treatments. Grazing days per acre were increased by 55% for Volunteer and Volunteer+Fert (P < 0.05). However, CC and CC+Fert increased ADG (P < 0.01) by 70%, which resulted in those treatments also producing greater total BW gain per steer (P < 0.01), with CC producing almost double the total BW gain per steer compared to Volunteer. Total BW gain per acre was not influenced by forage type, but did increase by 27% with fertilization (P < 0.01). Overall, the cover crop mixture resulted in improved steer BW gains due to improved ADG, while utilization of N fertilizer in both cover crops and volunteer annual grasses resulted in increased steer performance on a per acre basis.
| Treatments1 Variable Bodyweight, lbs/ Steer | Treatments1 Cover crop No Fertilizer | Treatments1 Cover crop Fertilizer | Treatments1 Volunteer annual grass No Fertilizer | Treatments1 Volunteer annual grass Fertilizer |
|---|---|---|---|---|
| Initial Bodyweight | 736 | 728 | 694 | 736 |
| Final bodyweight | 842 | 840 | 750 | 811 |
| Total gain, lbs/Steer | 106 | 112 | 55 | 75 |
| Average daily gains, lbs/D | 1.9 | 2.03 | 0.97 | 1.34 |
| Grazing-D, ac | 36 | 38 | 57 | 52 |
| Total Bodyweight gain, ac | 61 | 77 | 55 | 70 |
| Treatments1 Variable Bodyweight, lbs/ Steer | Treatments1 P-values2 Forage | Treatments1 P-values2 Fertilizer | Treatments1 P-values2 Forage x Fertilizer |
|---|---|---|---|
| Initial Bodyweight | 0.6646 | 0.6514 | 0.5061 |
| Final bodyweight | 0.1892 | 0.4669 | 0.4509 |
| Total gain, lbs/Steer | 0.0036 | 0.1274 | 0.4069 |
| Average daily gains, lbs/D | 0.0036 | 0.1274 | 0.4069 |
| Grazing-D, ac | 0.0117 | 0.8678 | 0.2898 |
| Total Bodyweight gain, ac | 0.1276 | 0.0091 | 0.8600 |
1Treatments consisted of: volunteer (no fertilizer, volunteer annual grasses), volunteer+fert (N fertilizer, volunteer annual grasses), cc (no fertilizer, cover crop), and cc+fert (N fertilizer, cover crop). Nitrogen fertilizer was applied in accordance to a soil test to reach 120 lbs N following planting in may.
2F-test value of initial analysis of variance; means were separated using Fisher’s LSD for responses where significance was detected (α = 0.05).
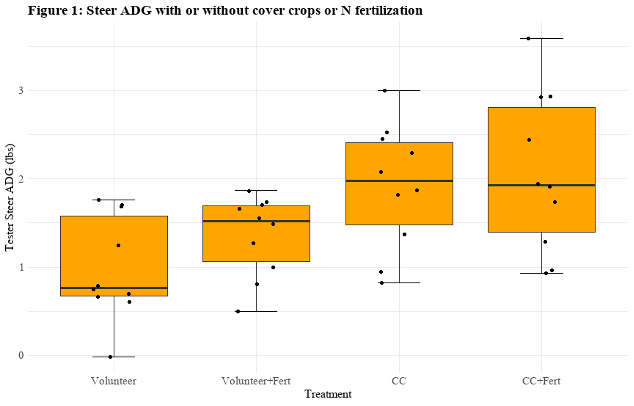 Figure 1. Performance of steers grazing crop fields during the summer with volunteer annual grasses or no-till seeded to cover-crop blends with or without nitrogen fertilization.
Evaluating the Impact of Differing Surface Areas and Weights of Beef Strip Loin and Sirloin Steaks in Tri-Gas Modified Atmosphere Master Bags on Retail Display
Grace E. Harris, Morgan Pfeiffer, Ranjith Ramanathan, Gretchen G. Mafi
Oklahoma State University Department of Animal and Food Sciences, Stillwater, OK 74078
Justification and Actions
The case-ready industry employs master bags with an oxygen scavenger to extend the shelf-life of PVC-overwrapped trays in the meat case (McMillin, 2008). However, no standards are available regarding surface area and/or weight that a single oxygen scavenger can optimally maintain. Filling the master bag with more meat than the oxygen scavenger can manage may have detrimental impacts on fresh meat color and ultimately shelf-life. Limited research is available evaluating the effects of weight or surface area of meat in a master bag with oxygen scavengers. Thus, the objective of this study was to evaluate the impact of differing surface areas and weights of steaks in CO-MAP on shelf stability and to establish standards for optimal surface area and weight of meat for oxygen scavenger capacity.
Thirty-two beef strip loins (IMPS #180) and forty-eight top sirloin butts (IMPS #184) both USDA Low-Choice were obtained from a commercial processor and wet aged to 21 d postmortem. Strip loins and top butts were alternately cut based on the different thicknesses required to obtain steaks for weight treatments and surface area treatments. Strip steak weight treatments were light weight (LW), intermediate weight (IW), and heavy weight (HW) and surface areas were small surface area (SS), medium surface area (MS), and large surface area (LS). Sirloin steak weight treatments were the same as strips and surface areas were small surface area (SS) and large surface area (LS). After slicing, steaks were placed into foam trays (n = 50 strip steaks; n = 46 sirloin steaks) with an absorbent pad and overwrapped with perforated polyvinyl chloride film. Trays were placed in master bags and flushed with 30% CO2, 0.4% CO, and 69.6% N2 before dark storage of 15 d. Oxygen depletion and headspace analysis were conducted, and objective and subjective color measurements were collected during retail display (d 1 – 7 strips; d 1 – 6 sirloins). Lipid oxidation, oxygen consumption, and metmyoglobin reducing ability were obtained at the beginning and end of retail display. Muscle color, surface discoloration, and overall acceptability were analyzed by a trained panel (n = 6).
Findings
On d 1 – 5, treatments of strip steak surface area were similar (P > 0.05) in muscle color. On d 6 and 7, SS strip steaks were brighter (P < 0.05) than MS, while LS were similar (P > 0.05) to both SS and MS. There was no difference (P > 0.05) in muscle color between weight treatments of strip steaks on any day of retail display. On d 1 for sirloin steaks, SS master bags were brighter (P < 0.05) than LS, however, on d 2 – 6, surface area treatments were similar (P > 0.05) in muscle color. On retail d 1, IW master bags were brighter (P < 0.05) than LW, while, HW master bags were similar (P > 0.05) to LW and IW. On d 2 – 6, there was no difference (P > 0.05) between sirloin steak weight treatments for muscle color. There was no difference (P > 0.05) in surface discoloration between treatments on any day for strip steak surface area or sirloin steak surface area or weight treatments. Strip steak weight treatments were similar (P > 0.05) in surface discoloration on d 1 – 4, however, on d 5 and 6, strip steaks from LWbags were more discolored (P < 0.05) than IW and HW. Then again on d 7, there was no difference (P > 0.05) in discoloration between strip steak weight treatments. On d 1 and d 3 – 7 of retail display, a* values were similar (P > 0.05) between surface area and weight treatments of strip steaks.
However, on d 2 of retail display, strip steaks from SS and MS master bags were redder (P < 0.05) than LS; and LW steaks were redder (P < 0.05) than IW and HW. On d 1 – 3, SS sirloin steaks were redder (P < 0.05) than LS, but no different on d 4 – 6. IW bags of sirloin steaks were redder (P < 0.05) than LW and HW on d 1, then treatments of weight were similar (P > 0.05) for the remainder of retail display. No treatment effect (P > 0.05) was observed for either cut for lipid oxidation, oxygen consumption, or metmyoglobin reducing activity. Generally, lipid oxidation increased numerically, while oxygen consumption and metmyoglobin reducing activity decreased numerically from the beginning to end of retail display.
Utilizing CO-MAP master bags has been proven to improve meat color. Implementing standards of surface area and/or weight of meat in master bags if an oxygen scavenger cannot handle capacity of product could allow for improved color stability and shelf-life of beef products. In this study, treatments of surface area and weights performed comparably. Therefore, it is believed that the scavenger utilized in this study had enough capacity to overcome the additional weight or surface area exposed within the master bag.
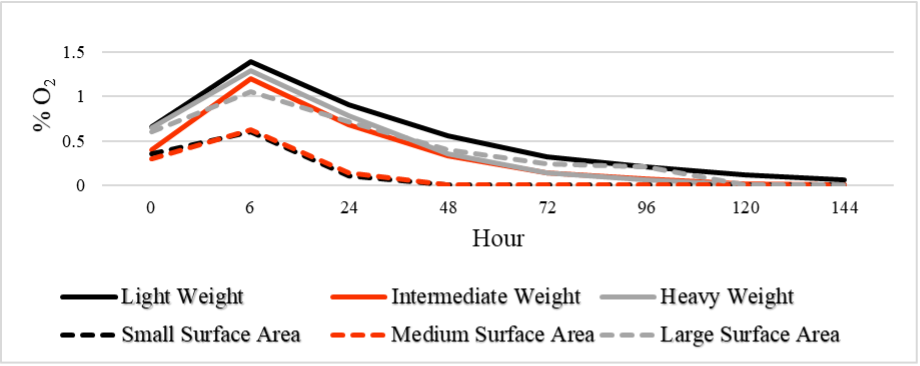 Figure 1. Oxygen depletion curve as averages from master bags flushed with varying weights (light weight, 2.7 kg; intermediate weight, 3.6 kg; heavy weight, 4.1 kg) and surface areas (small surface area, 203.2 – 228.6 cm2; medium surface area, 254 – 279.4 cm2; large surface area, 406.4 – 431.8 cm2) of strip steaks over a 144 h period.
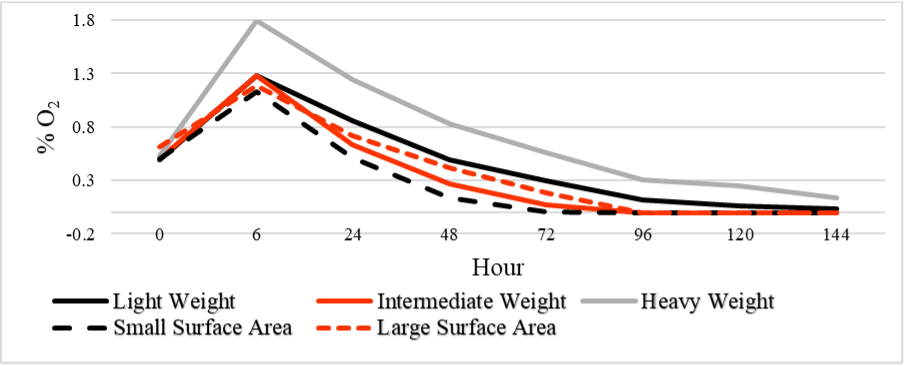 Figure 2. Oxygen depletion curve as averages from master bags flushed with varying weights (light weight, 1.36 kg; intermediate weight, 2.72 kg; heavy weight, 3.63 kg) and surface areas (small surface area, 279.4 – 304.8 cm2; large surface area, 381 – 406.4 cm2) of sirloin steaks over a 144 h period.
Impact of The Visual Severity of Dark-Cutting on Wet-Aged Beef Longissimus Lumborum Steak Palatability and Sensory Attributes
Madelyn A. Scott, Keayla Harr, Gretchen G. Mafi, Ranjith Ramanathan, and Morgan Pfeiffer
Oklahoma State University Department of Animal and Food Sciences, Stillwater, OK 74078
Justification and Actions
Beef surface color is often linked to wholesomeness in the minds of consumers, therefore any deviation from the consumer preferred bright-cherry red lean color can lead to meat products being discarded at retail, resulting in economic losses to the industry. Dark cutting beef presents an unconventional, dark colored lean that strays from the consumer preferred color. The severity of dark cutting in the ribeye (longissimus dorsi) at the time of grading can vary among carcasses, but its impact on palatability is unknown. Thus, the objective of this study was to evaluate the impact of visual severity of dark cutting on the eating quality of wet-aged beef longissimus lumborum steaks.
Beef strip loins (n = 8/treatment) were selected from commercial beef packing plants based on the visual severity of dark cutting in the ribeye. Strip loins corresponding to selected carcasses were allocated to treatments as follows: shady (1/2 dark), moderate (2/3 dark), and moderately severe (full dark) dark cutting, with a bright cherry-red (normal) colored control (Figure 1). Loins were fabricated 48 to 60 h postmortem and were bisected into two equal halves. Loin halves were randomly assigned to either a 21 or 39 d wet-aging period. Upon completion of aging, each loin half was sliced into 2.54 cm thick steaks. Steaks were randomly assigned to trained sensory panel and consumer sensory panel analyses. Trained panelists (n = 8) and untrained consumer panelists (n =122) evaluated steaks for palatability and sensory attributes on an 8-point hedonic scale. Samples were cooked using a Rational® oven to a peak internal temperature of 71°C for all analyses. The least square means were determined using the PROC GLIMMIX procedure of SAS and were considered significant at P < 0.05.
Findings
All results are presented in Table 1. The trained sensory panel determined steaks from moderately severe dark cutting had greater (P < 0.05) tenderness ratings than those classified as shady dark cutting and normal colored loins. Dark-cutting loins classified as moderate had greater tenderness ratings than normal colored loins (P > 0.05) and similar tenderness to both shady and moderately severe dark cutting loins (P > 0.05). All dark cutting classes had a less intense metallic flavor compared to normal colored steaks (P < 0.05). Consumer panelists found steaks from loins aged for 39 d had greater sustained juiciness in comparison to steaks from loins aged 21 d (P < 0.05). Moderately severe dark cutting had greater sustained juiciness compared to shady dark cutting and normal colored steaks (P < 0.05). Consumers observed that moderately severe dark cutting steaks had increased tenderness scores compared to shady dark cutting and normal colored steaks (P < 0.05). No “off-flavors” were detected for any normal colored or dark cutting steaks by consumers.
In conclusion, dark cutting beef holds promise for consumer sensory acceptance, therefore potential value recovery is possible for dark cutting beef products channeled to optimal foodservice markets. Understanding what consumers value and are willing to accept is vital to best marketing beef products.
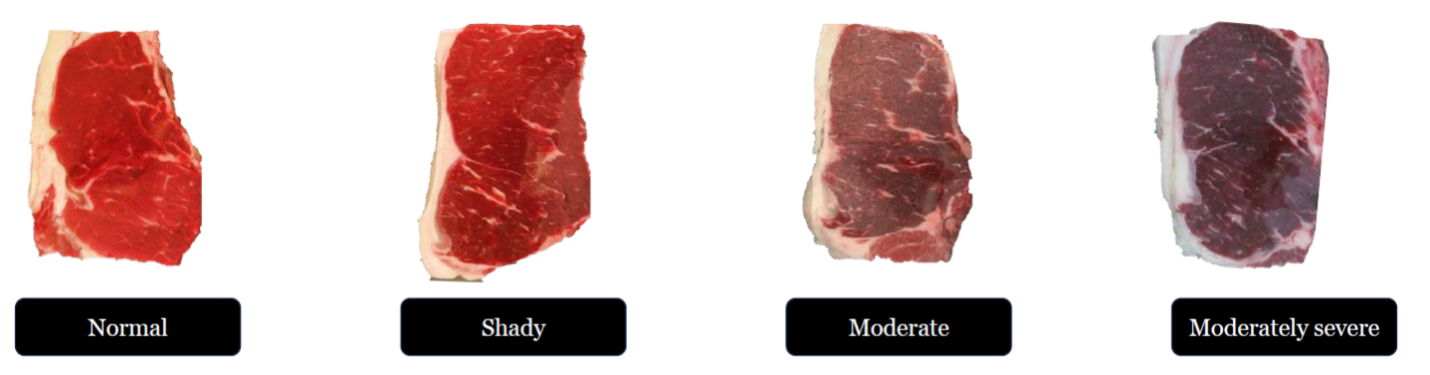 Figure 1. Image representation of the four categories of strip loins selected from facilities.
| Treatment Trained | Initial Juiciness Trained | Sustained Juiciness Trained | Tenderness Trained | Connective Tissue Trained | Metallic Flavor Trained |
|---|---|---|---|---|---|
| Aging (21 days) | 3.87 | 3.74 | 4.78 | 1.64 | 1.40 |
| Aging (39 days) | 3.75 | 3.67 | 4.89 | 1.47 | 1.50 |
| SEM | 0.14 | 0.14 | 0.32 | 0.13 | 0.07 |
| P-value | 0.56 | 0.42 | 0.61 | 0.06 | 0.10 |
| Treatment DC Severity | Initial Juiciness DC Severity | Sustained Juiciness DC Severity | Tenderness DC Severity | Connective Tissue DC Severity | Metallic Flavor DC Severity |
|---|---|---|---|---|---|
| Normal | 3.71 | 3.50 | 4.45c | 1.73 | 1.59a |
| Shady | 3.65 | 3.60 | 4.53bc | 1.51 | 1.41b |
| Moderate | 4.00 | 3.94 | 5.13ab | 1.51 | 1.37b |
| Moderately Severe | 3.90 | 3.78 | 5.23a | 1.49 | 1.41b |
| SEM | 0.61 | 0.63 | 0.43 | 0.54 | 0.10 |
| P-value | 0.07 | 0.04 | 0.03 | 0.51 | 0.65 |
| Treatment Consumer Panel | Initial Juiciness Consumer Panel | Sustained Juiciness Consumer Panel | Tenderness Consumer Panel | Connective Tissue Consumer Panel | Metallic Flavor Consumer Panel |
|---|---|---|---|---|---|
| Aging (21 days) | 4.36 | 4.02b | 5.54 | 3.24 | 1.73 |
| Aging (39 days) | 4.97 | 4.74a | 5.84 | 2.89 | 1.94 |
| SEM | 0.56 | 0.59 | 0.39 | 0.50 | 0.07 |
| P-value | 0.09 | 0.04 | 0.28 | 0.23 | 0.05 |
| Treatment Trained DC Severity | Initial Juiciness DC Severity | Sustained Juiciness DC Severity | Tenderness DC Severity | Connective Tissue DC Severity | Metallic Flavor DC Severity |
|---|---|---|---|---|---|
| Normal | 4.30 | 4.05b | 5.28b | 2.77 | 1.89 |
| Shady | 4.25 | 3.96b | 5.41b | 3.08 | 1.90 |
| Moderate | 4.68 | 4.30ab | 5.67ab | 3.37 | 1,75 |
| Moderately Severe | 5.43 | 5.20a | 6.40a | 3.03 | 1.78 |
| SEM | 0.61 | 0.63 | 0.43 | 0.54 | 0.10 |
| P-value | 0.07 | 0.04 | 0.03 | 0.51 | 0.65 |
a-cMeans without a common superscript differ (P < 0.05).
1Palatability scores: 1 = extremely dry, 8 = extremely juicy; 1 = extremely tough, 8 = extremely tender; 1 = no connective tissue, 8 = abundant connective tissue; 1 = extremely bland, 8 = extremely intense.
Comparison of Analytical Methods for Physically Effective Fiber Estimation in Ingredients and Rations of Finishing Beef Cattle Diets
Mallory LeDoux and Andrew Foote
Oklahoma State University Department of Animal and Food Sciences, Stillwater, OK 74078
Justification and Actions
Fiber is essential in ruminant diets for supporting rumen function, which is critical for digestion and overall health. Despite this, forage is included at minimal amounts in finishing beef cattle diets due to its lower digestibility, reduced energy density, and higher cost compared to concentrates. Balancing fiber inclusion with growth maximization remains a challenge in feedlot diet formulation. While fiber inclusion rates, sources, and chemical composition have been well studied, less attention has been given to the physical characteristics that affect fiber effectiveness or how to measure them. Recognizing this gap, researchers developed physically effective neutral detergent fiber (peNDF), which accounts for both the physical and chemical properties that influence chewing activity. Although widely applied in dairy nutrition, peNDF remains largely untested in finishing beef cattle rations. Neutral detergent fiber (NDF) concentration and particle size are the two components used to estimate peNDF. Particle size is measured using the Penn State Particle Separator (PSPS), consisting of three sieves, with decreasing pore size, and a bottom pan. Equations developed and validated in dairy rations may not accurately estimate peNDF in low-forage diets, where greater NDF variation across sieves can reduce accuracy. To assess peNDF estimation methods in finishing beef cattle diets, three approaches were compared. Ingredient and ration samples were collected weekly and divided into two subsamples: one analyzed as a total-sample for dry matter (DM) and NDF, the other separated using PSPS, with each sieve analyzed individually. Samples included short-cut prairie hay (SC Hay; ~1 inch), long-cut prairie hay (LC Hay; 3-5 inches), Sweet Bran, dry rolled corn, dry mineral supplement, and two total mixed rations (TMR) containing hay of different chop lengths. Ingredient peNDF was estimated using two methods. The first multiplied total-sample NDF content by percentage of particles retained on the top three sieves. The second used sieve-specific NDF values, multiplying each by the corresponding particle proportion and summing the top three. For rations, both methods were used along with a third that multiplied each ingredient’s peNDF by its inclusion rate and summed the values to estimate total ration peNDF.
Findings
One or more individual sieve NDF concentrations differed from total-sample NDF for both rations, both hay types, and Sweet Bran (P < 0.01), and tended to differ for dry-rolled corn (P = 0.07). Despite these differences, peNDF estimates only differed among methods for Sweet Bran (P = 0.02) and SC Hay (P = 0.03). Table 1 presents NDF content for all samples for both the total-sample and individual sieves. The NDF concentration of Sweet Bran retained on the 4 mm sieve was higher than that on other sieves and the total-sample, indicating non-uniform distribution of fiber across particle sizes. Differences observed in SC Hay may be due to processing effects from additional grinding to achieve a shorter chop length, which could alter particle distribution and fiber structure. In both cases, uneven NDF distribution across sieves reduced the accuracy of Method 1, which assumes uniform NDF concentration across all particles. Although NDF concentrations varied widely in both TMR samples, peNDF values did not differ by estimation method (P = 0.35), potentially due to small sample size (n = 8). Further research is needed to assess methodology across a broader range of ingredients in finishing beef cattle rations. However, these data suggest there may be limited benefit to ingredient or sieve-specific analysis.
| Sample | 19.0mm | 8.0mm | 4.0mm | <4.0mm | Total-sample | SEM | P-value |
|---|---|---|---|---|---|---|---|
| LC TMR | 71.36a | 35.93b | 16.36c | 23.98c | 23.73c | 2.704 | <0.01 |
| SC TMR | 74.74a | 42.52b | 16.67cd | 24.75cd | 22.16c | 2.050 | <0.01 |
| LC Hay | 80.59a | 79.83a | 77.82a | 73.68b | 77.74a | 1.116 | <0.01 |
| SC Hay | 78.74a | 78.14a | 76.73a | 70.84b | 76.82a | 0.705 | <0.01 |
| Corn | - | 10.56d | 9.99 | 9.17d | 9.27 | 0.530 | 0.07 |
| Sweet Bran | - | 46.53b | 57.05a | 42.70bd | 49.70bd | 1.666 | <0.01 |
| B340 | - | 5.86 | 8.15 | 9.08 | 8.53 | 1.742 | 0.53 |
a-eMeans within a row without a common superscript differ (P ≤0.05).
dMeans within a row without a common superscript tend to differ (P ≤0.10).
| Treatments | Treatments1 peNDF, % DM | Treatments1 peNDF, % DM | Treatments1 peNDF, % DM | Treatments1 | Treatments1 |
|---|---|---|---|---|---|
| Sample | Method 1 | Method 2 | Method 3 | SEM | P-value |
| LC TMR | 13.50 | 13.44 | 13.46 | 0.505 | 0.99 |
| SC TMR | 11.88 | 12.22 | 12.73 | 0.423 | 0.35 |
| LC Hay | 61.24 | 62.88 | - | 2.016 | 0.16 |
| SC Hay | 52.36 | 53.21 | - | 1.472 | 0.03 |
| Corn | 7.58 | 8.16 | - | 0.423 | 0.32 |
| Sweet Bran | 19.67 | 21.98 | - | 1.614 | 0.02 |
| B340 | 0.39 | 0.40 | - | 0.097 | 0.85 |
Winter Wheat Seeding Rate and Variety Impacts on Monthly and Cumulative Forage Yields
1Cody Gruber, 2Marty New, 2Michael Pettijohn, 3Jeff Wright and 1Paul Beck
1Oklahoma State University Department of Animal and Food Sciences, Stillwater, OK 74078
2South Central Research Station, Chickasha, OK 73018
3Oklahoma Foundation Seed Stocks, Stillwater, OK 74078
Justification and Actions
Seeding rate is an economic input for winter wheat production that is of interest to producers, as it is economically favorable to determine the seeding rate that maximizes forage production. Alterations in seeding rate or variety can impact intra and interplant competition, affecting forage yield, time to maturity and stand susceptibility to encroachment by volunteer wheat or weeds, particularly when stands become thin or weakened. This study was carried out to investigate the impacts of five different seeding rates for two commonly used winter wheat varieties on monthly and cumulative forage DM yields through the winter and spring growing seasons. For this study, 10, 20’ by 150’ plots were used at the South Central Research Station located in Chickasha, OK. Plots were planted one of two OSU wheat varieties: Scab Stryker, or Green Hammer at seeding rates of: 400,000, 800,000, 1.2 million, 1.6 million, or 2 million seeds/ac. Plots were established using conventional tillage methods and were planted on October 3rd, 2024 with liquid starter fertilizer applied at planting. Plots were top-dressed with 130 lbs of N/acre on January 27th, 2025, and sprayed with 1.5 pints/acre of MCPA on March 12th, 2025. Forage yields were determined monthly using hand clippings taken in a 1’ by 2’ frame. Two clippings were taken per quadrant, starting in December when forage reached 6” – 8” tall and every 30 days from that point until wheat harvest in April. Cumulative yields were determined with clippings taken at a random location each time, while monthly yields were taken at the same locations monthly to determine regrowth.
Findings
December and January monthly harvest yields for Green Hammer variety outperformed Stryker at most seeding rates, resulting in two linear curves that follow the same slope, but with intercepts that were 375 and 173 pounds/acre lower for Stryker in December and January, respectively. However, following January, all monthly harvest yields resulted in Stryker producing similar or greater harvest yields to Green Hammer at and above the 1.6 million seeds/acre rate. Overall, cumulative yields reflect the trends observed with monthly harvest yields. Green Hammer outperformed or matched Stryker’s performance above the 1.2 million seeding rate for January, and at every seeding rate besides the 400,000 seed/acre rate in February. Forage yields in March and April decreased with increasing seeding rate and were below Stryker at seeding rates between 800,000 to 1.6 million seeds/acre. This may be a result of differences in tillering between varieties. These findings indicate that differences in time to maturity between varieties may be used to strategically time when forage availability occurs, ensuring forage availability at the times it is most needed.
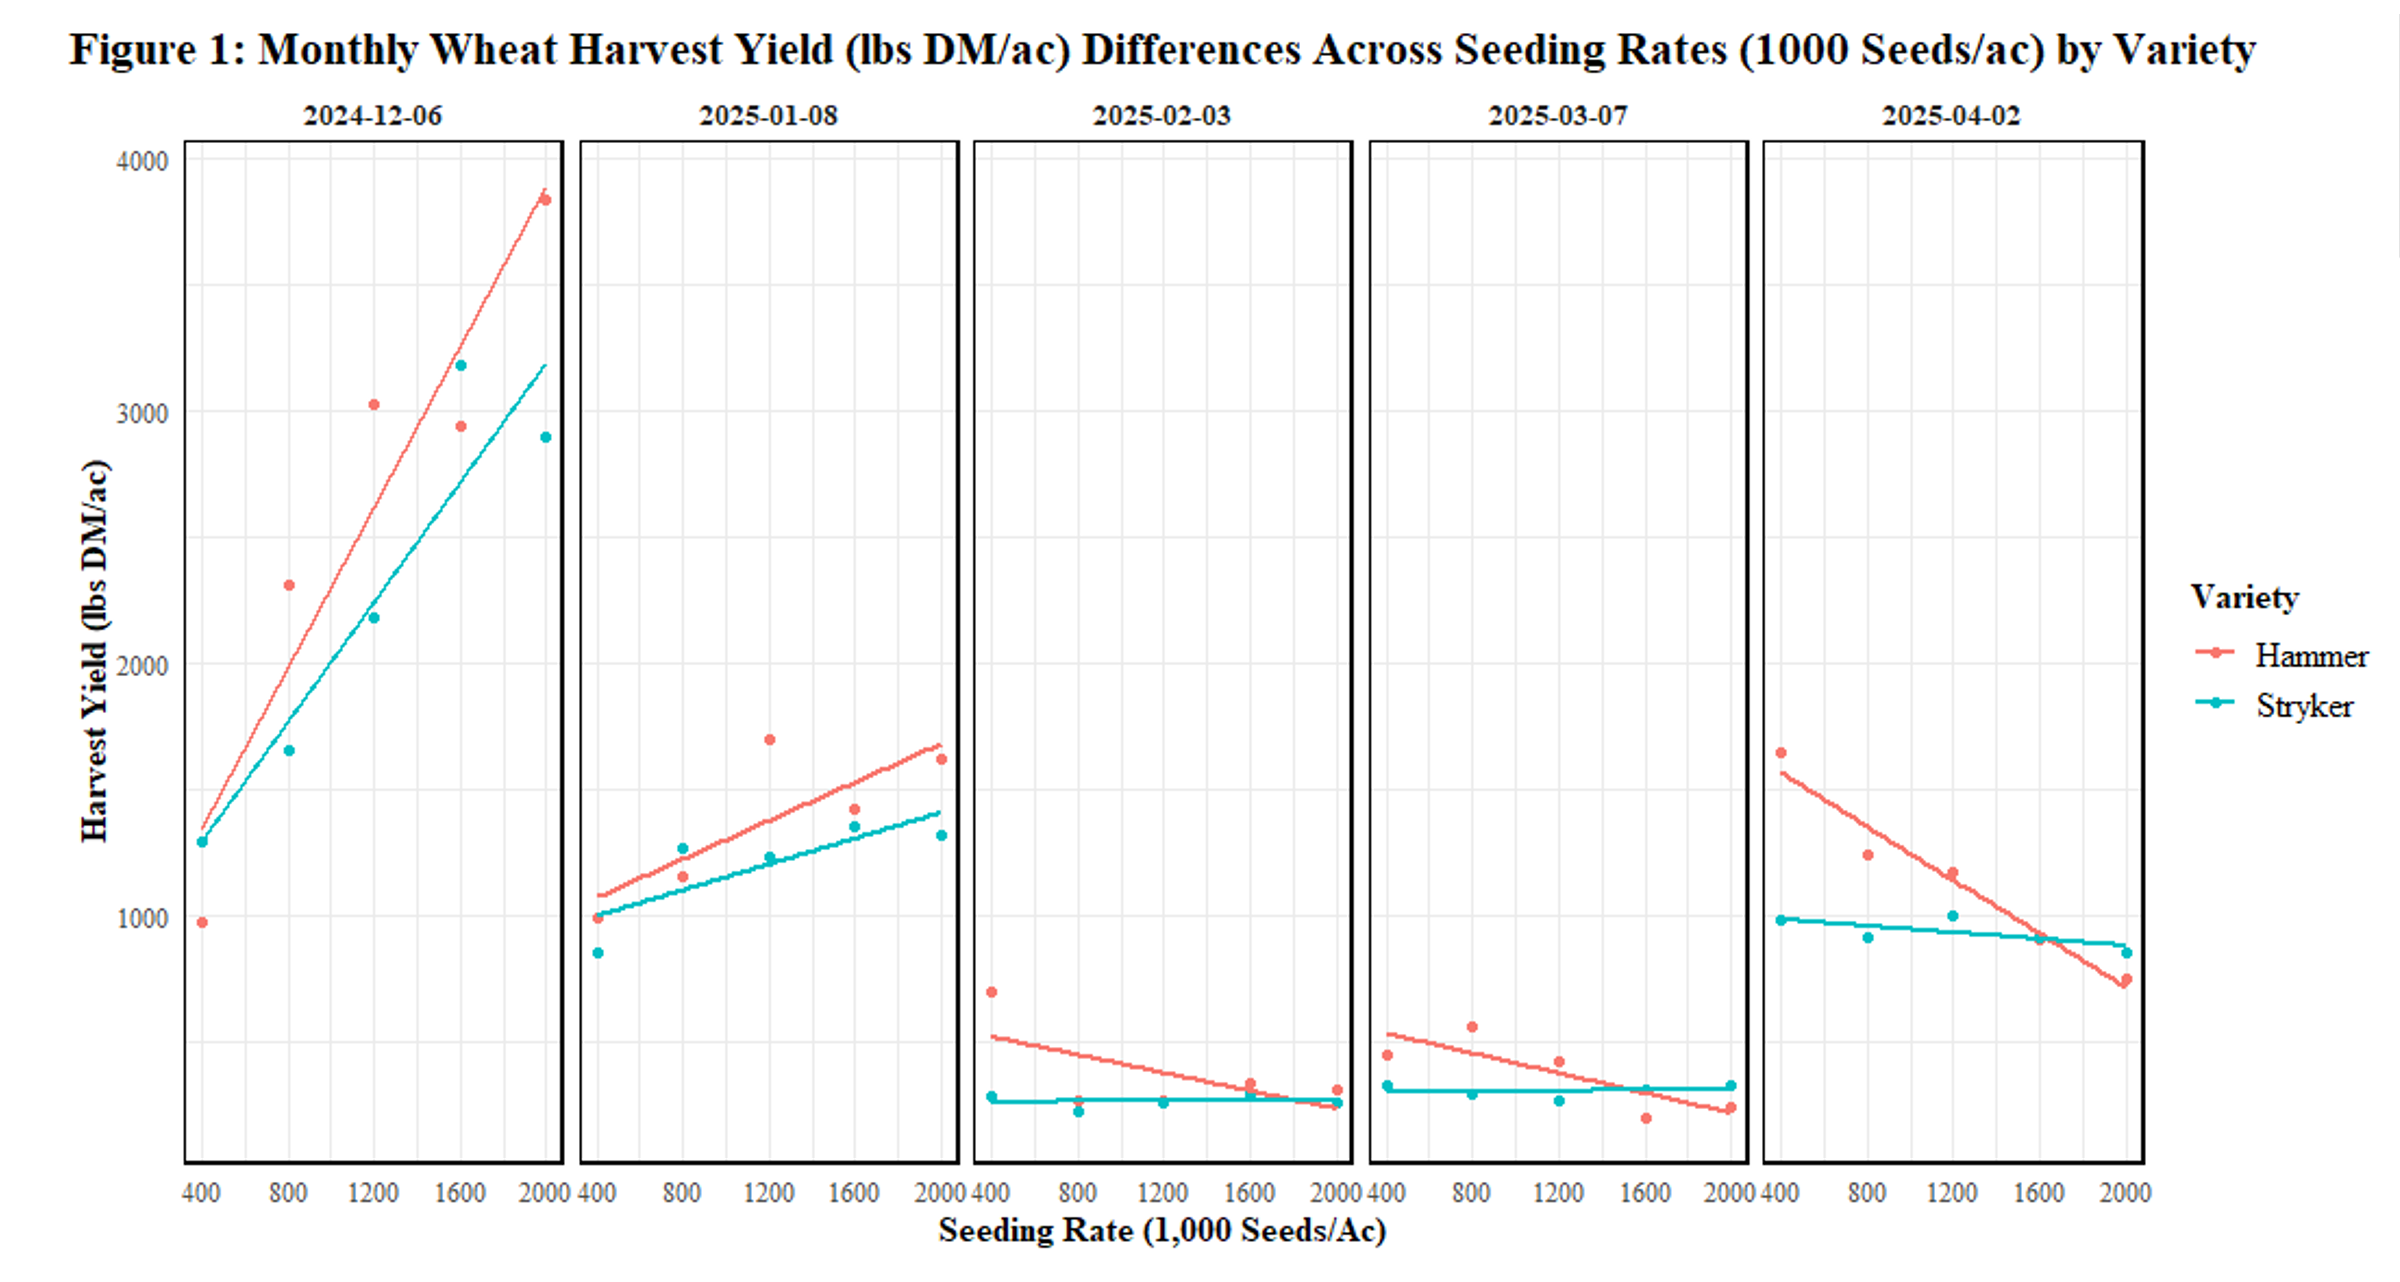 Figure 1: Monthly wheat harvest yield (lbs DM/ac) differences across seedling rates (1,000 seeds/ac) by variety.
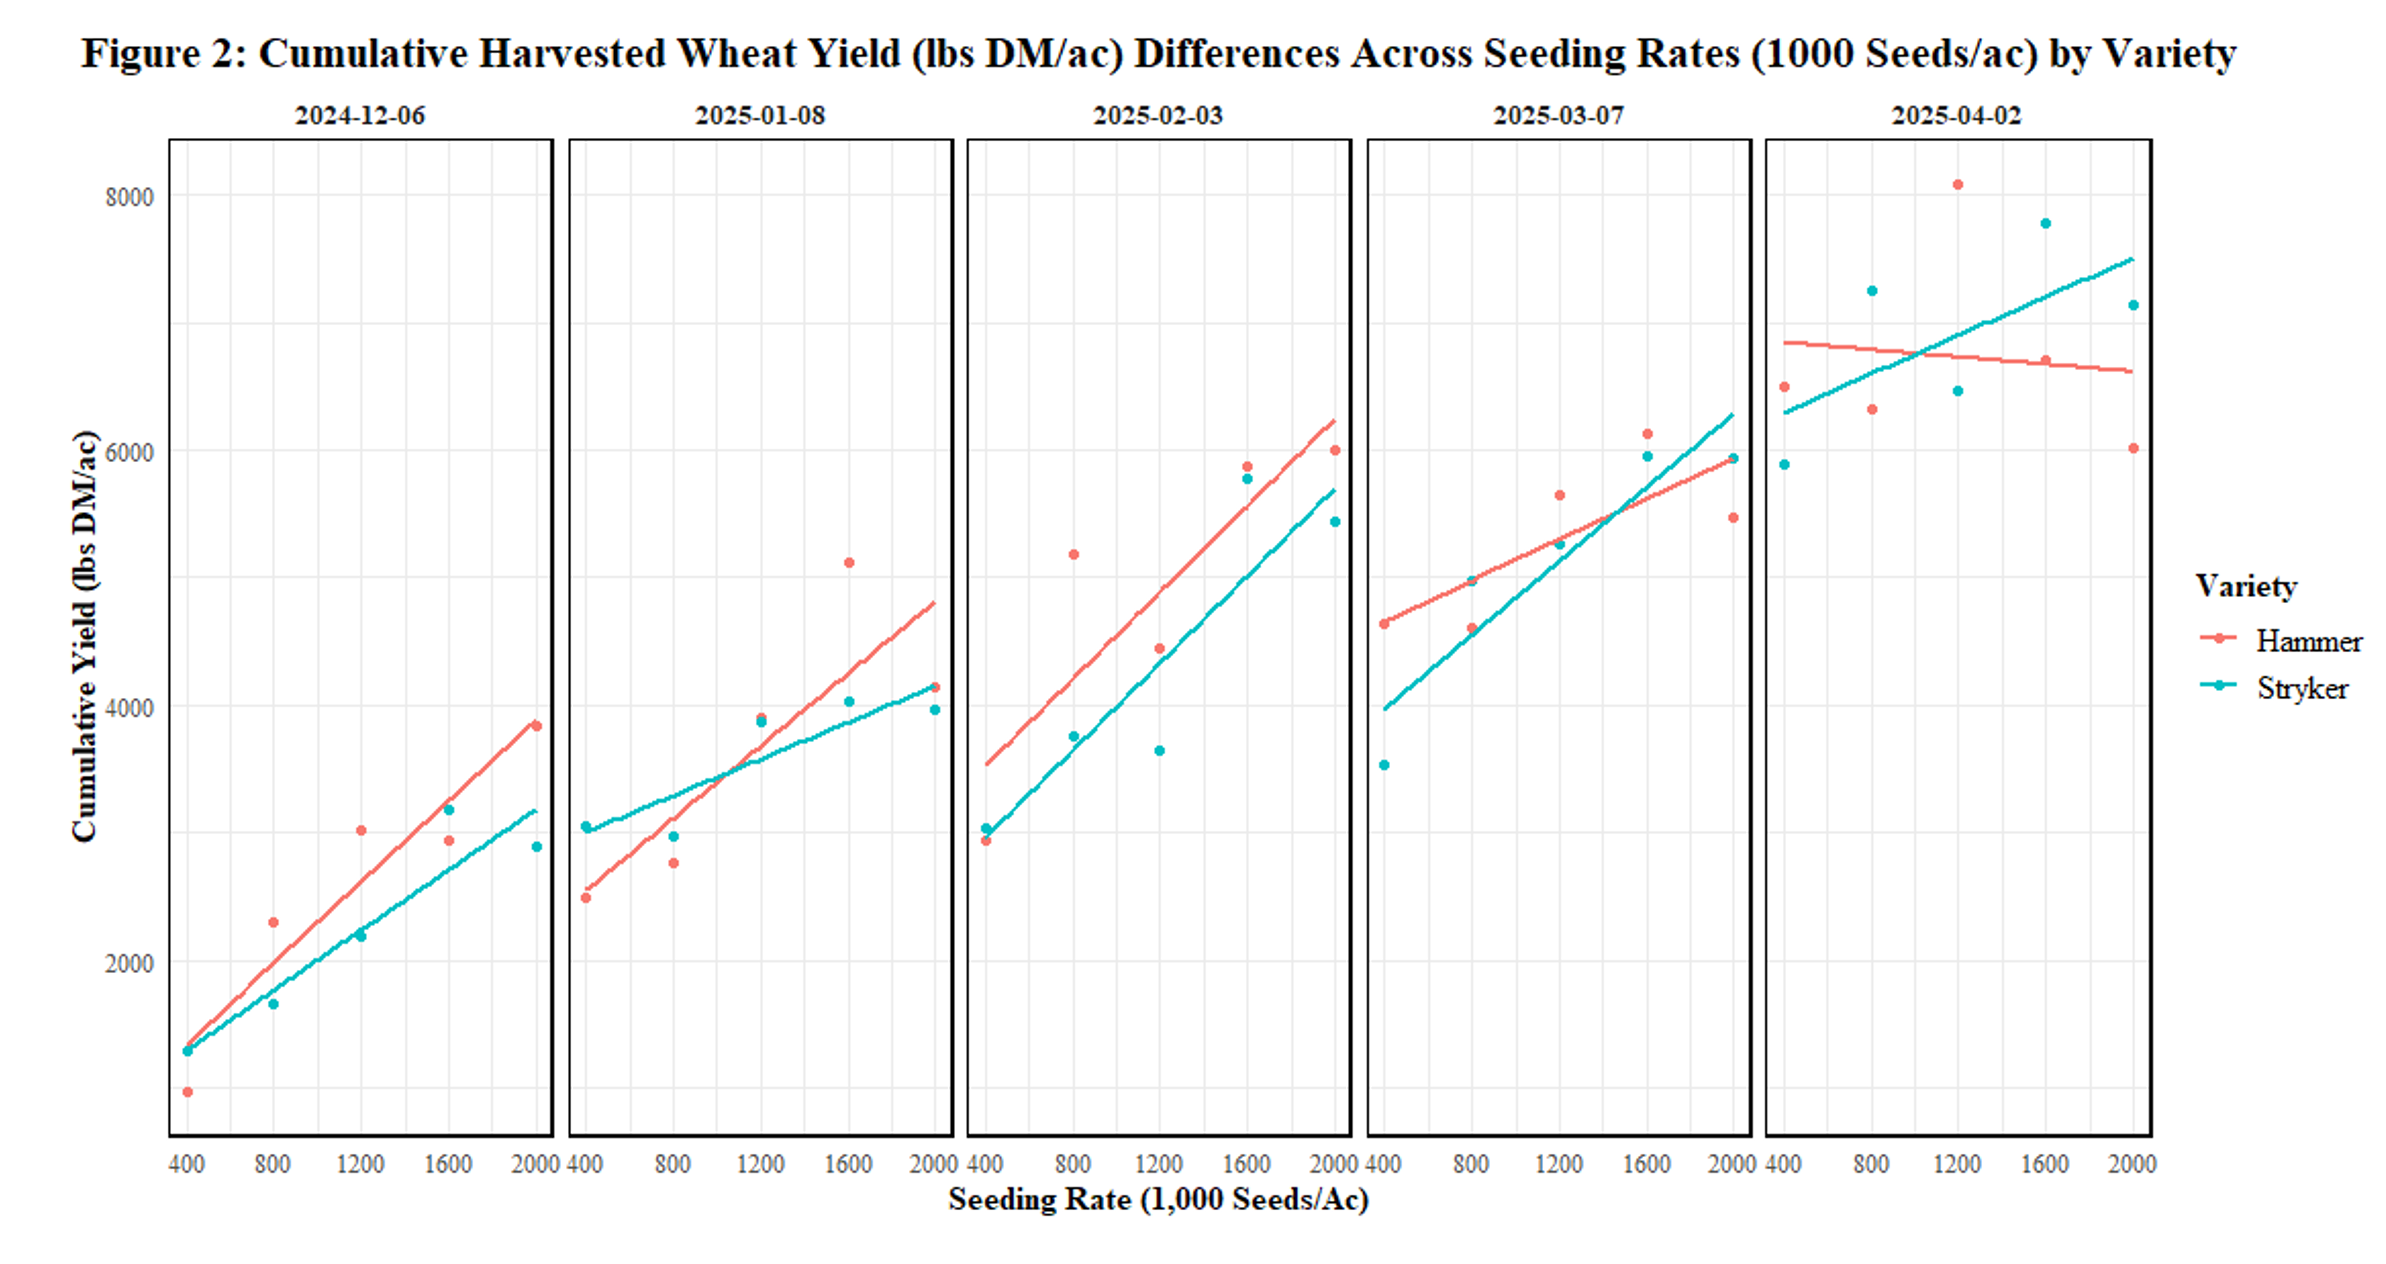 Figure 2: Cumulative harvested wheat yield (lbs DM/ac) differences across seedling rates (1,000 seeds/ac) by variety.
References:
Khalil, S.K., et al. 2011. Dual purpose wheat for forage and grain yield in response to cutting, seed rate and nitrogen. Pak. J. Bot. 43(2):937-947.
Slafer, G.A., G.A. Garcia, R.A. Serrago, and D.J. Miralles. 2022. Physiological drivers of responses of grains per m2 to environmental and genetic factors in wheat. Field Crops Research. 285:1-23. doi:10.1016/j.fcr.2022.108593
Efficient Forage Utilization in Mature Beef Cows
Samuel R. Talley1, Emma A. Briggs2, Megan M. Rolf2, Bailey J. Tomson1, Mariana E. Garcia-Ascolani1, Andrew P. Foote1, Justin D. Crosswhite1, Paul A. Beck1, R. Ryan Reuter, David L. Lalman1
1Department of Animal and Food Sciences, Oklahoma State University, Stillwater, OK
2Department of Animal Sciences and Industry, Kansas State University, Manhattan, KS
Justification and Actions
The overriding factors driving profitability in U.S. cow-calf operations remain forage and supplemental feed costs, which represent 51% of the total operating costs and 61% of variable costs for an average producer. Additionally, 74% of the total feed energy required to produce one pound of finished beef carcass is consumed from the cow-calf sector. There is limited research investigating the potential to improve ranch profitability by identifying productive cattle with lower forage and feed requirements. The first step in developing a system to identify forage-efficient cattle is to investigate the effectiveness of testing animals at different stages of production. Little progress can be made if efficiency measurements during one stage of production are unrelated to efficiency measurements during another stage of production. Therefore, the objective of this study is to determine the relationship between ranking for feed intake and residual feed intake (RFI) during gestation and lactation. Additionally, differences in animal performance and gas emissions were evaluated between cows of differing efficiency classifications.
Sixty-seven mature Angus and Angus-cross cows (n = 41, Year 1; n = 26, Year 2) were used in consecutive lactation and gestation trials over 2 years. The trials involved a 14-d adaptation period, with a minimum 71-d data collection period. Animals were housed in drylot pens containing modified SmartFeed individual animal intake measuring units (C-Lock Inc., Rapid City, SD) at the Oklahoma State University Range Cow Research Center, North Range Unit. Cows had ad libitum access to unprocessed longstem bermudagrass hay (> 12.4% CP and > 55% TDN) and a free-choice mineral and vitamin supplement. During the experiments measurements of forage dry matter intake (DMI), weight gain, calf weaning weight, milk yield, body condition score (BCS), methane (CH4) and carbon dioxide (CO2) were collected. RFI was calculated at the end of each study period as the difference between an animal’s observed DMI and predicted DMI, with lower RFI values indicating greater feed efficiency. Animals were classified as efficient, moderate, or inefficient utilizers of forage based on RFI values.
Findings
There were strong positive correlations for DMI and RFI between lactation and gestation (r = 0.79 DMI and r = 0.68 RFI), indicating that there is minimal re-ranking of cow efficiency and intake across physiological states. Efficient classified cows consumed 18.8% less forage than inefficient cows in lactation, and 27.8% less forage than inefficient cows in gestation. There was no difference in body weight, BCS, average daily gain, milk production, or calf performance between efficiency classifications in either physiological state. These data indicate that intake and RFI determined during one stage of production is a good reflection of their intake and efficiency throughout the annual production cycle. In this experiment, efficiency classification was not clearly associated with greenhouse gas emissions (per unit of metabolic body weight). In summary, low RFI cows have the potential to improve the profitability and sustainability of cow-calf operations by reducing forage intake without sacrificing productivity.
| Classification Variable1 | Classification Efficient | Classification Moderate | Classification Inefficient | Classification SEM2 | Classification P-Value |
|---|---|---|---|---|---|
| n | 23 | 27 | 17 | - | - |
| DMI, lbs./d | 30.6a | 33,3b | 37.0c | 0.57 | <0.001 |
| RFI, lbs./d | -2.878a | 0.26b | 3.33c | 0.31 | <0.001 |
| Mean BW, lbs. | 1365 | 1325 | 1362 | 19.69 | 0.59 |
| ADG, lbs./d | -0.07 | -0.13 | -0.02 | 0.07 | 0.99 |
| Milk Yield, lbs./d | 16.9 | 18.0 | 17.5 | 0.48 | 0.62 |
| Mean BCS | 5.91 | 5.90 | 5.75 | 0.08 | 0.73 |
| 205d Adj. Calf WW, lbs. | 575 | 551 | 578 | 12.50 | 0.52 |
| CH4, gd-1/lbs. BWO.75 | 1.15a | 1.22b | 1.19ab | 0.01 | 0.04 |
| CO2 g d-1/lbs. BWO.75 | 33.9 | 35.2 | 34.6 | 0.03 | 0.19 |
1DMI = Dry matter intake, RFI = Residual feed intake, BW = Body weight, ADG = Average daily gain,
BCS = Body condition score, WW = Weaning Weight, CH4, g d-1/lbs. BW0.75 = Grams of methane per pound of metabolic body weight, CO2, g d-1/lbs. BW0.75 = Grams of carbon dioxide per pound of metabolic body weight
2Standard error of the mean
a,b,cMeans differ within row (P < 0.05)
| Classification Variable1 | Classification Efficient | Classification Moderate | Classification Inefficient | Classification SEM2 | Classification P-value |
|---|---|---|---|---|---|
| n | 23 | 25 | 16 | - | - |
| DMI, lbs./d | 25.4a | 27.8b | 33.5c | 0.75 | <0.001 |
| RFI, lbs./d | -3.73a | 0.20b | 5.11c | 0.51 | <0.001 |
| Mean BW, lbs. | 1415 | 1369 | 1391 | 19,69 | 0.58 |
| ADG, lbs./d | 1.65 | 1.65 | 1.65 | 0.07 | 0.99 |
| Mean BCS | 6.08 | 6.00 | 6.25 | 0.13 | 0.59 |
| CH4 g d-1/lbs. BW0.75 | 1.01y | 1.07z | 1.06yz | 0.01 | 0.07 |
| CO2 g d-1/lbs. BW0.75 | 32.2a | 33.7b | 33.5ab | 0.44 | 0.03 |
1DMI = Dry matter intake, RFI = Residual feed intake, BW = Body weight, ADG = Average daily gain, BCS = Body condition score, CH4, g d-1/lbs. BW0.75 = Grams of methane per pound of metabolic body weight, CO2,
g d-1/lbs. BW0.75 = Grams of carbon dioxide per pound of metabolic body weight
2Standard error of the mean
a,b,cMeans differ within row (P < 0.05), y,zMeans differ within row (P < 0.10)
The Economic Impact of Selecting for Forage Efficiency in Beef Cows
Samuel R. Talley1, Emma A. Briggs2, Megan M. Rolf2, Bailey J. Tomson1, Mariana E. Garcia-Ascolani1, Andrew P. Foote1, Justin D. Crosswhite1, Paul A. Beck1, R. Ryan Reuter1, David L. Lalman1
1Department of Animal and Food Sciences, Oklahoma State University, Stillwater, OK
2Department of Animal Sciences and Industry, Kansas State University, Manhattan, KS
Justification and Actions
Reducing feed costs in cow-calf operations offers the potential to increase profitability and efficiency of beef production. For example, the Center for Farm Financial Management (2023) reported a 67% difference in feed costs between the most and least profitable cow/calf operations, with a 23% difference in pounds of calf weaned per cow exposed. Residual feed intake (RFI) can be a valuable tool for identifying feed efficient animals; however, care should be made to not base selection decisions from a single trait. An efficient cow herd is one that combines productivity with low-moderate forage intake.
To evaluate the relative impact of selecting for forage-efficient cows, an economic model was developed using DMI, RFI, and productivity data generated from 67 cows and their calves at the Oklahoma State University Range Cow Research Center, North Range Unit. Average annual dry grass hay intake was calculated for each cow using gestation period and lactation period data. Average annual hay intake was assumed to approximate average annual forage intake. The model is based on a 2,560-acre central Oklahoma ranch with average annual forage production of 3,500 lbs./acre and a harvest efficiency of 25%. The annual lease rate was $25/acre of open grassland resulting in $3.70/cwt of forage consumed. Supplement cost was set at $94/cow/ year. Operating costs associated with herd health, breeding, interest, and machinery were set at $245/cow/year. No change over time was assumed for reproductive performance and thus, the weaning rate was set at 85% for both selected and non-selected classifications. Replacement heifer cost was set at $2,500. The selection differential was based on the most efficient 1/3 of the cows using gestation-period RFI compared to the average for the entire herd, including the efficient cows. Forage intake heritability was set at 0.53 (Freetly et al., 2020), generation interval was 5 years, and the selection horizon was 10 years.
Findings
By gradually selecting efficient cows, cow herd forage intake declined by about 11% over the 10-year horizon. This results in an increased grazing capacity of 18 cows on this ranch and about 15 additional weaned calves per year while applying about the same grazing pressure to the land base. Neither cow mature weight, nor calf weaning weight were significantly different. Despite no significant change in calf weaning weight, increased grazing capacity led to a 10.8% rise in calf revenue. Net returns before operator labor and taxes were improved by about 23% over the 10-year selection period. More work is necessary to determine if long-term selection for moderate forage intake and improved RFI during gestation impacts reproductive efficiency and overall ranch profitability.
| Variable1 | Non-Selected | Difference | Inefficient |
|---|---|---|---|
| Average Annual Cow DMI, lbs. | 27.8 | 31.4 | -11.2% |
| Average Annual Cow Weight, lbs. | 1,303 | 1,355 | -3.8% |
| Annual Pair Feed Cost, $/Cow | $504.53 | $546.86 | -8.2% |
| Ranch Stocking Capacity, # of Cows | 202 | 184 | 9.5% |
| ADJ. Calf WW, lbs. | 563 | 564 | -0.2% |
| Calf Revenue. $/Year | $266,318 | $240,423 | 10.8% |
| Net Return Before Labor and Taxes, $/Year | $81,203 | $65,885 | 23.2% |
| Net Return Before Labor and Taxes, $/Acre | $32 | $26 | 23.2% |
2,560-acre central Oklahoma ranch
3,500 lb. forage/acre with 25% harvest efficiency
$94/head/year supplement cost
$2.92/lb. base 500 lbs. calf price & $1.10/lb. cull cow price
$245/head/year misc. costs (health, breeding, interest, etc.)
Assumes equal reproductive performance (no change)
Two-Year Assessment of Supplementation Feeding Strategies on Stocker Calf Performance Grazing Mixed Grass Prairie in Western Oklahoma
Timothy P. Vining1, Charles Worthington1, Eric A. DeVuyst1, Donovan Smith2, Matt Harrison2, Tom Fanning3, Andy Lizardo3, and Paul A. Beck1
1Oklahoma State University, 2Pellet Technology USA, LLC, 3Buffalo Feeders
Justification and Actions
Growing steers grazing rangelands during the summer often require supplementation to offset nutrient deficiencies and achieve adequate body weight gain. This is due to a dramatic decrease in native forage nutrient quality throughout the summer months. Extruded dried distillers grains (DDGS), a byproduct of ethanol production, make an excellent beef cattle supplement to match nutrient deficiencies in the grazed forage. making an excellent cattle supplement. This research provided DDGS supplements to grazing cattle in the form of a ¾ in. diameter “cube” or a hydraulically pressed block in a plastic “tub”. Tubs commonly cost as much as twice per ton more than cubes. However, tubs require less frequent placement and save time, labor, and fuel cost compared to feeding cubes more frequently. To evaluate supplementation delivery methods under these constraints, a two year stocker calf supplementation trial was conducted at the Marvin Klemme Range Research Station near Bessie, OK.
Findings
In 2024 and 2025, crossbred steer calves (n = 150 and 149 and initial body weight = 620 and 630, respectively) grazed native range pastures at the Marvin Klemme Range Research Station near Bessie, OK during the summer grazing season. Grazing occurred from early June to early October in 2024 and from late May to late September in 2025. Steers grazed for 140 days in 2024 and for 145 days in 2025. Calves were randomly assigned to one of two treatments: 1) hand-fed extruded DDGS cubes targeted at 2.5 pounds per day prorated for 3-day/week feeding, or 2) 200-pound DDGS tubs placed every 5-7 days based on pasture size and stocking rate to achieve a similar feeding rate of 2.5 lbs./steer/day. Average daily gain did not differ between treatments during early season or late season nor across the total grazing season (P ≥ 0.178). A cost sensitivity analysis, which included mileage costs of $2.00 to $2.50/mile and estimated feed costs of $0.26/lb. for DDGS cubes and $0.55/lb. for tubs, indicated that a roundtrip feeding route of 54 miles would be required for reduced delivery costs to offset the higher cost of tubs. Thus, performance outcomes were comparable between treatments, suggesting that tubs may provide a practical alternative when labor and fuel costs are limiting factors. In conclusion, supplementation using DDGS tubs was as effective as hand-feeding DDGS cubes three times per week for stocker calves grazing mixed grass prairie in western Oklahoma.
| Treatment Body weight, lbs. | Treatment Tub Body weight, lbs. | Treatment Cube Body weight, lbs. | Treatment SE Body weight, lbs. | Treatment P-value Body weight, lbs. |
|---|---|---|---|---|
| Initial | 629 | 624 | 2.51 | 0.994 |
| Mid-summer | 736 | 743 | 6.99 | 0.468 |
| Final | 900 | 904 | 5.11 | 0.649 |
| Treatment Body weight, lbs. ADG, lbs./d | Treatment Tub Body weight, lbs. ADG, lbs./d | Treatment Cube Body weight, lbs. ADG, lbs./d | Treatment SE Body weight, lbs. ADG, lbs./d | Treatment P-value Body weight, lbs. ADG, lbs./d |
|---|---|---|---|---|
| Early Summer | 1.50 | 1.63 | 0.09 | 0.178 |
| Late Summer | 2.18 | 2.21 | 0.09 | 0.819 |
| Total Season | 1.85 | 1.91 | 0.07 | 0.204 |
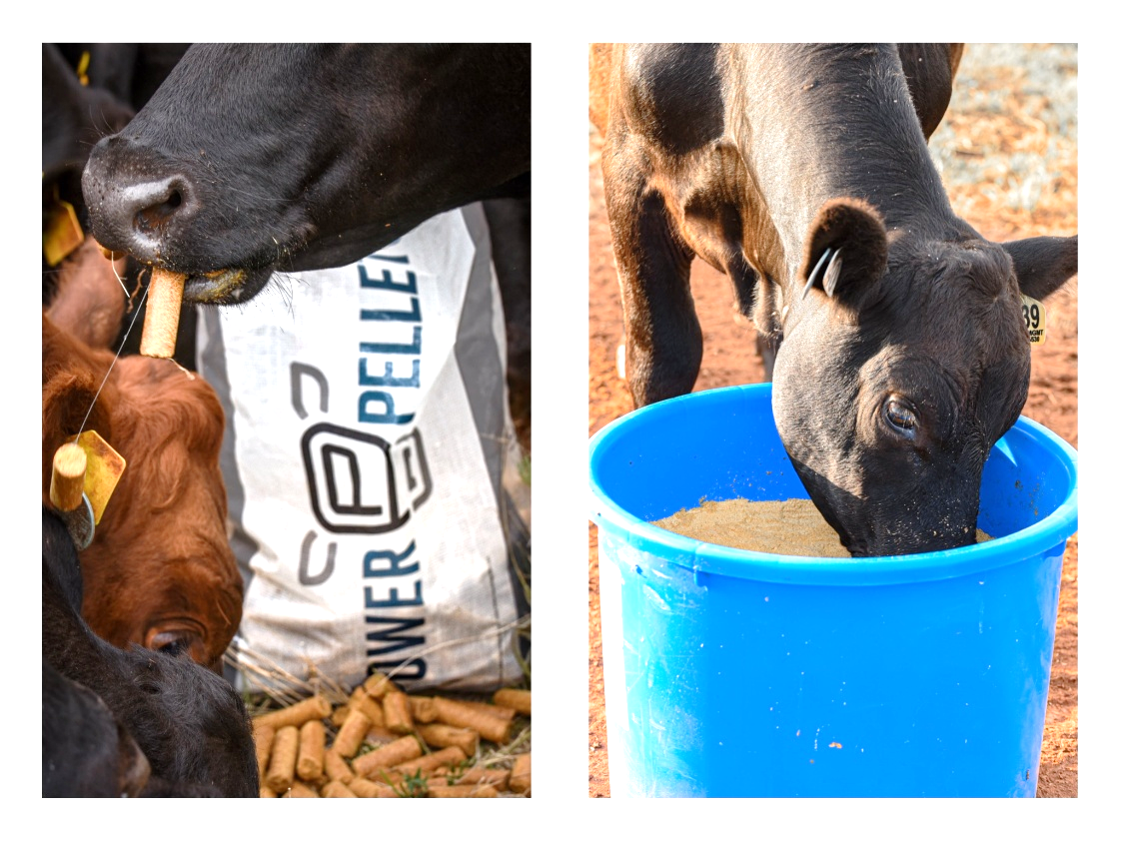 Figure 1. Pictures of extruded dried distiller’s grains cubes (left) and extruded dried distiller's grains tub (right) supplements provided to growing steers grazing native pasture at Klemme Range Research Station.