2024 Needs Assessment Report
Surveys were conducted with two samples: a random sample of 600 Oklahoma residents (General Population Sample) and a sample of 645 individuals reached through the network of county, area and district OSU Extension educators and specialists (OSU Extension Network Sample).
Results
- Q2. Have you heard of OSU?
Extension Network Respondents
- No - 0.2%
- Yes - 99.8%
General Population Respondents
- No - 1.3%
- Yes - 98.7%
- Q3. What comes to mind when you think of OSU?
Extension Network Respondents
- Ag Culture
- Football
- Education
- Research
- Landgrant
- School/University
- Orange
- Community
- Science
General Population Respondents
- Football
- Cowboy
- agriculture
- College/School/University
- Good/Great
- Team
- Oklahoma
- Stillwater
- Pistol
- Q4: OSU ability to provide a quality education?
Extension Network Respondents
- Very Poor - 0.2%
- Poor - 0.2%
- Average - 9.8%
- Good - 34.2%
- Excellent - 55.7%
General Population Respondents
- Very Poor - 0.3%
- Poor - 0.8%
- Average - 12.7%
- Good - 36.5%
- Excellent - 49.7%
- Q5: OSU ability to produce quality research?
Extension Network Respondents
- Very Poor - 0.2%
- Poor - 0.8%
- Average - 10.1%
- Good - 35.7%
- Excellent - 53.2%
General Population Respondents
- Very Poor - 0.7%
- Poor - 0.3%
- Average - 14.3%
- Good - 39.8%
- Excellent - 44.8%
- Q6: Heard of OSU Extension?
Extension Network Respondents
- No - 1.3%
- Yes - 98.7%
General Population Respondents
- No - 40.3%
- Yes - 59.7%
- Q7: What comes to mind when you think of OSU Extension?
Extension Network Respondents
- Education
- Community
- Agriculture
- County
- Service
- Gardening
- 4-H
- Programs
- Information
- Resource
General Population Respondents
- Heard
- Education
- Extension
- OSU
- Agriculture
- Nothing
- Research
- Campus
- College
- Programs
- Q8: OSU ability to provide quality extension services?
Extension Network Respondents
- Very Poor - 0.5%
- Poor - 2.2%
- Average - 15.4%
- Good - 34.0%
- Excellent - 48.0%
General Population Respondents
- Very Poor - 0.5%
- Poor - 1.0%
- Average - 26.3%
- Good - 37.3%
- Excellent - 34.8%
- Q9: Participated in OSU Extension?
Extension Network Respondents
- Prefer Not to Say - 4.4%
- No - 10.8%
- Yes - 84.8%
General Population Respondents
- Prefer Not to Say - 6.5%
- No - 80.0%
- Yes - 13.5%
- Q10: Work in the following sectors or industries?
Extension Network Respondents
- Farming/ranching - 47.5%
- Education/youth development - 25.8%
- Other - 23.4%
- Agribusiness - 19.8%
- Nonprofit/non-government organization - 15.5%
- Government - 15.1%
- Healthcare/health services - 10.3%
- Economic Development - 5.6%
- Forestry/natural resources - 5.4%
- Food processing - 4.9%
General Population Respondents
- Other - 63.0%
- Healthcare/health services - 10.3%
- Food processing - 9.0%
- Farming/ranching - 8.5%
- Education/youth development - 8.0%
- Nonprofit/non-government organization - 5.8%
- Government - 5.3%
- Agribusiness - 4.3%
- Economic Development - 3.8%
- Forestry/natural resources - 2.5%
- Q:11 Heard of the OSU Extension Programs, Resources, or Services Extension Network
Respondents?
Extension Network Respondents
- County Extension Office - 87.2%
- Soil, water, and forage testing - 81.1%
- Extension Fact Sheets - 80.4%
- 4-H Youth Development - 78.2%
- Master Program - 70.1%
- County Educators - 69.3%
- Oklahoma Gardening TV Show - 65.3%
- Agricultural Programs - 62.3%
- Family & Consumer Science Programs - 55.7%
- Volunteering - 53.9%
- Area Specialists - 48.0%
- Community Nutrition & Health Program - 45.7%
- SunUp TV - 44.8%
- Certifications - 40.8%
- Online Courses - 34.8%
- Specialized Regional/State Conferences - 31.0%
- County Government Training - 21.2%
- Extension Bot - 12.7%
- None of the Above - 1.6%
General Population Respondents
- Agricultural Programs - 33.2%
- Soil, water, and forage testing - 30.3%
- 4-H Youth Development - 39.8%
- County Extension Office - 26.2%
- None of the Above - 24.8%
- Online Courses - 23.3%
- Oklahoma Gardening TV Show - 22.2%
- Volunteering - 21.0%
- Master Program - 18.7%
- Certifications - 15.7%
- Extension Fact Sheets - 15.7%
- Family & Consumer Science Programs - 15.7%
- Community Nutrition & Health Program - 13.7%
- County Educators - 10.3%
- Area Specialists - 8.0%
- Extension Bot - 5.3%
- County Government Training - 5.2%
- SunUp TV - 4.5%
- Specialized Regional/State Conferences - 4.3%
- Q12: Used/Participated of the OSU Extension Program, Resources, or Services?
Extension Network Respondents
- Extension Fact Sheets - 80.4%
- County Extension Office - 79.5%
- County Educators - 75.9%
- Soil, water, and forage testing - 64.4%
- Area Specialists - 64.1%
- Oklahoma Gardening TV Show - 57.2%
- 4-H Youth Development - 48.1%
- SunUp TV - 42.3%
- Volunteering - 42.1%
- Agricultural Programs - 33.6%
- Specialized Regional/State Conferences - 31.4%
- Certifications - 31.2%
- Master Program - 24.7%
- Family & Consumer Science Programs - 16.0%
- Community Nutrition & Health Program - 13.2%
- Online Courses - 12.7%
- County Government Training - 10.0%
- Extension Bot - 5.3%
- None of the Above - .07%
General Population Respondents
- Extension Fact Sheets - 25.8%
- Oklahoma Gardening TV Show - 25.0%
- None of the Above - 20.8%
- 4-H Youth Development - 20.0%
- County Educators - 18.3%
- Extension Bot - 16.7%
- Volunteering - 16.7%
- Soil, water, and forage testing - 15.0%
- County Educators - 15.0%
- SunUp TV - 14.2%
- Online Courses - 13.3%
- Community Nutrition & Health Program - 12.5%
- Area Specialists - 12.5%
- Agricultural Programs - 11.7%
- Certifications - 10.8%
- Specialized Regional/State Conferences - 9.2%
- Master Program - 6.7%
- County Government Training - 5.8%
- Family & Consumer Science Programs - 5.0%
- Q13: Interested in Extension Programs but unable/unsure how to enroll?
Extension Network Respondents
- Not Applicable, I don't know/do - 3.3%
- No - 58.8%
- Yes - 38.0%
General Population Respondents
- Not Applicable, I don't know/do - 21%
- No - 39.7%
- Yes - 39.3%
- Q14: Aware of Extension Office in your County?
Extension Network Respondents
- No - 3.4%
- Yes - 96.6%
General Population Respondents
- No - 54.2%
- Yes - 45.8%
- Q15: Interact with Extension Office in your County?
Extension Network Respondents
- No - 6.3%
- Yes - 93.7%
General Population Respondents
- No - 60.7%
- Yes - 39.3%
- Q16: Who you've interacted with within Extension Office in your county?
Extension Network Respondents
- Educator - 69.5%
- Administrative Office Assistants - 50.4%
- Area/district specialist - 47.9%
- Volunteers - 43.4%
- State Specialist/Faculty - 34.4%
- Other - 6.5%
General Population Respondents
- Other - 14.5%
- Volunteers - 14.5%
- Educator - 10.0%
- Administrative Office Assistants - 9.0%
- State Specialist/Faculty - 7.2%
- Area/district specialist - 6.7%
- Q17-1: Rate for ease of use/access: Office Location
Extension Network Respondents
- Very Poor - 0.9%
- Poor - 3.5%
- Average - 17.7%
- Good - 36.3%
- Excellent - 41.6%
General Population Respondents
- Very Poor - 1.5%
- Poor - 1.8%
- Average - 23.6%
- Good - 42.5%
- Excellent - 30.5%
- Q17-2: Rate for ease of use/access: Office Hours
Extension Network Respondents
- Very Poor - 0.2%
- Poor - 0.9%
- Average - 19.8%
- Good - 44.8%
- Excellent - 34.3%
General Population Respondents
- Very Poor - 1.1%
- Poor - 1.5%
- Average - 27.6%
- Good - 46.9%
- Excellent - 22.9%
- Q17-3: Rate for ease of use/access: Personnel Availability
Extension Network Respondents
- Very Poor - 0.5%
- Poor - 3.9%
- Average - 17.6%
- Good - 39.1%
- Excellent - 38.8%
General Population Respondents
- Very Poor - 0.7%
- Poor - 1.8%
- Average - 28.4%
- Good - 41.1%
- Excellent - 28.0%
- Q17-4: Rate for ease of use/access: Personnel Responsiveness
Extension Network Respondents
- Very Poor - 0.7%
- Poor - 3.2%
- Average - 15.2%
- Good - 31.6%
- Excellent - 49.3%
General Population Respondents
- Very Poor - 0.7%
- Poor - 1.1%
- Average - 24.7%
- Good - 44.0%
- Excellent - 29.5%
- Q18: Frequency of Reading Extension Material?
Extension Network Respondents
- Never - 0.3%
- Very Rarely - 4.6%
- Rarely - 6.4%
- Occasionally - 39.7%
- Frequently - 28.1%
- Very Frequently - 18.1%
General Population Respondents
- Never - 37.5%
- Very Rarely - 16.7%
- Rarely - 16.2%
- Occasionally - 22.0%
- Frequently - 5.7%
- Very Frequently - 2.0%
- Q19: Ability to Provide Research-Based Information?
Extension Network Respondents
- Very Poor - 0.7%
- Poor - 2.5%
- Average - 13.6%
- Good - 42.5%
- Excellent - 40.7%
General Population Respondents
- Very Poor - 1.2%
- Poor - 1.7%
- Average - 30.8%
- Good - 44.8%
- Excellent - 21.5%
- Q20: Frequency of Referring others to Extension?
Extension Network Respondents
- Never - 3.0%
- Very Rarely - 4.6%
- Rarely - 6.4%
- Occasionally - 39.7%
- Frequently - 28.1%
- Very Frequently - 18.1%
General Population Respondents
- Never - 37.5%
- Very Rarely - 16.7%
- Rarely - 16.2%
- Occasionally - 22.0%
- Frequently - 5.7%
- Very Frequently - 2.0%
- Q21: Least Preferred Methods of Receiving Information?
Extension Network Respondents
- Podcasts, audio recordings - 56.8%
- Phone Calls - 49.7%
- Social Media (Facebook, Instagram, TikTok, X etc.) - 41.9%
- Online Meetings/workshops (example: zoom) - 40.6%
- Online Courses, self-led - 40.2%
- Text massaging - 39.8%
- Online courses, with instructor (example: zoom class) - 38.5%
- TV Programs - 30.1%
- Newsletters, hardcopy (example: print, mailed) -26.1%
- Online Videos (example: YouTube) - 23.6%
- Written Fact Sheets available in hardcopy (example printed) - 17.3%
- In-person, County office visit/consultation - 16.0%
- Newsletter, online (example: email) - 14.9%
- Combination in-person and online - 14.5%
- Email - 13.7%
- Online Resources (publications, reports) - 11.6%
- In-Person Meetings/Workshop/classes - 8.4%
- Written Fact Sheets available online (example: pdf's, website based) - 7.6%
- Other - 0.4%
General Population Respondents
- Phone Calls - 51.33%
- Podcasts, audio recordings - 39.50%
- Social Media (Facebook, Instagram, TikTok, X etc.) - 35.67%
- In-Person Meetings/Workshop/classes - 32.33%
- Online Meetings/workshops (example: zoom) - 31.0%
- Text massaging - 30.50%
- TV Programs - 28.83%
- Newsletters, hardcopy (example: print, mailed) -28.67%
- In-person, County office visit/consultation - 27.67.%
- Written Fact Sheets available in hardcopy (example printed) - 25.83%
- Written Fact Sheets available online (example: pdf's, website based) - 24.83%
- Online courses, with instructor (example: zoom class) - 24.50%
- Newsletter, online (example: email) - 22.67%
- Combination in-person and online - 22.33%
- Online Videos (example: YouTube) - 20.00%
- Online Courses, self-led - 19.00%
- Online Resources (publications, reports) - 17.33%
- Email - 16.83%
- Other - 1.17%
- Q21: Most Preferred Methods of Receiving Information?
Extension Network Respondents
- In-Person Meetings/Workshop/classes - 63.3%
- Written Fact Sheets available online (example: pdf's, website based) - 49.5%
- In-person, County office visit/consultation - 48.4%
- Email - 33.1%
- Newsletter, online (example: email) - 32.9%
- Online Resources (publications, reports) - 30.8%
- Online Videos (example: YouTube) - 29.1%
- Social Media (Facebook, Instagram, TikTok, X etc.) - 25.6%
- TV Programs - 25.2%
- Combination in-person and online - 24.3%
- Written Fact Sheets available in hardcopy (example printed) - 23.7%
- Online Courses, self-led - 20.8%
- Newsletters, hardcopy (example: print, mailed) - 20.3%
- Text massaging - 17.0%
- Online courses, with instructor (example: zoom class) - 14.5%
- Phone Calls - 14.3%
- Podcasts, audio recordings - 11.3%
- Online Meetings/workshops (example: zoom) - 10.1%
- Other - 0.2%
General Population Respondents
- Online Videos (example: YouTube) - 38.83%
- Email - 36.83%
- Online courses, with instructor (example: zoom class) - 32.83%
- Online Courses, self-led - 32.67%
- Text massaging - 32.17%
- Social Media (Facebook, Instagram, TikTok, X etc.) - 30.50%
- In-Person Meetings/Workshop/classes - 30.17%
- Online Resources (publications, reports) - 29.17%
- TV Programs - 27.00%
- Written Fact Sheets available online (example: pdf's, website based) - 26.83%
- Combination in-person and online - 26.17%
- In-person, County office visit/consultation - 26.17%
- Newsletter, online (example: email) - 24.67%
- Written Fact Sheets available in hardcopy (example printed) - 23.83%
- Online Meetings/workshops (example: zoom) - 23.33%
- Newsletters, hardcopy (example: print, mailed) - 22.83%
- Phone Calls - 19.5%
- Podcasts, audio recordings - 15.67%
- Other - 0.83%
- Q22: Importance of Continuing to Support?
Extension Network Respondents
- Soil, water, and forage testing - 4.56%
- County Extension Office - 4.56%
- 4-H Youth Development - 4.54%
- County Educators - 4.48%
- Agricultural Programs - 4.45%
- Extension Fact Sheets - 4.35%
- Area Specialists - 4.35%
- Master Programs - 4.21%
- Volunteering - 4.14%
- Community Nutrition & Health Programs - 4.08%
- Family & Consumer Science Programs - 4.07%
- Certifications - 3.99%
- Oklahoma Gardening TV Show - 3.90%
- Online Courses - 3.86%
- County Government Training - 3.79%
- Specialized Regional\State Conferences - 3.75%
- SunUp TV - 3.60%
- Extension Bot - 3.17%
- None of the Above - 2.99%
General Population Respondents
- Soil, water, and forage testing - 4.12%
- 4-H Youth Development - 4.12%
- Agricultural Programs - 4.09%
- Certifications - 4.07%
- Community Nutrition & Health Programs - 4.02%
- Master Programs - 3.98%
- County Educators -3.96%
- County Extension Office - 3.94%
- County Government Training - 3.92%
- Online Courses - 3.91%
- Family & Consumer Science Programs - 3.89%
- Area Specialists - 3.89%
- Volunteering - 3.88%
- Extension Fact Sheets - 3.81%
- Specialized Regional\State Conferences - 3.63%
- Oklahoma Gardening TV Show - 3.59%
- Extension Bot - 3.42%
- SunUp TV - 3.31%
- None of the Above - 2.76%
- Q23: Importance of Extension office in your county?
Extension Network Respondents
- Very Unimportant - 13.8%
- Unimportant - 1.5%
- Neither unimportant nor important - 3.0%
- Important - 16.9%
- Very important - 64.8%
General Population Respondents
- Very Unimportant - 3.0%
- Unimportant - 3.8%
- Neither unimportant nor important - 20.8%
- Important - 45.2%
- Very important - 27.2%
- Q24: Areas/Topics for desired growth/expansion in next 5 years?
Extension Network Respondents
- Gardening
- Program
- County
- Class
- Agriculture
- Youth
- Food
- Plant
- Health
- Community
General Population Respondents
- Agriculture
- Gardening
- Farming
- None
- Education
- Nothing
- Community
- Garden
- Test area
- Crop
- Q25: New/different areas for useful/valuable modernization in Extension?
General Population Respondents
- Nothing
- Online
- Program
- Agriculture
- Technology
- Gardening
- Health
- Development
- Oklahoma
- None
Extension Network Respondents
- Program
- Class
- County
- People
- Extension
- Technology
- Information
- Area
- Online
- Better
- Q26: Reached out to Extension in Past 5 Years?
Extension Network Respondents
- No - 17.9%
- Yes - 82.1%
General Population Respondents
- No - 79.8%
- Yes - 20.2%
- Q27: Rate Experience with Extension?
Extension Network Respondents
- Extremely dissatisfied - 1.2%
- Somewhat dissatisfied - 3.0%
- Neither satisfied nor dissatisfied - 3.7%
- Somewhat satisfied - 22.4%
- Extremely satisfied - 69.7%
General Population Respondents
- Extremely dissatisfied - 0.8%
- Somewhat dissatisfied - 1.7%
- Neither satisfied nor dissatisfied - 17.4%
- Somewhat satisfied - 34.7%
- Extremely satisfied - 45.5%
- Q28: Rate 'OSU helped me solve a problem…'
Extension Network Respondents
- Strongly disagree - 1.4%
- Somewhat disagree - 0.9%
- Neither satisfied nor disagree - 8.9%
- Somewhat agree - 23.8%
- Extremely agree - 65.0%
General Population Respondents
- Extremely dissatisfied - 0.8%
- Somewhat dissatisfied - 5.8%
- Neither satisfied nor dissatisfied - 15.7%
- Somewhat satisfied - 37.2%
- Extremely satisfied - 40.5%
- Q29: Likelihood of Future Participation in Extension Services in Next 5 Years?
Extension Network Respondents
- County Extension Office - 4.56%
- Fact Sheets - 4.39%
- Soil, water, and forage testing - 4.25%
- County Educators - 4.18%
- Area Specialists - 3.90%
- Oklahoma Gardening - 3.75%
- Volunteering - 3.72%
- Water programs - 3.72%
- Horticulture or small farms programs - 3.70%
- Master Programs - 3.70%
- Community development programs - 3.66%
- Ag Programs - 3.64%
- Disaster preparedness, recovery, and mitigation - 3.62%
- 4-H Youth Development - 3.62%
- Forestry and natural resource programs - 3.57%
- Online Courses - 3.54%
- Food Safety programs - 3.54%
- Certifications - 3.51%
- Family & Consumer Science Programs - 3.47%
- Community Nutrition & Health Programs - 3.40%
- Regional/State Conferences - 3.35%
- SunUp TV - 3.31%
- Small Business Development - 3.20%
- OSU Extension Bot - 2.87%
General Population Respondents
- Food Safety programs - 3.40%
- Disaster preparedness, recovery, and mitigation - 3.35%
- Online Courses - 3.33%
- Volunteering - 3.27%
- Water programs - 3.26%
- Community Nutrition & Health Programs - 3.25%
- Soil, water, and forage testing - 3.23%
- County Extension Office - 3.22%
- Fact Sheets - 3.21%
- Community development programs - 3.20%
- Small Business Development - 3.18%
- Forestry and natural resource programs - 3.17%
- Horticulture or small farms programs - 3.14%
- Certifications - 3.13%
- Oklahoma Gardening - 3.11%
- Area Specialists - 3.08%
- Family & Consumer Science Programs - 3.07%
- 4-H Youth Development - 3.05%
- County Educators - 4.05%
- Ag Programs - 3.05%
- Master Programs - 2.96%
- Regional/State Conferences - 2.82%
- OSU Extension Bot - 2.81%
- SunUp TV - 2.74%
- Q30: Most Important Groups for Extension Focus in Next 5 Years?
Extension Network Respondents
- Youth - 64.33%
- Farmers/ranchers - 56.67%
- Rural Communities - 50.55%
- Senior citizens - 29.98%
- Limited resources & under served communities - 28.45%
- Food consumers - 28.01%
- Urban Communities - 16.19%
- Policy Markers - 13.13%
- Entrepreneurs - 12.69%
General Population Respondents
- Youth - 55.00%
- Farmers/ranchers - 49.67%
- Rural Communities - 39.83%
- Limited resources & under served communities - 36.33%
- Senior citizens - 32.33%
- Food consumers - 28.67%
- Entrepreneurs - 21.17%
- Urban Communities - 19.50%
- Policy Markers - 17.50%
- Q31: Most Important Areas for Extension Focus in Next 5 Years?
Extension Network Respondents
- Youth development - 62.01%
- Locally grown foods (including small farms) - 60.92%
- Natural Resource & Environmental Stewardship - 44.54%
- Health & Wellness - 39.3.%
- Food Safety, processing, preparation, & preservation - 35.81%
- Disaster preparedness & recovery - 34.06%
- Commercial Ag Production - 24.24%
- STEM Programming - 24.24%
- Lawn/Garden Care - 24.24%
- Small business management - 20.96%
- Workforce Development - 14.41%
- Policy & assessment evaluation - 7.86%
- Coalition building - 6.33%
General Population Respondents
- Health & Wellness - 48.67.%
- Locally grown foods (including small farms) - 47.33%
- Youth development - 46.83%
- Disaster preparedness & recovery - 46.67%
- Food Safety, processing, preparation, & preservation - 41.83%
- Natural Resource & Environmental Stewardship - 41.00%
- Workforce Development - 26.50%
- STEM Programming - 24.50%
- Small business management - 22.33%
- Commercial Ag Production - 18.17%
- Lawn/Garden Care - 17.83%
- Policy & assessment evaluation - 11.50%
- Coalition building - 6.83%
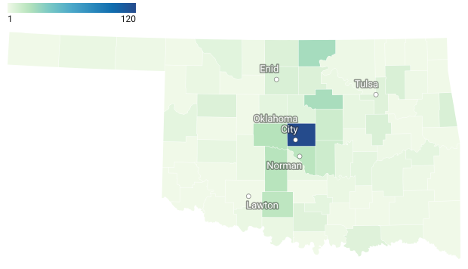
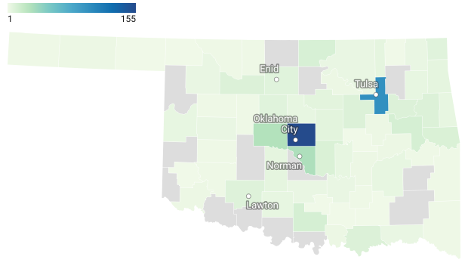
- Q32 & Q33 County Distribution
Extension Network County Distribution

N=486
Created with Data wrapper
General Population County Distribution
N=600
Created with Data wrapper
- Q34: Age Distribution?
Extension Network Respondents
- 18-24 years - 1.9%
- 25-34 years - 6.0%
- 35-44 years - 15.9%
- 45-54 years - 17.8%
- 55-64 years - 23.4%
- 65-74 years - 23.9%
- 75+ years - 11.0%
General Population Respondents
- 18-24 years - 12.8%
- 25-34 years - 13.8%
- 35-44 years - 23.3%
- 45-54 years - 17.8%
- 55-64 years - 14.5%
- 65-74 years - 12.5%
- 75+ years - 5.2%
- Q35: Distribution of Respondents Race/Ethnicity
Extension Network Respondents
- White - 85.27%
- American Indian or Alaska Native - 9.88%
- Other - 2.91%
- Black or African American - 1.55%
- Native Hawaiian or Pacific Islander - 0.19%
- Asian - 0.19%
General Population Respondents
- White - 75.15%
- American Indian or Alaska Native - 12.50%
- Other - 8.33%
- Black or African American - 2.62%
- Native Hawaiian or Pacific Islander - 1.23%
- Asian - 0.15%
- Q36: Are you Hispanic or Latino/a in Origin?
Extension Network Respondents
- No - 96.2%
- Yes - 3.8%
General Population Respondents
- No - 92.8%
- Yes - 7.2%
- Q37: Gender Distribution?
Extension Network Respondents
- Prefer not to say - 2.52%
- Male - 34.3%
- Female - 63.2%
General Population Respondents
- Prefer not to say - 0.5%
- Male - 47.5%
- Female - 52.0%
- Q38: Income Distribution?
Extension Network Respondents
- Less than $49.999 - 13.3%
- $50,000 - $99,999 - 37.3%
- $100,000 - $149,000 - 28.3%
- More than $150,000 - 21.1%
General Population Respondents
- Less than $49.999 - 52.3%
- $50,000 - $99,999 - 32.9%
- $100,000 - $149,000 - 10.4%
- More than $150,000 - 4.3%
- Q39: Household Size?
Extension Network Respondents
- 1 - 14.1%
- 2 - 48.8%
- 3 - 17.7%
- 4 - 11.9%
- 5 - 5.3%
- 6 - 1.5%
- 8 - 0.4%
- 10 -0.2%
General Population Respondents
- 1 - 18.8%
- 2 - 30.5%
- 3 - 18.0%
- 4 - 17.5%
- 5 - 9.7%
- 6 - 3.2%
- 7 - 0.5%
- 8 - 0.8%
- 10 - 1.0%
- Q40: Children Under 18 in Household?
Extension Network Respondents
- No - 74.4%
- Yes - 25.6%
General Population Respondents
- No - 61.8%
- Yes - 38.2%
- Q41: Highest Level of Education?
Extension Network Respondents
- Less than high school - 0.2%
- High school graduate - 5.6%
- Some college - 12.1%
- 2 year degree - 7.1%
- 4 year degree - 37.8%
- Professional degree - 32.6%
- Doctorate - 4.6%
General Population Respondents
- Less than high school - 4.3%
- High school graduate - 28.0%
- Some college - 28.7%
- 2 year degree - 9.5%
- 4 year degree - 19.5%
- Professional degree - 8.3%
- Doctorate - 1.7%
- Q42: Additional Comments?
Extension Network Respondents
- Extension
- County
- Office
- OSU
- Programs
- People
- Educator
- Agent
- Love
- master
- Work