Woods County Agricultural Newsletter, November 2021
Monday, November 1, 2021
Improving Nitrogen Management
Brian Arnall
Precision Nutrient Management Extension Specialist
The basics for nitrogen (N) fertilizer rate determination can be described in a mechanistic
approach by the Stanford Equation NFert = ( NCrop – NSoil ) / Neff. This equations states that the N fertilizer rate is equal to the amount of nitrogen
taken up by the crop minus the amount of nitrogen supply by the soil, divided by the
efficiency of the nitrogen fertilizer used.
There are nitrogen application approaches which utilize averages collected over diverse
environments to create accurate N rate recommendations. The best example of this is
the yield goal rules of thumb such as wheats 2.0 lbs N per yield goal bushel minus
soil test nitrate. This method and others like it provide an accurate N rate with
a slight probability of yield loss. However, the recommendation is often highly imprecise.
Meaning that if I apply the method to 100 fields the average will be spot on, however
if I look at the performance of the recommendation on a single field, I will likely
be disappointed.
When we apply nitrogen based on these broad recommendations, the rate 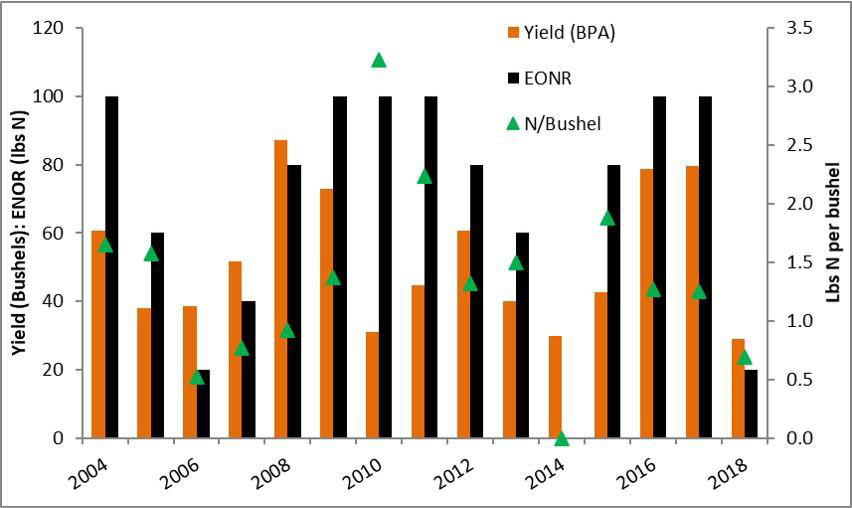 prescribed will maximize yield 90-95% of the time. For example, take the data presented
in Figure 1. Over fifteen years of the long-term winter wheat fertility study near
Lahoma, Oklahoma the average pounds of N per bushel to reach economic optimum nitrogen
rate (EONR) was 1.6, however if 2.0 of N was applied per bushel yield would have been
maximized 13 out of the 15 years. While 2.0 lbs. of N per bushel would have been quite
accurate for maximizing yield, it would be highly imprecise as over the 15 years optimum
pounds of N per bushel ranged from 0.0 to 3.2.
prescribed will maximize yield 90-95% of the time. For example, take the data presented
in Figure 1. Over fifteen years of the long-term winter wheat fertility study near
Lahoma, Oklahoma the average pounds of N per bushel to reach economic optimum nitrogen
rate (EONR) was 1.6, however if 2.0 of N was applied per bushel yield would have been
maximized 13 out of the 15 years. While 2.0 lbs. of N per bushel would have been quite
accurate for maximizing yield, it would be highly imprecise as over the 15 years optimum
pounds of N per bushel ranged from 0.0 to 3.2.
The trick to improving your N rate recommendation closer to a precise and accurate
system is to obtain representative site-specific values for the Stanford Equation
NFert = (NCrop – NSoil) / Neff.
Looking at the 15-year long-term data above the yields range from a low of 27 to a
high of 88 bushels. Of those 15 years, I personally planted multiple years, usually
sometime in October, and many of those years while sowing I could have guessed a range
of 55-60 bushel, which just happened to be just above the 15-year average. It was
not until February and March when the yield potential really starts to express itself.
Why, well there is a lot of weather between October to March, with a lot of environmental
positive and negative impacts on that final grain yield. February-March is the best
timing to go out with approaches, models, or techniques to estimate yield potential
for N rate recs.
While soil testing is valuable, pre-plant soil samples for N are just a snapshot in
time. The nitrogen cycle, will roar-on well after the soil sample is collected. Organic
matter (OM) is the central component of this cycle and drives availability of NH4
and NO3 in the system. For each 1% OM in the top 6″ of the soil there is approximately
1000 lbs of organically bound N. The amount of N going into and out of OM pool is
driven by C:N ratio of residues, soil temperature and soil moisture. Our inability
to predict long term weather patterns is the greatest factor limiting our ability
to predict future availability of NSoil.
Consider how the approach follows Stanford’s mechanistic approach to N management.
First the Yield Potential component is related to NCrop. In effect researchers have built models that can correlate the Normalized Difference
Vegetation Index (NDVI) collected from a sensor, such as the GreenSeeker, with the
crops biomass and chlorophyll content. If given the number of days the crop has been
growing it is possible to use the NDVI collected from the crop as a tool to predict
final grain yield.
The closer the wheat gets to hollow stem, or the corn gets to tassel, the better the prediction becomes because more “environmental influence” has happen. While post sensing stresses that can bring down final grain yield, the models do quite a good job on predicting final grain yield in-season. This results in a much more site specific value for NCrop.
The final factor in the equation is NSoil, which I will argue is at least as important as NCrop. It would be nice to have a weather station on every field, but we have found the
use of a reference strip, high N or low N, really provides an site specific estimate
the of nitrogen the crop has access to. If the high N reference (N-Rich) strip is
showing up that means the remainder of the field is N deficient. This may be due to
losses or lack of mineralization, either way more N is needed. If the N-Rich strip
is not evident then the crop is finding enough N outside of the reference strip to
support its current growth. This could be that residual N or mineralization is high,
or it could mean that crop growth and therefore N demand is low. Having the N check
strip in each field allows for a season long evaluation. We can use the NDVI to characterize
how big or little of a response we have to N. We call this the Response Index (RI).
An RI of 1.8 means that we could increase yield by 80% if we add adequate N, if the
RI is 1.05 then we are looking at a potential increase of 5%.
Spike in Fertilizer Cost Impacting Farmers
Trent Milacek
Area Ag Economics Specialist
Henry Hub Natural Gas futures traded at $5.410/MMBtu concluding a spike 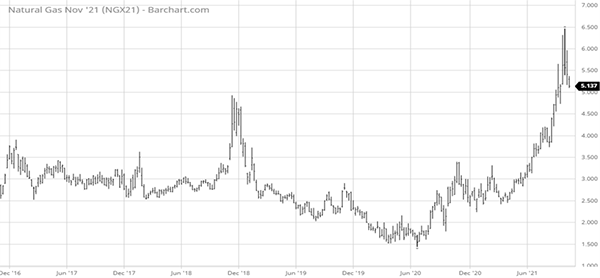 in prices that reached as high as $6.500/MMBtu. These high natural gas prices are
troubling for producers due to the increased input cost of creating nitrogen fertilizer.
Anhydrous Ammonia has been quoted at more than $1,000/ton which is over 3 times as
high as it has been in previous years. The USDA fertilizer index (using a 2011 Base)
in August increased to 84 from 82.4 in July. A year ago that value was 65.3.
in prices that reached as high as $6.500/MMBtu. These high natural gas prices are
troubling for producers due to the increased input cost of creating nitrogen fertilizer.
Anhydrous Ammonia has been quoted at more than $1,000/ton which is over 3 times as
high as it has been in previous years. The USDA fertilizer index (using a 2011 Base)
in August increased to 84 from 82.4 in July. A year ago that value was 65.3. 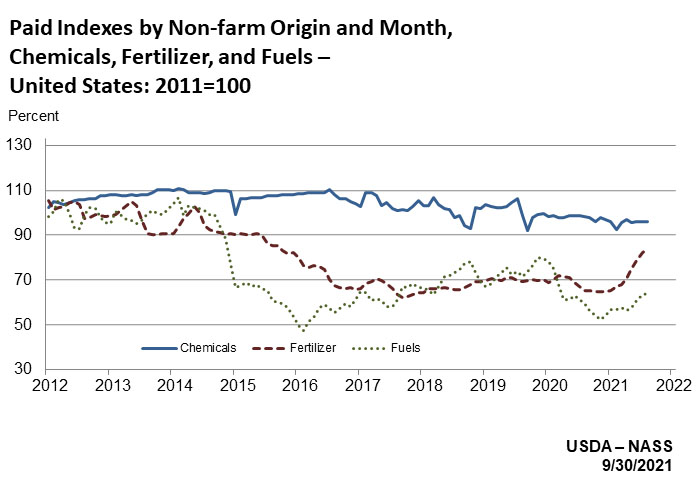
The graph to the right paints a clear picture of increasing fertilizer input costs
to farmers. Crop prices remain good so be critical of fertilizer purchases and ensure
that application is efficient and based on soil tests to minimize financial impact.
OSU Winter Crop School
Student Union, 2nd Floor Ballroom on December 15-16, 2021.
- Early Registration Fee $150
- After November 29, 2021 Registration fee is $225
- No Refunds after November 29, 2021
- Full refunds of online payment will be given if conference cancelled
- Registration includes: Breaks, Thursday Breakfast at the Ranchers club, 2 lunches, and Wednesday night reception.
Updates will be sent via PSS Extension News List-serve - email
Brian Arnall to be added.
Follow us on Facebook
Follow us on Twitter
For registration questions contact Ag Conferences
Phone: 405-744-6489
Email: agconferences@okstate.edu
Greg Highfill
Extension Educator
Agriculture/4-H Youth
Woods County
Phone: 580-327-2786
Fax: 580-327-2791
Cell: 580-430-6125
E-mail: greg.highfill@okstate.edu
The Woods County Agriculture Newsletter is printed by the Woods County Cooperative
Extension Service, Phone: 580-327-2786. This is one way of conveying educational information
to agriculture producers and interested citizens. This publication is printed and
issued by Oklahoma State University as authorized by the Vice President, Dean, and
Director of the Division of Agricultural Sciences and Natural Resources and has been
prepared and distributed at a cost of $11.24 for 281 copies.
Oklahoma State University, U.S. Department of Agriculture, State and Local Governments
Cooperating. The Oklahoma Cooperative Extension Service offers its programs to all
eligible persons regardless of race, color, national origin, gender, age, religion,
disability, or status as a veteran, and is an equal opportunity employer.