Ag Insights September 2025
Monday, September 1, 2025
Wheat and Canola Nitrogen Management
Josh Bushong, Area Extension Agronomist
Low grain prices should force farmers to be extra thoughtful on managing fertility
plans for this year’s winter crops. I’ve received a few questions about how much 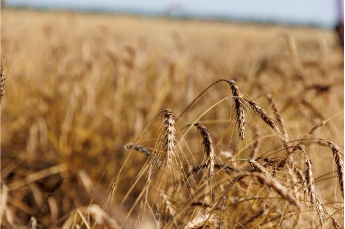 nitrogen should be applied and how much can be applied in-furrow. Forage and grain
yield goals are always driven by nitrogen, but contingent on growing conditions. Luckily,
we have some moisture in the soil profile to favor good wheat pasture.
nitrogen should be applied and how much can be applied in-furrow. Forage and grain
yield goals are always driven by nitrogen, but contingent on growing conditions. Luckily,
we have some moisture in the soil profile to favor good wheat pasture.
Nitrogen (N) is a mobile nutrient and can be lost or become unavailable to plants. Source or type of N fertilizer used can also have a big impact. Different production systems will require more or less nitrogen up front than others. Optimal nitrogen application rates to increase the use efficiency will also vary from year to year and farm to farm.
In a dual-purpose or grazeout wheat system, more N is needed early compared to a grain only system to produce more forage. A grain only system needs about 2 lb N per bu of seed produced, or 80 lb N for a 40 bu grain yield. It takes about 60 lb of N to produce one ton of wheat forage. So in a dual-purpose system, 60-70 lb of N will be needed at planting compared to 30-40 lb of N for a grain only system. The second application of N is typically applied late fall to early spring.
Many grain drills and especially air seeders can apply fertilizer in-furrow directly
with the seed wheat. Farmers with acidic, low pH, soils often use this practice to
apply phosphorus to mitigate some availability issues and aluminum toxicity. To prevent
germination issues, OSU recommends to keep the salt load (N and potassium)
to no more than 30 pounds when sown on 6-8 inch ow spacing in medium to fine textured
soils and 21 pounds on sandy or dry soils. Applying 167 pounds of 18-46-0 would yield
30 pounds of N.
It is not recommended to use fertilizer sources that are high in N and place it directly with the seed as it could cause more seed and seedling injury. When urea (46-0-0) is placed in-furrow it initially converts to ammonia. Ammonia can be toxic to plant roots and reduce seed germination. The risk of injury is higher in drier soils, sandier soils, and in higher pH soils. Field research from KSU has shown stand reductions of 32% when 30 pounds of N from urea was applied in-furrow. This resulted in a 14% grain yield reduction.
For grain only producers, the old rule of thumb of 2 lb N per bushel is a good starting
place but that might be an overestimation. When looking at more than 15 years of field
trial data from the OSU North Central Research Station near Lahoma, the optimum pounds
of N per bushel ranged from 0 to 3.2. The average
pounds of N per bushel to reach an economic optimum N rate was closer to 1.6, however
if 2 pounds per bushel was applied the grain yield would have been maximized 13 out
of those 15 years.
Split application is often a best management practice in canola as well. The canola
crop needs enough N to produce a healthy crop to better withstand the winter. Too
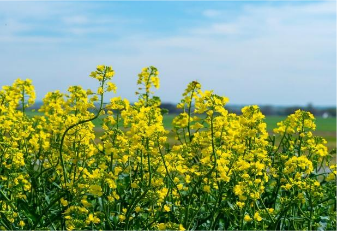 much N in the fall or at planting can result in excessively large plants going into
winter. Excessive N and prolonged warm growing conditions can lead to winter survival
issues if the plants growing point starts to vertically elongate. Canola needs about
2.5 lb N per bushel of seed yield, or 100 lb N for a 40 bu yield.
much N in the fall or at planting can result in excessively large plants going into
winter. Excessive N and prolonged warm growing conditions can lead to winter survival
issues if the plants growing point starts to vertically elongate. Canola needs about
2.5 lb N per bushel of seed yield, or 100 lb N for a 40 bu yield.
It is almost impossible to determine the total N needs at the time of planting to
maximize grain yields. Topdressing N on wheat and canola is a good management practice
because it decreases the risk of N losses as well as benefiting from influencing late
season N recommendations based on the potential yield of
the crop. Topdress application rates can be impacted by current expectations of the
crop and weather forecasts. Basically, estimating the yield potential becomes more
accurate as the season progresses.
Using tools at hand can dramatically influence N recommendations. Applying N-Rich strips to wheat in early fall can help estimate N demands throughout the season for both dual-purpose and grain-only systems. This management tool can assist in determining N deficiencies or sufficiency.
The N-rich strips can be as simple as hand spreading a few cups of urea or more technical with using custom built applicators on UTV’s or tractors. The strips can simply be used to visually determine if there is enough N or not. If the strip cannot be seen, then there is a low likelihood of getting a response to additional N. If the strip can easily be seen, then more N is likely needed.
Contact your local OSU County Extension Office for more information
Using Patch Burning to Adjust Grazing Distribution
Dana Zook, NW OK Area Livestock Specialist
Grazing distribution has long been a challenge for cattle producers. Even with a correct
stocking rate, cattle can “over-use” or “over-graze” some areas of pasture or 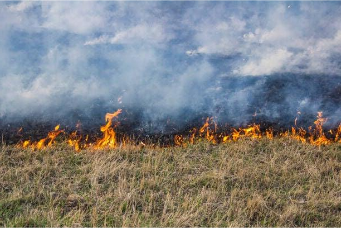 rangeland. To combat unbalanced grazing, producers have historically employed different
management methods to encourage cattle to graze more evenly. These methods include
adding infrastructure (fencing or water), enticements (mineral or salt), and additional
fertility (to increase forage quality). Different livestock species (goats for instance)
have also been used to target steep and brushy areas that cattle would typically avoid.
rangeland. To combat unbalanced grazing, producers have historically employed different
management methods to encourage cattle to graze more evenly. These methods include
adding infrastructure (fencing or water), enticements (mineral or salt), and additional
fertility (to increase forage quality). Different livestock species (goats for instance)
have also been used to target steep and brushy areas that cattle would typically avoid.
Prescribed burning has been extensively investigated by specialists from the Oklahoma
State Natural Resource Ecology and Management Department as a tool to manage Eastern
red ceder. In the past several decades, those specialists took burning a step further
to look at ways producers could get the benefits of burning while also gaining higher
quality forages for grazing. This management style has become known as Patch Burn
Grazing. This technique burns a portion of a grazing area and allows cattle and other
livestock to select what forage they prefer from the burned or unburned areas. Regrowth
following a burn is much higher than forage
in unburned areas and research has proven that cattle and other livestock prefer the
regrowth in the burned area. When targeting these newly burned areas, cattle are grazing
less in unburned areas, allowing a stockpile of forage to grow.
Patch burn grazing is now being looked at as another management strategy to adjust grazing distribution. In a study conducted by Kathrine Hale, Dr. Laura Goodman and others at the Klemme Research Station south of Clinton, patch burning was used to target under grazed areas of a pasture.
In this study, GPS collars were put on cattle and grazing distribution was analyzed in 3 pastures (100-200 acres each) for the first year without fire. This data was then utilized to identify portions of the pasture that cattle were avoiding. Then 4 areas were selected from these under-grazed areas for patch burning.
Two patches were burned in March, and the remaining two patches were burned in June. Forage samples were collected and analyzed every two months for forage quality comparing burn and unburned areas. The results of this study didn’t find a difference in the season of burn (March vs. June), but overall forage consistently stayed high quality (8-15% Crude Protein) for about 5 months. In my mind, it is especially important to note that June burns would provide significantly higher quality forage than unburned areas into November, decreasing the need for early fall protein supplements.
By using fire, grazing distribution was totally changed in these pastures. Using this GPS tracking, they identified that the previously avoided areas were now targeted by the cattle, allowing previously over-grazed areas to recover.
One question that people have when discussing patch burn grazing is if potential damage to the plant occurs when grazing so soon after fire. Based on research, we know that burned areas are highly targeted by livestock for approximately 3 months following the burn. The burned patch is also only typically burned in a rotation every 3 to 4 years. This short period of time isn’t detrimental to their overall growth. Also, these plants are highly adapted to fire due to a long history of burning in the prairie states.
Due to many natural disasters over the years, fire isn’t always thought about in the best light. However, I think it’s important to come around to the difference between a prescribed fire and a wildfire. Good research shows the benefits of a well-planned burn for plant quality, species diversification, wildlife, and livestock production. If you would like more information about patch burn grazing, check out resources at OSU Natural Resources Extension or find them on Facebook @OklahomaLands
Through Markets, Smart Choices: Why Dual-Purpose Deserves a Look
Alberto Amador, Area Ag Economics Specialist | W. Area Ag Economics Specialist
This year is running fast, just a few weeks ago, we were in the middle of the wheat harvest. However, August is here, so it’s crucial time to make decision about the upcoming wheat production system. It’s not an easy choice, because there are multiple factors that influence the outcome, results, and profitability. Therefore, it’s important to look to the future and analyze the broader context.
In the global wheat context, both production and consumption are expected to increase
by 1% and 0.6% respectively, compared to the last crop year. Trade projections show
slight changes, with lower imports and nearly unchanged exports level. However, exports
have decreased compared from last month although U.S
and Russia exports increased. The projections suggest that the total ending stocks
will decline by 1%.
The domestic total wheat expectation in the current crop year shows higher level of beginning stocks, greater supply, and an increase in exports and total consumption compared to a year ago. Since last month, exports have risen 25%, reaching 850 million bushels due to fast pace of sales, large production, and competitive prices. However, the expected average marketing year price is $5.4 per bushel.
Regarding hard red winter wheat, the expected total domestic supply is 1,157M bushels, the highest in the last three years, despite an expected 3% reduction in production, with higher beginning stock offsetting the decline. The total projected consumption increases 3% from year ago, being feed and residual the most significant increase at 42%. Finally, hard red winter wheat exports are projected to increase by 26% reaching 275M bushels with Mexico and Central America being crucial customers.
On the other hand, the cattle and beef context is different. Cattle supply is tight due to a decrease in calf-crop, placements and marketing in feedlots. At the same time, beef demand remains solid despite high prices. The forecast for the last two quarters of 2025 and the first 2 quarters of 2026 indicates that demand levels will stay at similar levels or decrease slightly, allowing prices to remain high.
Given the current situation, the expected grain price for 2025/26, $4.50, is not appealing for “grain only”. The combination of these factors makes the “Dual-Purpose” system more attractive and more “profitable” for wheat producers. However, external conditions such as soil moisture and temperature must be adequate to allow planting in the recommended window (late August to middle September) to obtain enough forage. Additionally, a solid business plan and good management are necessary to reduce risks and use available resources efficiently to achieve the best results.
The following table shows the possible value of gain (VOG) for different grazing periods and Initial weights after. The calculation is based on expected prices at the beginning and end of the grazing period, an average daily gain of 2 pounds, and adjusted stocking rate for each scenario. The values on each scenario are possible VOG per pound minus the wheat pasture grazing cost per pound, which is calculated based on a cost of $80 per acre. To obtain profit, it’s necessary to also calculate the extra costs associated with the steers (labor, feed, hay, medicine, etc…) on a per pound basis.
| Beginning Weight | Gaining 240 lbs. 120 grazing days | Gained 200 lbs. 100 grazing days | Gained 180 lbs 90 grazing days | Gained 160 lvs. 80 grazing days |
|---|---|---|---|---|
| 400 | $1.27 | $1.57 | $1.50 | $1.47 |
| 450 | $1.17 | $1.25 | $1.05 | $0.92 |
| 500 | $1.22 | $1.22 | $1.23 | $1.34 |
| 550 | $1.10 | $1.04 | $1.01 | $0.93 |
| 600 | $1.17 | $1.23 | $1.20 | $1.18 |
| Selling date: 3/10/26 | Selling date: 2/18/26 | Selling date: 2/8/26 | Selling date: 1/29/26 |
To cover the grain costs, I calculated the break-even points to cover variable costs based on the three different yields. Due to variable costs vary from farm to farm depending on factors such as soils test, kind of tillage, use of own or custom machinery, crop insurance and other expenses, the following values are not the same for everybody. The break-even prices at 30, 35, and 40 bushels per acre are $6.08, $5.34, and $4.79, respectively.
Finally, I’d like to emphasize that prices are volatile and can change any time. The
numbers presented were calculated using average value from Western Oklahoma. Additionally,
there is a possibility that feeder cash prices may be higher than the future prices.
For this reason, it’s very important to stay tuned to the markets
and regularly update your business plan. If you have any doubt or need support for
your budget, please don’t hesitate to reach out to your local OSU educator or any
OSU Specialist.