

Cow-Calf Corner |October 19, 2026
Global Beef Trade Update
Derrell S. Peel, Oklahoma State University Extension Livestock Marketing Specialist
The most recent USDA Livestock and Poultry: World Markets and Trade report shows that beef production among major world producers for 2027 is projected at 60.031 million metric tons, down fractionally from 2026 and down 3.7 percent from the peak in 2025. Among major beef producing countries, production is down in Brazil, the U.S., China, the European Union, Australia, Russia and South Africa. Beef production is projected to increase in 2027 in India, Argentina, Mexico and Canada.
Total global beef exports have been mostly steady since 2025 with 2027 projected to be fractionally lower than 2026 at 13.885 million metric tons (Figure 1). This follows a relatively steady increase in the previous decade prior to 2025.
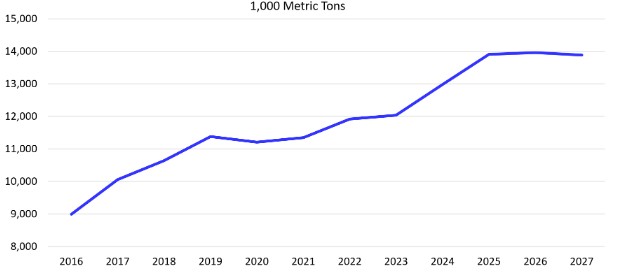 Figure 1. Global Beef Exports
Figure 2 shows projected 2027 beef exports for major exporting countries. Brazil is the largest beef exporter, accounting for 29.5 percent of total with Australia at number two with 16.1 percent and India in third place with a 14.0 percent share of total beef exports. Exports from India includes meat from water buffalo, known as carabeef. The U.S. is fourth with 7.6 percent followed by Argentina at 5.8 percent of total beef exports. Of the top ten beef exporters, the remaining six countries all account for less than five percent of total beef exports and include New Zealand, Canada, the E.U., Uruguay, Mexico and Paraguay.
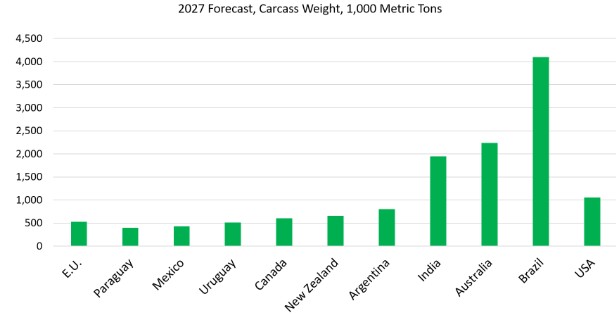 Figure 2. Beef Exports
Projected 2027 beef imports are heavily concentrated into China/Hong Kong, with 30.4 percent of the global total and the U.S. with 22.5 percent of total beef imports (Figure 3). Next is Japan with a 5.7 percent share and South Korea accounting for 5.0 percent of total beef imports. Smaller beef importing countries include the E.U., the United Kingdom, Chile, Canada, Russia, and Egypt. The top ten beef importers account for 80.0 percent of total global beef imports.
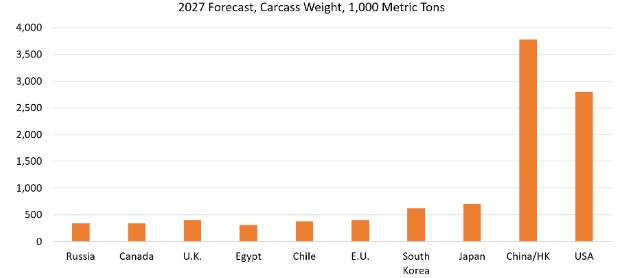 Figure 3. Beef Imports
Beef trade continues to grow and is increasingly important in global beef markets. In 2026, beef exports were 23.2 percent of total global beef production, up from 16.0 percent a decade ago in 2017.
Value of Information
Mark Z. Johnson, Oklahoma State University Extension Beef Cattle Breeding Specialist
Information is increasingly important in marketing cattle of all types. Historically, selling ag commodities has involved moving raw farm products such as grains, livestock and dairy from production to consumption with ag producers acting as price takers. Because ag commodities have been largely interchangeable, individual farmers and ranchers have had little control over market prices.
In regard to the cattle business, documented information about genetic potential, vaccination protocols and backgrounding management have and are proving to be increasingly important to cattle producers interested in moving beyond the status of price takers. Actual marketing of cattle requires a willingness to invest the time and effort to differentiate your cattle and substantiate their distinct value to the next owner. This can be done whether your product marketed is weaned calves, bred commercial heifers, yearlings, registered seedstock, etc. The core goal is to escape commodity style competition by creating unique customer value. It permits your cattle business to influence prices based on the value of the product delivered and you to act as a price maker as opposed to surrendering pricing control to the broader market.
Some examples:
- Oklahoma Quality Beef Network sales (documenting vaccination and backgrounding status of weaned calves) saw an average premium of $65 per head on 500 pounds calves from 2011 – 2022, as compared to commodity price.
- At the time of this writing, there have been 1,000,000 head of feeder cattle sold through the AngusLink marketing program. Last year, those cattle sold at a $20.92 premium per cwt as compared to commodity price. This program is a simple enrollment process available to cow-calf operations using registered Angus bulls allowing producers to communicate the genetic value of their calves at marketing. Genetic Merit Scorecard, a component of AngusLink, documents the genetic potential for postweaning gain and carcass merit for the calf crop, relative to the industry average, allowing buyers to make a more informed decision. More details on AngusLink can be found at angus.org.
- The recent dispersal of the Express Ranches Angus female herd saw approximately 2,400 head of registered Angus females selling at an average value of over $13,000 per head. The volume of information provided included pedigrees, age, pregnancy status, service sires, individual performance information for multiple traits and documentation of genetic potential for over 30 reproductive, growth and carcass traits.
- Sales of commercial bred heifers across the country indicate a strong buyer preference and premiums paid for heifers documented to be AI bred, with known expected calving dates. Documentation of genetic potential of these bred heifers adds additional value.
Feeding Cull Cows to Add Value
Paul Beck, Oklahoma State University Extension Beef Cattle Nutrition Specialist
As we discussed last week, only about 60% of cull beef cows are marketed in the Utility grades (Boning or Breaking Utility) with 20 to 25% in the USDA Cutter and 5 to 15% in the Canner grade. Feeding thin cows to higher BCS before marketing can make a large difference in their value. Beef cutout research (Apple and others 1999 https://doi.org/10.2527/1999.77102610x) indicated that cows in BCS 3 were 33% Boning or Breaking Utility grade while cows in BCS 6 and 7 were 73 and 100% Boning or Breaking Utility. So, body condition of cows at market has a large impact on their value. I calculated the value of cull cows using current cull cow prices, expected weight changes between BCS, and expected changes in cull cow grades. Feeding to add weight and condition of a thin cow from a BCS 3 to 7 can increase her value by over $450.
Research at Texas Tech University (DeClerck et al., 2020) showed that thin cull cows (BCS of 2) can be fed mixed diets in feedlot pens to gain weight and body condition. At the end of the 45-day feeding period cows in a high roughage diet (25% cotton burrs) consumed 32 pounds (DM basis) and gained 5.8 pounds/day requiring 5.5 pounds of feed DM per pound of gain. Cows in the low roughage diet (10% cotton burrs) consumed 30 pounds per day, gained 6.4 pounds per day and required 4.5 pounds of feed per pound of gain. These thin cows gained 3 body-condition scores over the 45 days but consumed large amounts of feed to do it.
Cows do not have to be fed in dry lot to gain weight and body condition, supplementation programs can be fed to cull cows as well. Recent research shows that grazing cull cows supplemented with 0.5% of body weight (4.7 lbs of supplement/day) on pasture gained 126 pounds over 84 days (1.5 pounds/day) while feeding 1% of body weight (9.5 lbs of supplement/day) increased gains to 193 pounds (2.3 pounds per day).
Adding value to thin cull cows can be profitable, but increased sale value is not the same as increased profit. Feed expenses, available forage, cow health, labor, interest, and market risk must all be considered before retaining cows for feeding.
| Item | Total Mixed Rotation | Hay | Pasture |
|---|---|---|---|
| Wheat Pasture | - | - | 3 acres |
| Hay Intake , lbs/day | - | 21 | 5 |
| Feed intake, lbs/day | 30 | 10 | - |
| Gain, lbs/day | 3.8 | 2.0 | 3.2 |
| BCS gain | 2.3 | 1.0 | 2.0 |
| Added value | $326 | $150 | $282 |
| Added cost | $217a | $162b | $188c |
| Return | $109 | -$12 | $94 |
- Cost assumes 40¢ per day yardage and feed cost of $215/ton for a diet consisting of 25% hay, 34% corn, 40% byproducts, and 1% premix.
- Cost assumes 25% hay waste (17 lbs hay consumed), 10¢ per day yardage, supplement cost of $425/ton for 20% cubes, and hay cost of $50/bale.
- Cost assumes $200/acre cost of planting and 60-day grazing period with 3 acres/cow stocking rate
Daily feeding a total mixed diet can be very efficient and cost effective, but requires excellent management, dedicated feeding equipment and facilities that many producers do not have available. Feeding hay and a supplement is easier to manage but does not add as much gain as other feeding programs and may not be cost effective, especially when hay stocks are limited during droughts. Recent rains have boosted the growth of wheat pasture and high prices of calves has made a cow grazing program economically competitive with our normal stocker grazing programs on wheat pasture. Cows can gain rapidly on wheat pasture but require higher stocking rates that growing calves to provide adequate pasture.
Adding value to thin cull cows can be profitable, but increased sale value is not the same as increased profit. Feed expense, available forage, cow health, labor, interest, and market risk must all be considered before retaining cows for feeding.