

Cow-Calf Corner | October 12, 2026
Fall Feeder Market Roundup
Derrell S. Peel, Oklahoma State University Extension Livestock Marketing Specialist
It’s time for the fall run of calves but Oklahoma auction volumes suggest that feeder cattle supplies are limited. Figure 1 shows that weekly auction volumes have been below year ago levels with only one week in the last twelve higher year over year. The total auction volume since July 1 is down 23.2 percent year over year, a decrease of about 78,000 head. The summer market drop and high temperatures might explain reduced volumes in July, August and September but that would imply that delayed marketings should be pushed into fall. Thus far in October, auction volumes have not indicated a strong fall run. This is perhaps more surprising given poor forage conditions due to continuing drought. The most recent pasture and range conditions for Oklahoma show 51 percent in poor to very poor condition. Perhaps larger auction runs are coming yet this fall…or maybe the cattle just aren’t there.
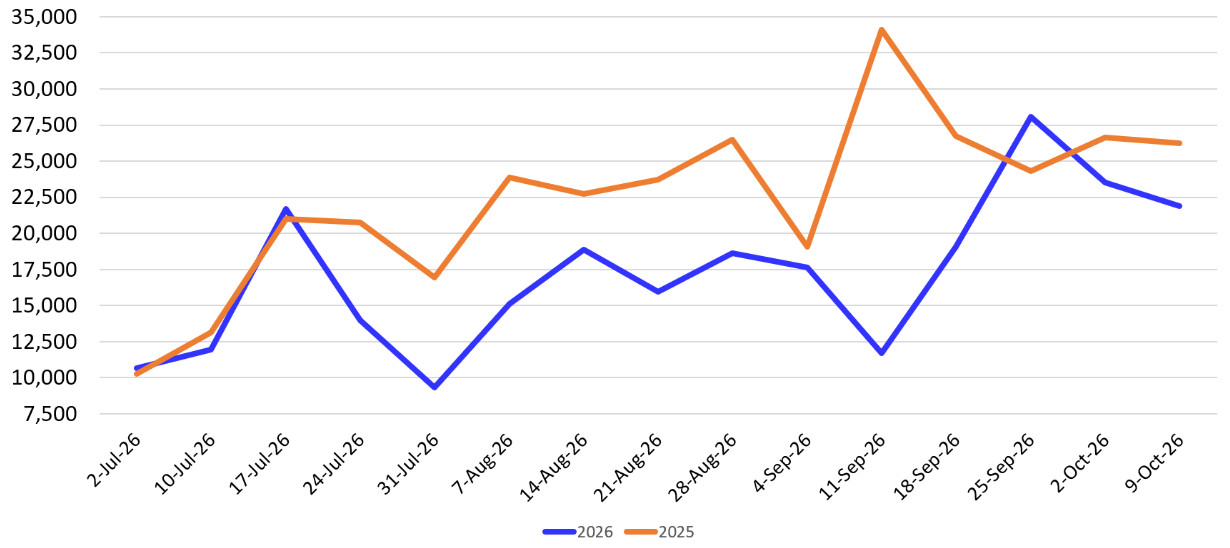 Figure 1: Feeder Cattle Auction Volume, Weekly, Oklahoma Combined, Head
Feeder cattle prices generally reached a low in early September and have mounted a slow and somewhat ragged recovery since then (Figure 2). Feeder prices are up roughly 5.5-6.0 percent since Labor Day. Lightweight calf prices, which typically decrease seasonally into October, are up this year. The price of 450-pound steers (M/L #1) in Oklahoma (preferred for wheat grazing) is up 6.3 percent in the last five weeks. Demand for wheat pasture calves sometimes causes stocker prices to increase counter-seasonally but stocker demand has been limited thus far. Wheat planting is well behind the normal pace because of dry conditions, but some recent moisture and expectations for more rain may spur both wheat planting and wheat stocker demand. Stocker and feeder prices may continue to recover in the fourth quarter with limited supplies and strong demand supporting prices.
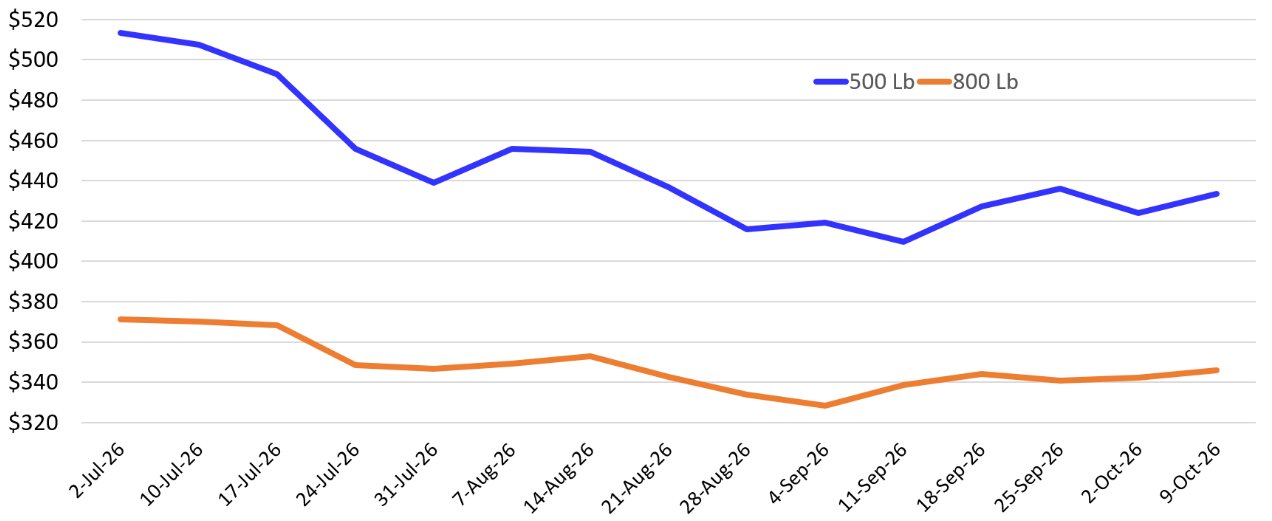 Figure 2: Feeder Cattle Prices, Weekly, Oklahoma Combined, $/cwt.
Derrell Peel, OSU Extension livestock marketing specialist, discusses fall marketing prospects on SunUpTV from October 10, 2026.
Body Condition of Cull Cows Affects Market Price
Paul Beck, Oklahoma State University Beef Cattle Nutrition Specialist
Cull beef cows make up about 10% of the U.S. beef supply and provide 15 to 20% of the gross revenue of typical cow-calf operations. Effective marketing of cull cows can have a large impact on the profitability of cow-calf operations. Cull Cow pricing is determined by live animal grading and cull cows are priced based on their body condition, dressing percentage, and expected lean meat yield. Cull Cows are sorted into 4 primary carcass grades: Breaking Utility are 75 to 80% lean and generally are BCS 7 or greater and have the greatest dressing yield 52 to 55%; Boning Utility are intermediate fleshed with BCS of 5.5 to 6.6 and commonly have dressing percentage of 50%; Lean are thinner cows with 85 to 90% lean with BCS of 4.5 to 5 and 48 to 49% dressing percentage; Lights/Canners are the leanest with BCS <4.5 and 48% dressing percentage. Breakers are the most valuable with a $3 to 5/cwt premium over Boning Utility cows and over $10/cwt premium over Lean and Light cows. The current slaughter cow prices are available from the USDA AMS.
Beef cutout research (Apple and others 1999) indicated that cows in BCS 4 were 64% in the Boning or Breaking Utility grade while cows in BCS 6 and 7 were 73 and 100% Boning or Breaking Utility. So, condition of cows at market has a large impact on returns for cull cows. The following Table shows the value of cull cows using current cull cow prices, expected weight changes between BCS, and the expected cull cow grades. I used cull cow BW at 1225 at a BCS 5 and adjusted live weight by 75 pounds for each BCS change. Prices for Boning and Breaking Utility were $133 and for Lean/Cutting were $124/cwt.
Increasing BCS 4 to BCS 8 at marketing increased cull cow value by over $450, while increasing BCS from extremely thin BCS of 2 to BCS 8 increases cow value by nearly $700. This increase in value comes from both added body weight and increasing market price through increased quality.
| Cow BCS | 2 | 3 | 4 | 5 | 6 | 7 | 8 |
|---|---|---|---|---|---|---|---|
| Cow BW | 1000 | 1075 | 1150 | 1225 | 1300 | 1375 | 1450 |
| % Utility | 0 | 33 | 63 | 44 | 73 | 100 | 100 |
| % Cutter | 100 | 67 | 36 | 56 | 27 | 0 | 0 |
| Price, $/cwt | 124.00 | 126.97 | 128.43 | 127.96 | 130.57 | 133 | 133 |
| Cow value, $/cow | 1,240 | 1,365 | 1,474 | 1,567 | 1,697 | 1,829 | 1,928 |
About 60% of cull beef cows are marketed in the Utility grade with 20 to 25% in the USDA Cutter and 5 to 15% in the Canner grade. Feeding thin cows to higher BCS before marketing can make a large difference in their value. When we consider that the prices of cull cows typically hit their lowest point in the fall, substantial gains can be made by feeding cows to heavier weights and marketing in a higher market. Next week’s article we will explore the ideal market endpoints of cull cows and feeding programs to get there.