

Cow-Calf Corner | July 6, 2026
Beef Demand Disaggregated
Derrell S. Peel, Oklahoma State University Extension Livestock Marketing Specialist
Beef demand is very complex. Although we frequently discuss beef demand as a single concept it is, in fact, the demand for many different beef products, each of which is a separate market. Figure 1 shows the average seasonal pattern of Choice boxed beef prices with a peak in June and lows at the beginning and end of the year. The seasonal price pattern in Figure 1 is the net seasonality from many different beef products, each with unique seasonal patterns. The seasonal indexes in Figures 1-5 and in Table 1 are five-year centered moving averages from 2021-2025. The seasonal pattern for each product shows the percentage variation around the average from the seasonal high to low price.
Table 1 shows the 2025 average price and seasonal price range for the ten most valuable wholesale beef cuts. The highest price beef cuts, Tenderloin and Ribeye, peak at the end of the year, with increased restaurant and holiday demand. This is shown in Figure 2, along with the Chuck flap, the number four beef cut, which has a similar seasonal price pattern.
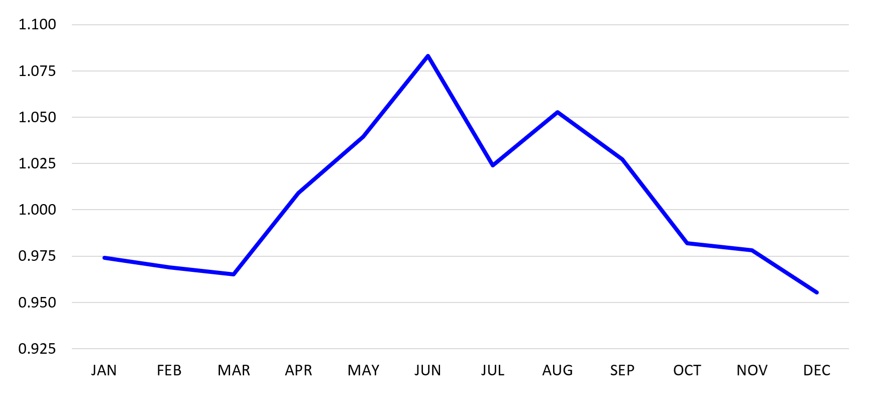 Figure 1. Choice Boxed Beef Seasonal Price Index. 2021-2025 Average
| Rank | Name | IMPS | Average Price ($/cwt.) | Max Index (Month) | Min Index (Month) |
|---|---|---|---|---|---|
1 | Tenderloin | 189A | 1572.08 | 1.124 (Nov) | 0.911 (Feb) |
2 | Ribeye | 112A | 1252.23 | 1.128 (Dec) | 0.884 (Jul) |
3 | Strip Loin | 180 | 963.71 | 1.247 (Jun) | 0.830 (Oct) |
4 | Chuck Flap | 116G | 813.33 | 1.119 (Nov) | 0.921 (Aug) |
5 | Chuck Petite Tender | 114F | 809.94 | 1.139 (Aug) | 0.831 (Jan) |
6 | Flank | 193 | 741.52 | 1.204 (Jun) | 0.848 (Dec) |
7 | Sirloin Tri-Tip | 185D | 720.35 | 1.262 (Jun) | 0.823 (Oct) |
8 | Brisket | 120A | 718.21 | 1.067 (Jun) | 0.915 (Mar) |
9 | Short Ribs | 123A | 625.07 | 1.051 (Aug) | 0.955 (Feb) |
10 | Sirloin Top Butt | 184 | 563.38 | 1.182 (Jun) | 0.868 (Nov) |
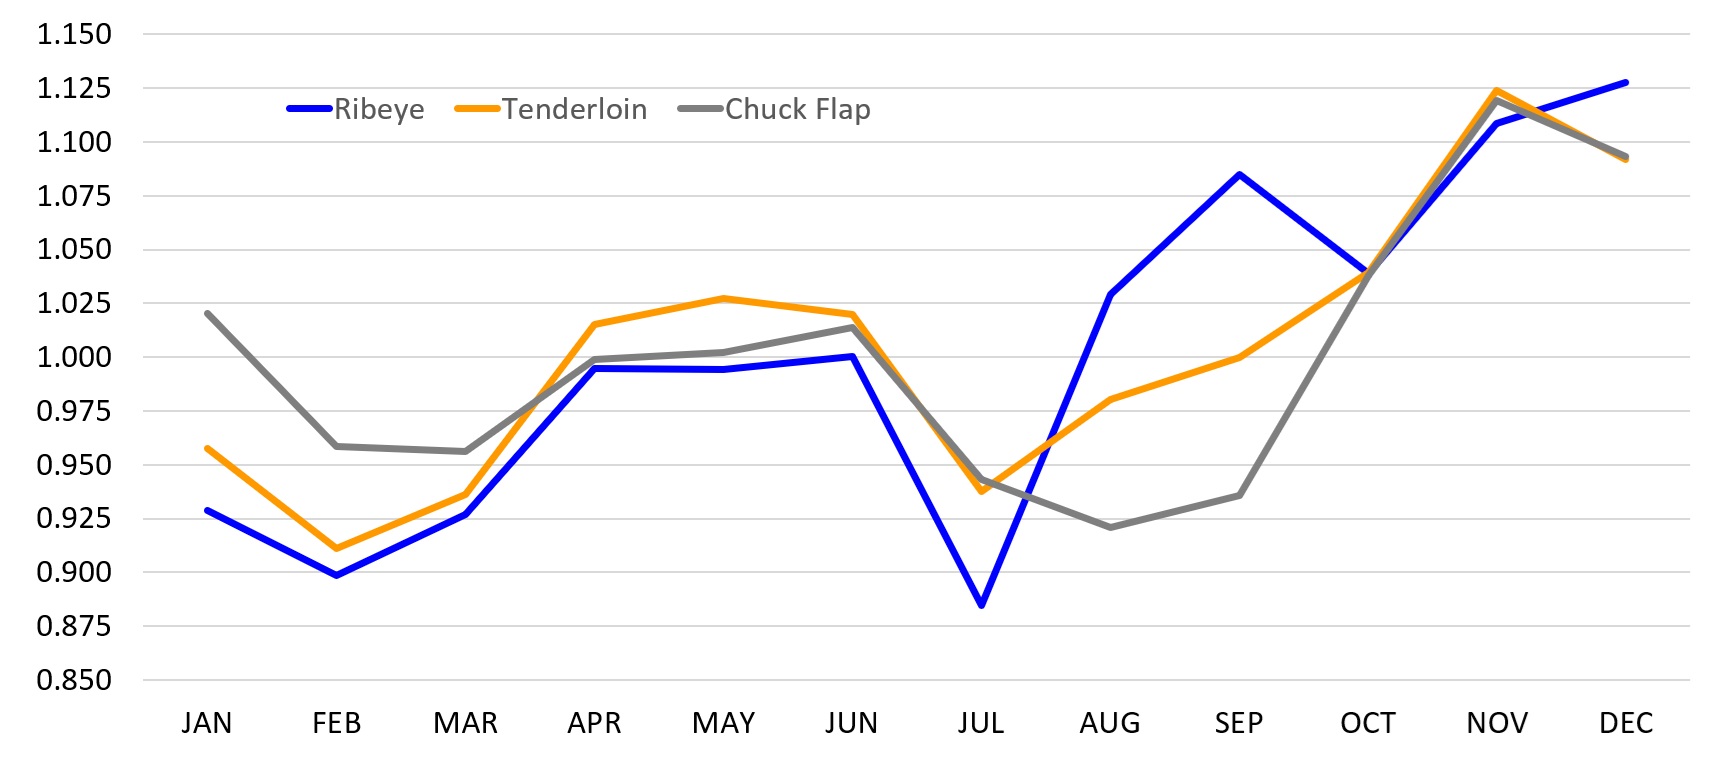 Figure 2. Seasonal Price Index. 2021-2025 Average
Figure 3 could be called the “Summer Grilling Demand” chart and shows four cuts that all peak in June. These four cuts, Strip loin, Flank, Top Sirloin and Tri-Tip have the most pronounced seasonal patterns and contribute the most to the overall seasonal pattern of boxed beef prices in Figure 1. For example, Tri-Tip price has an average range of 43.9 percent from the peak in June to the October low.
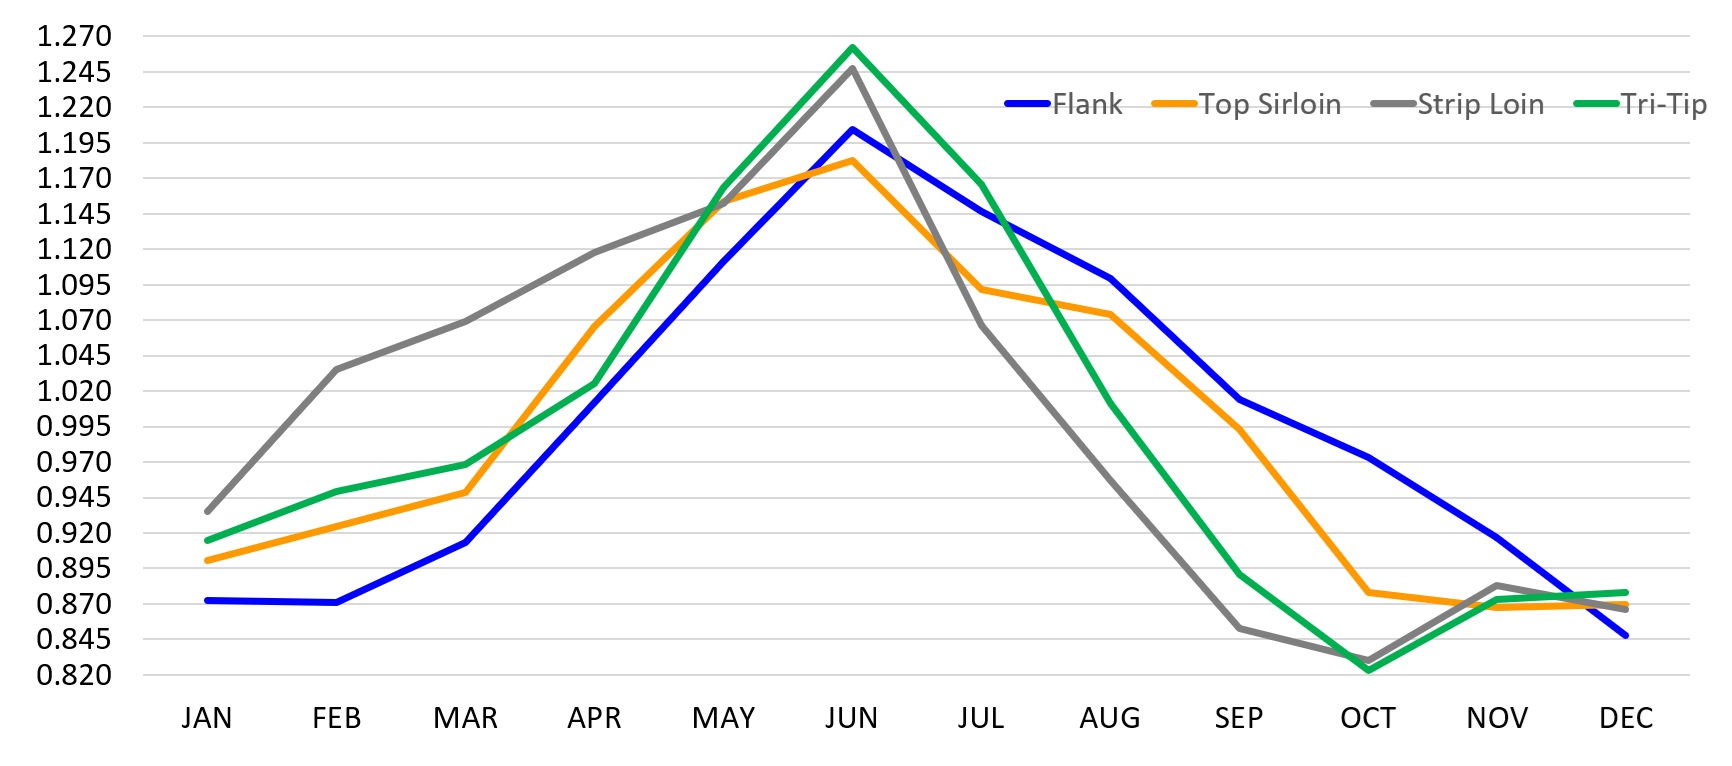 Figure 3. Seasonal price index 2021 to 2025 average
Figure 4 shows the seasonal patterns of three round cuts with very similar seasonal price patterns peaking in the third and early fourth quarter of the year. These relatively low value cuts; Outside Round, Eye of Round, and Bottom Round, are used sometimes for grinding and frequently for other processed beef products, such as jerky and sausage.
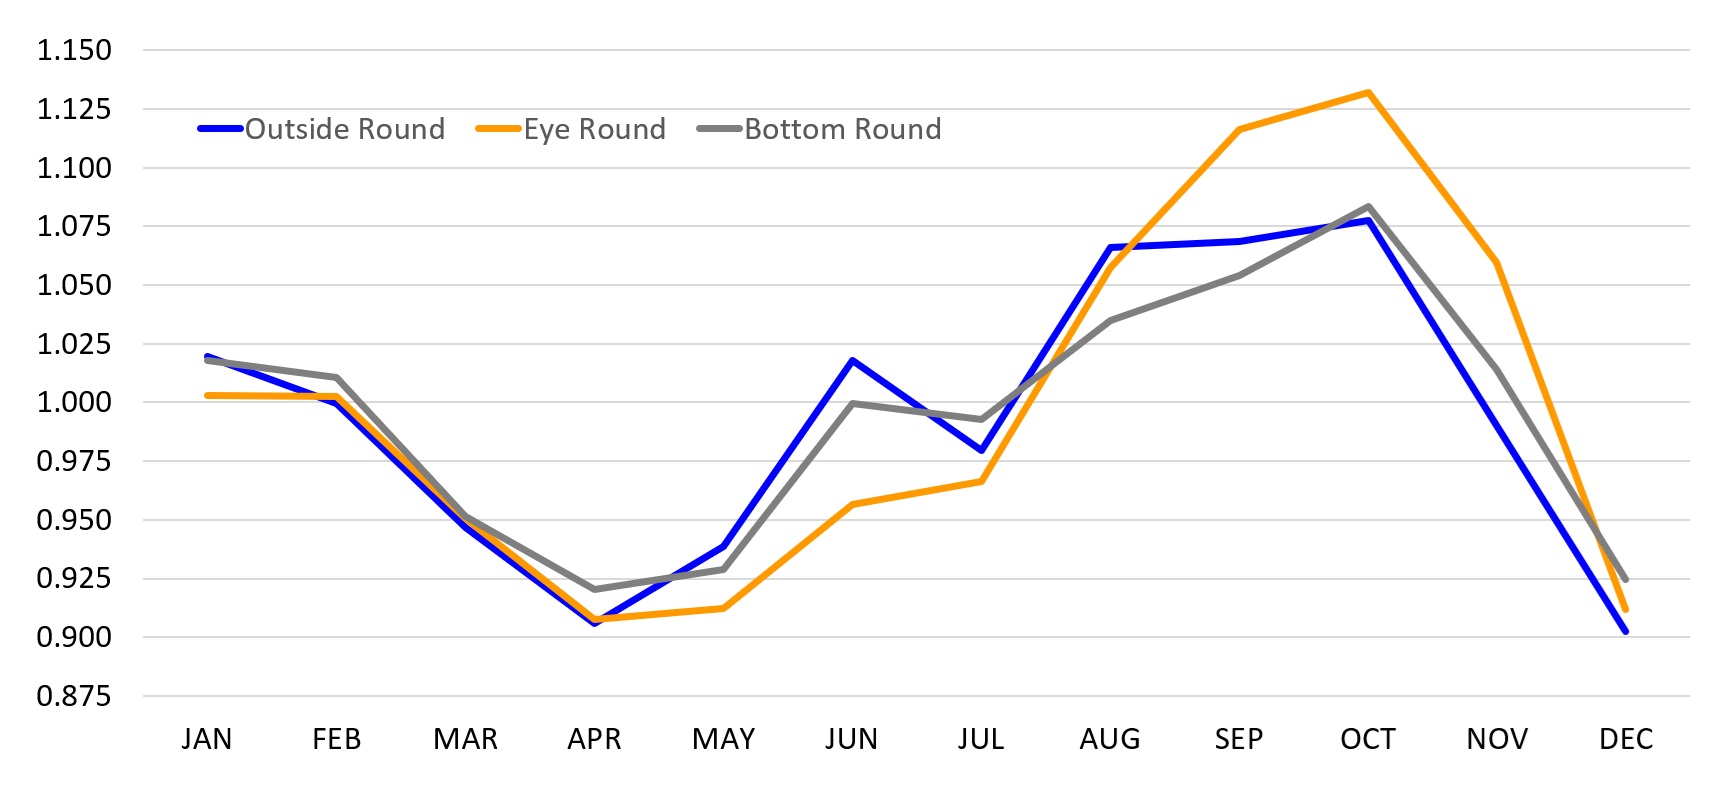 Figure 4. Seasonal price index. 021-2025 Average
Figure 5 shows three diverse cuts including brisket, which shows some summer demand tendency, peaking in June, along with Short Ribs, which are largely an export product, and Chuck Arm Roast, which tends to have higher prices in cooler weather at the beginning and end of the year. All of these cuts have relatively narrow seasonal price ranges with Chuck Arm Roast and Short Ribs each having less than ten percent variation from the seasonal peak to low price during the year.
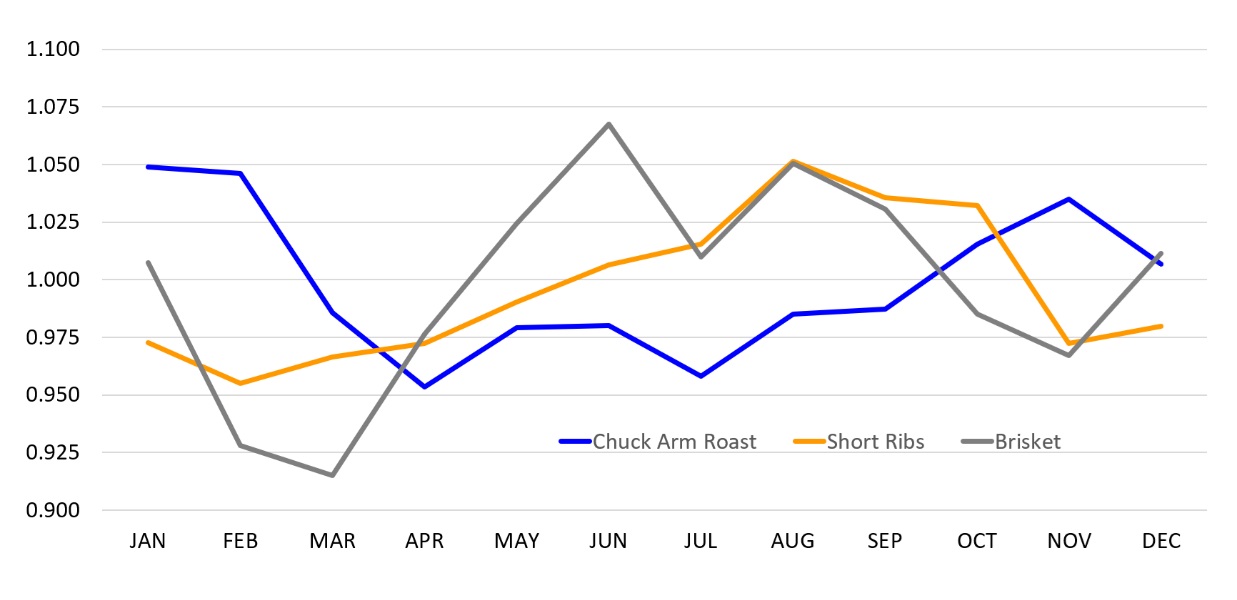 Figure 5. Seasonal Price Index. 2021-2025 Average
There are many other beef products as well, each of which has a distinct seasonal price pattern and each of which contribute to the overall value of each beef carcass and to beef demand.
Technologies to Improve Prediction of Beef Carcass Red Meat Yield
Mark Z. Johnson, Oklahoma State University Extension Beef Cattle Breeding Specialist
The United States Department of Agriculture (USDA) uses two distinct grades for beef carcasses. Quality Grades, based on marbling and maturity of the carcass indicate the eating satisfaction (tenderness, juiciness and flavor) of cooked beef. Yield Grades estimate the red meat yield (cutability) of a beef carcass. These grades enable differentiation of beef carcass quality and yield in the value transaction between producers and processors. Grading serves to establish the value of cattle and beef products in the market place.
Limitations of Current Yield Grading System
The USDA Yield Grade system was introduced in 1965. This system, based on a population of cattle that were small and early maturing, determined cutability could be predicted based on external fat thickness, ribeye area, carcass weight, and the percentage of Kidney, Heart and Pelvic fat. Despite genetic and management advancements, the system has remained unchanged for over 60 years. The system's inaccuracy is due to outdated models that do not account for modern cattle size, composition, and processing practices. Modern cattle are significantly larger, with carcass weights now similar to the live finished weights of cattle from the early 1960s. Advances in genetics and growth-promoting technologies have increased carcass size and altered composition. Accordingly, research shows that yield grades currently explain less than 35% of the variation in the true red meat yield of a modern beef carcass. Current premiums and discounts based on outdated yield grades no longer accurately reflect carcass value from the red meat yield aspect. There is a need for more precise, objective measurement tools that can operate at commercial speeds.
A New System Based on Advanced Technologies
Modern technologies and data analysis capabilities provide an opportunity to capture absolute measurements of carcass composition and modernize the yield grade system. Recent studies indicate technologies like 3D imaging, computed tomography (CT), and radar can accurately predict beef carcass cutability explaining over 70-90% of variation in red meat. Processed CT data has been utilized to measure carcass cutability with near perfect accuracy but processing speed and carcass size remain as limitations with this technology.
The timeline for when a new yield grading system is in place remains to be determined but validation of the technologies is happening at a rapid pace. Development of these tools is an industry priority as their implementation will modernize yield assessment, improve market signals, and enhance industry efficiency. The tools developed will be applicable to live cattle production and serve to inform management and genetic decisions made at the seedstock and cow-calf level.
Reference:
2026 Presentation Archive. Advancing Red Meat Yield: Innovation in Carcass Evaluation – Dr. Dale Woerner, Texas Tech University.
Implanting Nursing Calves Pays at Weaning
Paul Beck, Oklahoma State University Extension Beef Nutrition Specialist
Implanting nursing calves is one of the most cost-effective practices available to cow-calf producers. Preweaning implants are typically given when calves are 2 to 4 months of age, often when cows are being prepared for breeding and moved to summer grazing. Research shows that implants given during the suckling phase increase average daily gain by 0.15 pounds per day and weaning weights by 25 pounds.
Implanting heifers at birth can reduce future pregnancy rates by 30 to 50%, so that practice should be avoided in potential replacement females. However, research indicates that implanting heifers between 1 and 3 months of age does not negatively affect pregnancy rates later in life when approved products are used correctly.
Despite the economic benefit, adoption remains low. The Oklahoma cow-calf survey indicated that only about 20% of producers implant calves before weaning. Research from Kansas State University and Merck Animal Health evaluated more than 15,000 lots of calves sold through Superior Livestock Auction, representing over 2.5 million head. In that analysis, implanted calves were not discounted. With today’s calf prices, a 25-pound increase in weaning weight is worth $125 to $150 per head. Not implanting is the equivalent of taking a $25 per hundredweight discount on your calves.
Another common practice is leaving bull calves intact until weaning in hopes that natural hormones will increase gain. However, bull calves produce very little testosterone prior to puberty, which occurs much later than normal weaning age. Numerous research trials have shown that implanted steer calves gain faster and wean heavier than intact bull calves.
Delaying castration until weaning also adds stress at the same time calves are adapting to separation, marketing, transport, and new diets. This stress can reduce post-weaning performance and increase health risk. Buyers recognize these risks, which is why steer calves often sell for $12 to $15 per hundredweight more than intact bull calves.
Producers wanting to maximize calf value should consider early castration along with an implant approved for nursing calves. Used at the right time, implants can return $100 to $150 for every dollar invested and help offset today’s higher production costs.