

Cow-Calf Corner | August 24, 2026
What to Expect from Mexican Cattle Imports
Derrell S. Peel, Oklahoma State University Extension Livestock Marketing Specialist
There is lots of speculation on both sides of the border about what to expect with the resumption of cattle trade between the U.S. and Mexico. How many cattle? What type of cattle? How fast?
There are many questions about if and how much the world has changed since the border closed and whether the impacts are long-lasting or perhaps permanent. We can’t be sure, but history is probably still the best guide on what to expect.
Mexican cattle imports averaged 1.17 million head in the twenty years from 2004-2023 with a minimum of 702.6 thousand head in 2008 to a maximum of 1.47 million head in 2012. Mexican cattle imports are highly correlated to drought conditions in Mexico, with severe drought causing unsustainable spikes in cattle imports which tend to average out. A five-year moving average of Mexican cattle imports only shows about 222 thousand head variation across years.
On average, 36 percent of annual Mexican cattle imports cross from September through December. If the border was fully open, the average of 1.17 million head annually implies that roughly 421,000 head could cross by the end of the year. Based on history, it might be possible for 90-100 thousand head of cattle to cross at the Douglas port in the last four months of the year. If we suppose that Santa Teresa and Columbus, New Mexico open one month later, an additional 125-175 thousand head could be imported by the end of the year. It is unlikely that many, if any, spayed heifers will be imported initially, so the above estimates are likely too high. It will likely take several weeks for ports to return to full capacity. For the remainder of 2026, up to 250 thousand head total might be possible but 150 thousand head is probably a more reasonable estimate of Mexican cattle imports by the end of the year.
The majority of Mexican cattle imports are feeder cattle and generally lightweight. Table 1 shows the breakdown of Mexican cattle imports in 2023. Feeder cattle weighing less than 700 pounds accounted for 98.7 percent of Mexican cattle imports, including 29 percent under 440 pounds. Many of the lightweight feeders will be utilized in stocker programs before feedlot placement. Tight feeder cattle supplies in the U.S. may mean that more and lighter Mexican cattle may be placed immediately in feedlots. These cattle will be on feed for six to eight months with the first animals potentially available for slaughter by March 2027.
| Class | Weight Group | Steers | Heifers | Total | % of Grand Total |
|---|---|---|---|---|---|
| Feeder Cattle | |||||
| <200 lbs. | 0 | 57 | 57 | 0 | |
| 200-440 lbs. | 325,418 | 35,879 | 361,354 | 29.0 | |
| 440-700 lbs. | 584,713 | 283,735 | 868,448 | 69.7 | |
| >700 lbs. | 8,312 | 1,624 | 9,936 | 0.8 | |
| Total | 918,443 | 321,295 | 1,239,738 | 99.5 | |
| Fed | 3,132 | 2,899 | 6,031 | .48 | |
| Stir Bulls/Cows | 562 | 223 | 785 | .06 | |
| Grand Total | 1,246,554 |
Dr. Peel discusses the continued decline in the U.S. cattle herd, signs that the herd may be trying to stabilize, and the cattle market’s reaction to news of a phased reopening of the Mexican border for livestock imports on SunUpTV from August 17, 2026.
What Should Bred Heifers Be Worth?
Mark Z. Johnson, Oklahoma State University Extension Beef Cattle Breeding Specialist
This has been a popular question over the past couple of years and rightfully so. Relative to calf prices during this stretch of time, good quality bred heifers have been undervalued. Over the past year in Oklahoma commercial bred heifers have sold in a trading range between $3,500 - $5,000 per head. Favorable factors leading to values at the upper end of the spectrum include:
- Heavier bred (closer to calving)
- Tighter expected calving season
- Genetics and Quality. Favoring Angus influenced Black and Black-baldy heifers of known genetic potential confirmed bred to Angus bulls with quantified calving ease genetics. Particularly when AI bred.
- Verified vaccination and health status.
Assuming weaned calves remain at a value of approximately $2,000 per head over the next few years, your annual cost of running a cow will largely determine what you should invest in a bred heifer. The annual cost of maintaining a beef cow is highly variable and has increased tremendously over the past 5 years.
Total costs associated with U.S. cow-calf production for 2018 were estimated to range from $910 per cow for operations with 500 or more cows to $2,099 per cow for operations with 20–49 cows. These results show significant economies of scale, with costs per cow declining with increased herd size. Kansas Farm Management Association estimates the annual cost of running a cow to be approximately $1,551 according to data collected in 2024. The take home point: knowing your annual cost of running a cow has significant impact on the current value of a bred heifer to your operation.
A pair of professors at the University of Arkansas (referenced below) have developed a Beef Cow and Heifer Investment Analysis tool which can be used to estimate the current value of a bred heifer. The is a free-to-use online dashboard which allows producers to enter their own data. The program is available at Heifer Investment Analysis. For example, the program’s default assumptions of a 92% calf crop weaned, 520 pounds weaning weight, $1,100 in annual cow cost, an 8% return on investment, cows staying in production until age 10, with calf prices and inflation following USDA calf price forecast, indicate a bred heifer breakeven price of $5,018. Changing an assumption can significantly impact the estimate, highlighting how much how much this breakeven price is operation specific.
Despite the recent volatility, market fundamentals are favorable for a continued strong cattle values until cow inventories start to climb. When that will happen remains speculative. That being said, what bred heifers are worth to your operation will depend on how much profit she nets each year rather than on the gross value of each calf she produces.
References
How Much Should You Pay for a Replacement Heifer? James Mitchell and Ryan Loy, University of Arkansas
Current Value of Replacement Heifers. Mark Z. Johnson, Oklahoma State University Extension Beef Cattle Specialist. August 18, 2025 Edition of the Cow-Calf Corner Newsletter.
Oklahoma’s Usage of Livestock Risk Protection in 2026, Part 2
Scott Clawson, Oklahoma State University NE Area Extension Agricultural Economist
Livestock Risk Protection (LRP) has found its place as a price risk management tool for the Oklahoma cattle business.
For the data discussed, 2026 refers to policies initiated from 7/1/2025 to 6/30/26. The previous year’s data works on the same calendar for their respective years.
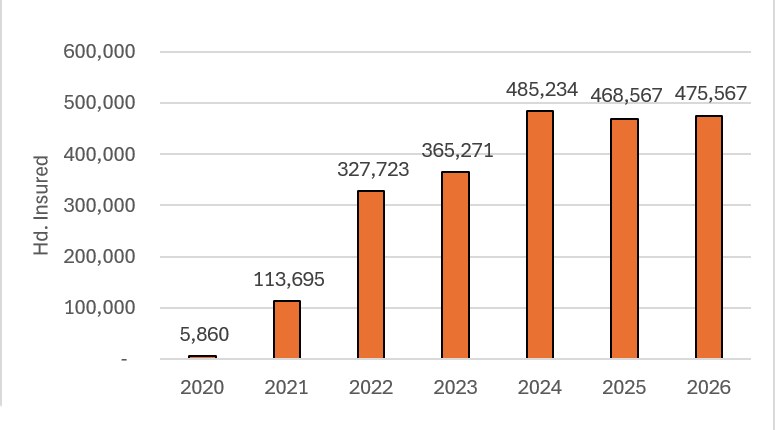
Figure 1. LRP OK: Annual Usage - Source: USDA-RMA Summary of Business sorted and analyzed by author.
There were 475,567 head of cattle in Oklahoma were price protected with LRP policies initiated in 2026. LRP usage in Oklahoma has leveled off at just under half a million head annually over the past three years. While LRP has existed since the early 2000s, the adoption was minimal. However, usage has grown rapidly since 2020 when only 5,860 head were covered. This is likely a reflection of two issues. In 2020 a series of changes were made to increase the usability and affordability of LRP. This, combined with the stronger cattle prices in recent years, has created an environment for LRP to gain footing with producers.
The most popular application of LRP has been in Weight 2 Steers and Heifers (600-1,000 lbs.). This category made up almost 85% of cattle covered in OK. The Unborn Steers & Heifers and Weight 1 (up to 600lbs.) categories follow distantly with 6.13% and 5.47% respectively. This highlights two growth areas where LRP could benefit producers more. The Unborn Steer & Heifer option is viable to reduce the price risk when buying or developing bred females in our higher price level environment. The Weight 1 option fits well in the cow-calf sector where producers are selling at weaning.
Two last notes regarding coverage level and length of coverage.
| Coverage Level | Hd | % |
|---|---|---|
| >= 97% | 399,468 | 84.00% |
| 90-96% | 58,707 | 12.34% |
| <90% | 17,392 | 3.66% |
| Total | 475,567 | 100.00% |
Source: USDA-RMA Summary of Business, sorted and analyzed by author.
Oklahoma producers that are implementing LRP generally select high levels of coverage. In 2026, 84% of insured cattle were covered at a level at or above 97% of the Expected End Value. Only 3.66% of cattle were insured at a level under 90%. Additionally, shorter term policies are more common than longer term selections.
| Weeks | Hd | % |
|---|---|---|
| 13 | 76,054 | 15.99% |
| 17 | 81,688 | 17.18% |
| 21 | 76,019 | 15.98% |
| 26 | 74,831 | 15.74% |
| 30 | 52,683 | 11.08% |
| 34 | 44,981 | 9.46% |
| 39 | 23,404 | 4.92% |
| 43 | 12,379 | 2.60% |
| 47 | 10,455 | 2.20% |
| 52 | 23,073 | 4.85% |
| Total | 475,567 | 100.00% |
Source: USDA-RMA Summary of Business, sorted and analyzed by author.
One of LRP’s biggest strengths is that it is adaptable to almost every beef cattle business in Oklahoma. Implementing LRP can eliminate a portion of the downside price risk that is lurking in the background and let us get the most out of our current markets.
Data is from the USDA-RMA Summary of Business which can be found at the USDA-RMA.
Fall Dormancy and Winter Survival in Alfalfa
Mike Trammell, Oklahoma State University Southeast Area Agronomy Specialist
There are several traits to consider when selecting an alfalfa variety (cultivar). Choosing a variety adapted to the region’s climate and suitable for the intended use should be priorities. Winter survival and fall dormancy are key factors related to adaptability and use. They can affect stand, longevity, and forage yield. As a way to compare winter survival and fall dormancy among varieties, ratings have been given to alfalfa varieties that are eligible for seed certification. The ratings are published each year by the National Alfalfa and Forage Alliance. Winter survival and fall dormancy ratings along with pest resistance ratings can be found on the education link at National Alfalfa and Forage Alliance.
Although fall dormancy is somewhat related to winter hardiness, it is not an accurate measure of winter hardiness. Winter hardiness and fall dormancy should be considered as separate characteristics when selecting alfalfa varieties.
Winter Survival Rating
Particularly important in the Northern Great Plains is the ability of an alfalfa plant to survive the winter without injury. Winter survival ratings for alfalfa varieties range from 1-6, with 1 being the most winter hardy and 6 being the least hardy (Table 1). The rating indicates stand longevity and potential to withstand multiple winters. For long term persistence, alfalfa varieties with lower winter survival ratings should have primary consideration in northern climates.
| Rating | Description | *Region of Adaptation |
|---|---|---|
| 1 | extremely winter hardy | Northern Plains |
| 2 | very winter hardy | Northern Plains/Upper Midwest |
| 3 | winter hardy | Northwest/Upper Midwest & Central Plains |
| 4 | moderately winter hardy | Northwest/Upper Midwest & Central Plains |
| 5 | slightly winter hardy | Southern U.S.A. |
| 6 | non-winter hardy | Extreme Southwest U.S.A. |
*For more information on specific region of adaption consult the National Alfalfa and Forage Alliance Alfalfa Variety Ratings Guide.
Fall Dormancy Rating
Fall dormancy is the degree of fall alfalfa growth as a response to temperature and day length. Lower dormancy ratings exhibit less fall growth. Fall dormancy ratings are indices assigned by comparing the height of fall growth with standard check varieties and tested across locations and years to accurately represent dormancy response across environments. Fall dormancy is rated on a scale of 1-11, with 1 having the least fall growth and 11 with the greatest fall growth (Table 2). Varieties with low fall dormancy ratings have slower shoot elongation and regrowth after harvest and have shorter prostrate shoots in the fall. Varieties with high dormancy ratings have erect shoot growth in the fall and quicker shoot elongation after harvest (Figure 1). They tend to start growing earlier in the spring, green up faster following cutting during the season, and grow taller in the fall. Fall dormancy ratings are a particularly good indicator of yield potential. The advantage of growing varieties with a larger number on the fall dormancy rating scale is generally higher yields.
| Rating | Description |
|---|---|
| 1 - 2 | very dormant |
| 3 - 4 | dormant |
| 5 | moderately dormant |
| 6 - 7 | semi-dormant |
| 8 - 9 | non-dormant |
| 10 - 11 | very non-dormant |
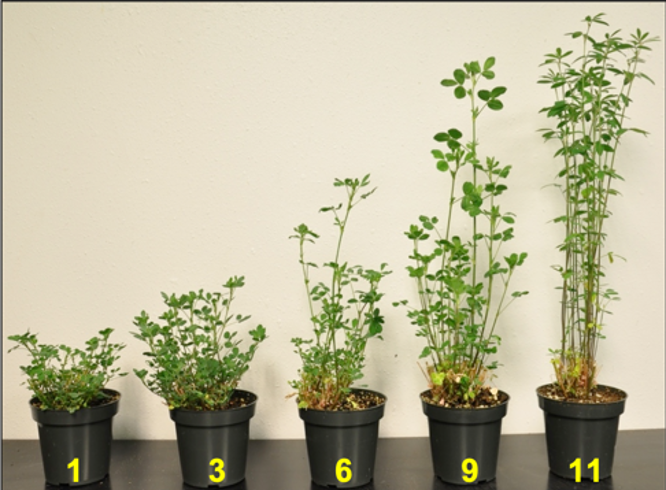
Figure 1. Fall dormancy types in alfalfa. A higher fall dormancy score translates to more autumnal growth (Photo courtesy of UC Davis).
Winter survival and fall dormancy ratings are great tool for selecting an alfalfa variety. Other things to consider include purpose of planting, management, and pest resistance.
Reference
National Alfalfa and Forage Alliance. Alfalfa Ratings Guide.