

Cow-Calf Corner | April 13, 2026
Global Beef Production and Exports
Derrell S. Peel, Oklahoma State University Extension Livestock Marketing Specialist
-USDA report on “Livestock and Poultry: World Markets and Trade” shows global beef production at 61.563 million metric tons (mmt), down 1.1 percent from 2025.
Beef production is projected to decrease in the top four beef producing countries: Brazil, U.S., China and the E.U., as well as in Argentina (Figure 1). Beef production is projected to increase in India, Mexico, and Canada.
2026 Forecast, Carcass Weight
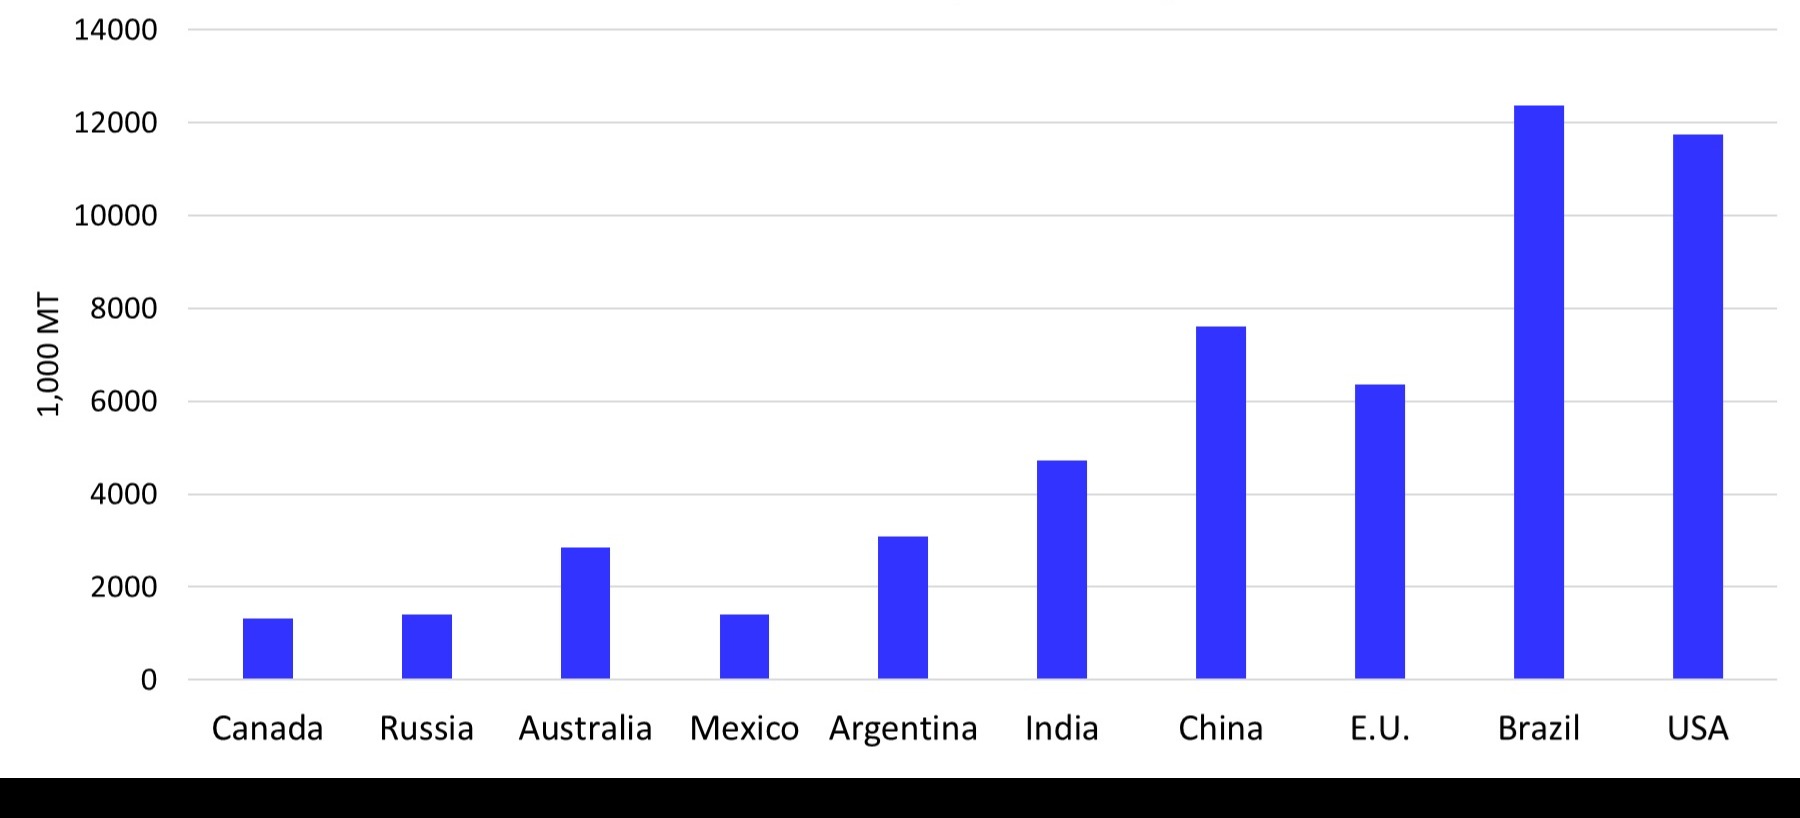 Figure 1. Global Beef Production
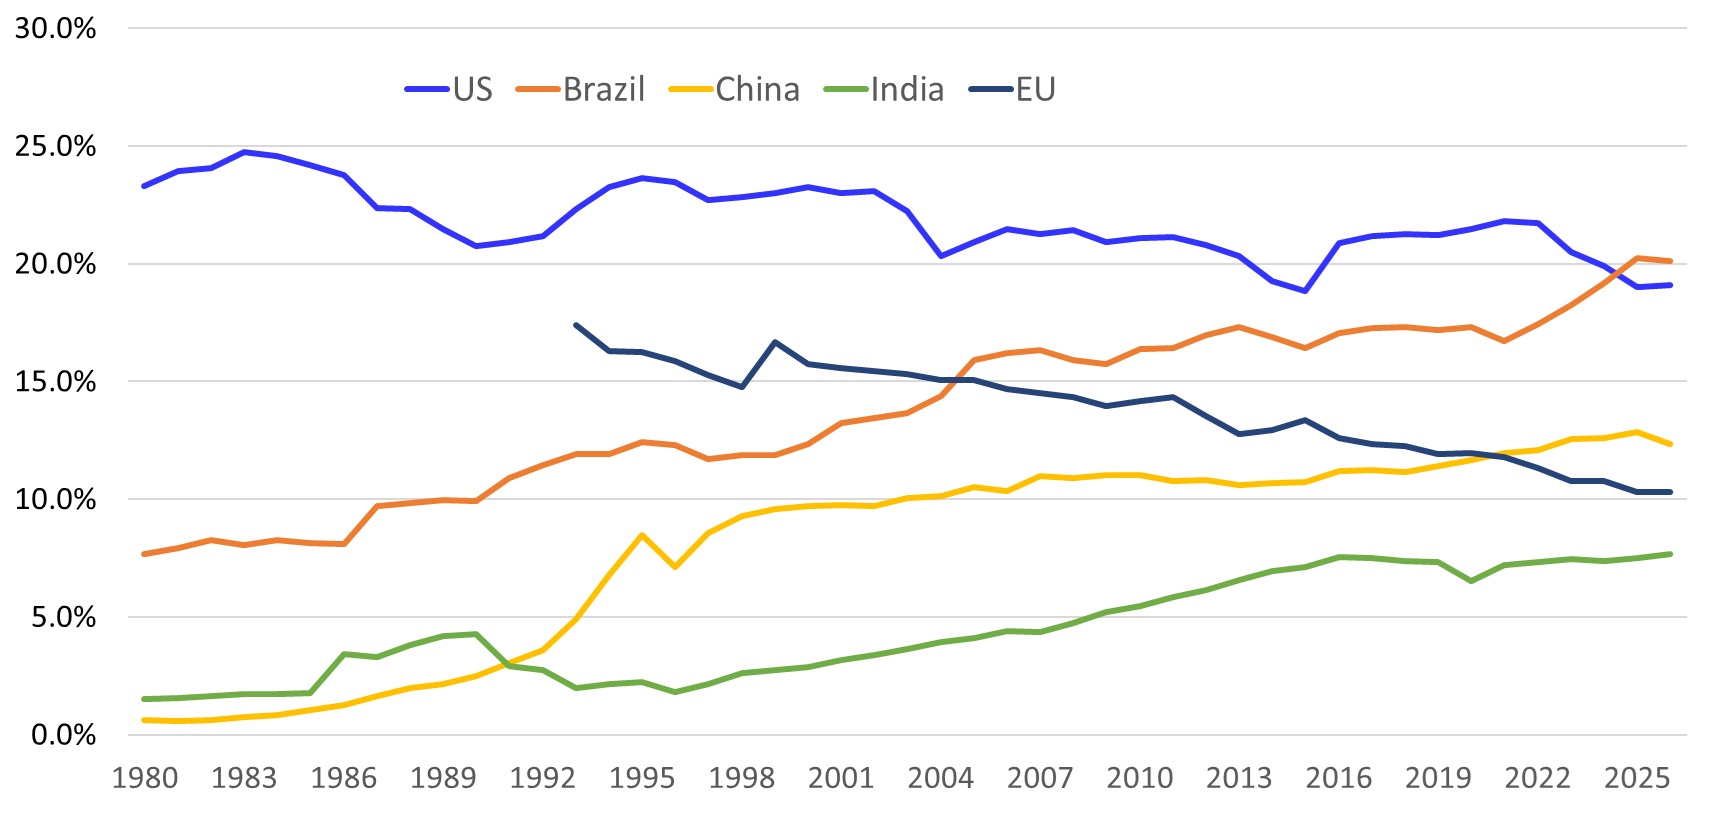
Figure 2. Percent of Global Beef Production
Brazil surpassed the U.S. as the largest beef producing country in 2025 and is projected higher in 2026. Figure 2 shows the shares of global beef production for each of the top five beef producers since 1980. Brazil has shown the most dramatic growth in beef production over many years, along with China and India. The European Union has decreased, as has the U.S. as a share of global beef production. Since 1980, global beef production has increased 43.4 percent, and average increase of 0.8 percent per year.
2026 Forecast, Carcass Weight
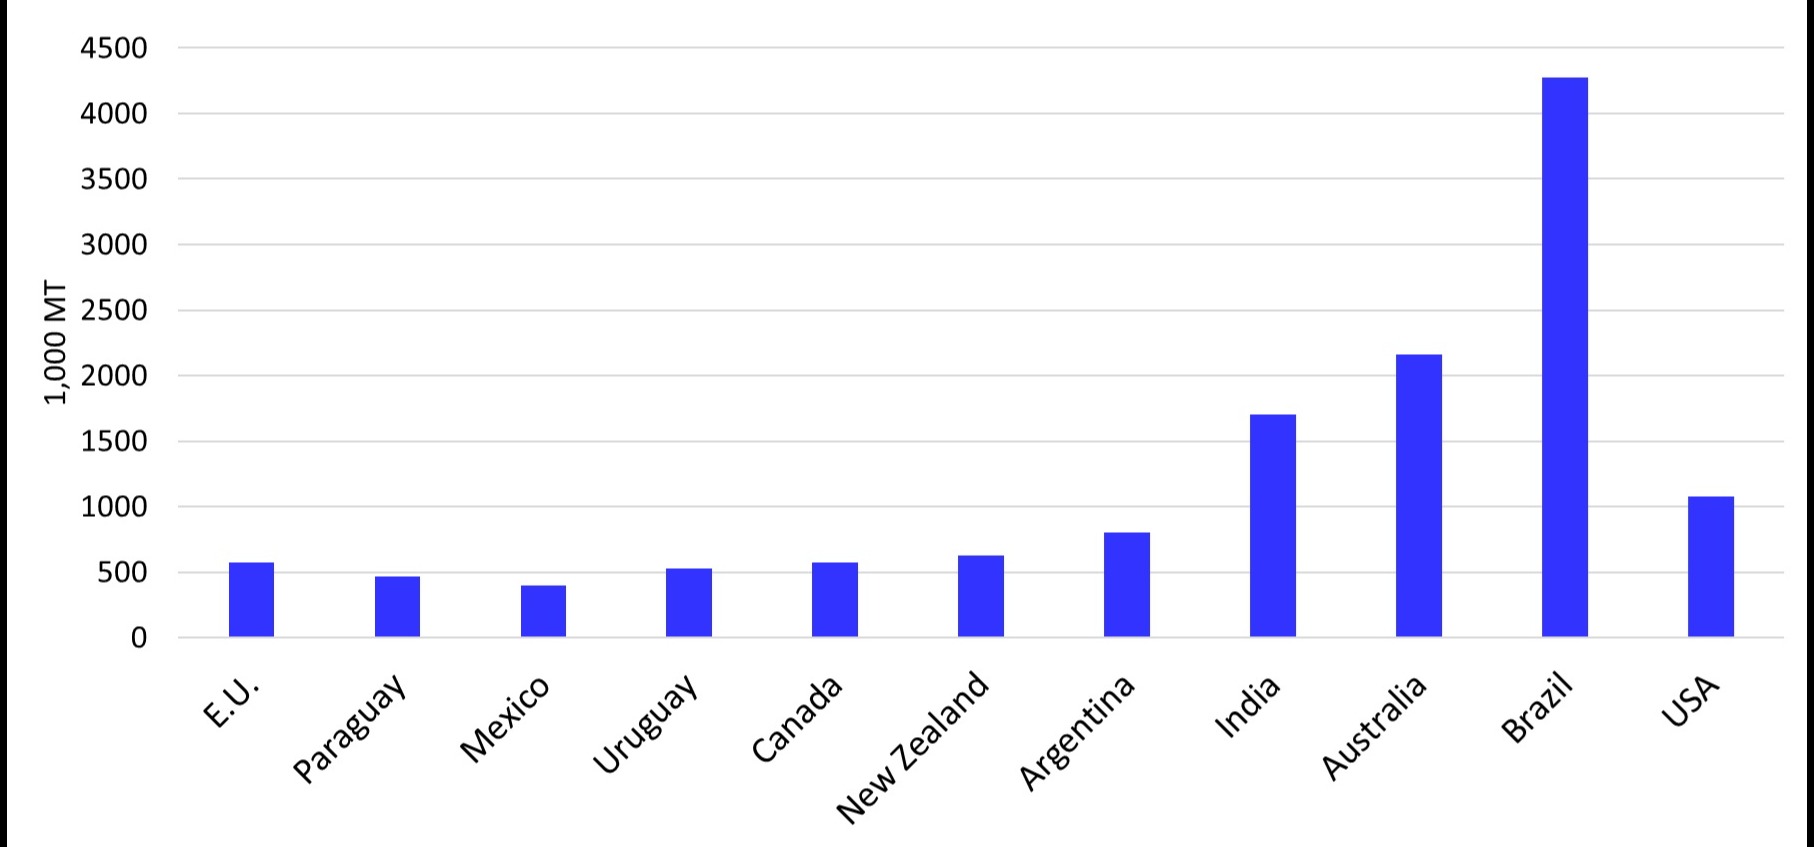 Figure 3. Beef Exports
Figure 3 shows projected 2026 beef exports for the major beef exporting countries. Total beef exports are expected to decrease 0.8 percent from the record 2025 global beef exports. Global beef exports have increased by 205 percent since 1980, an average of 2.7 percent annually.
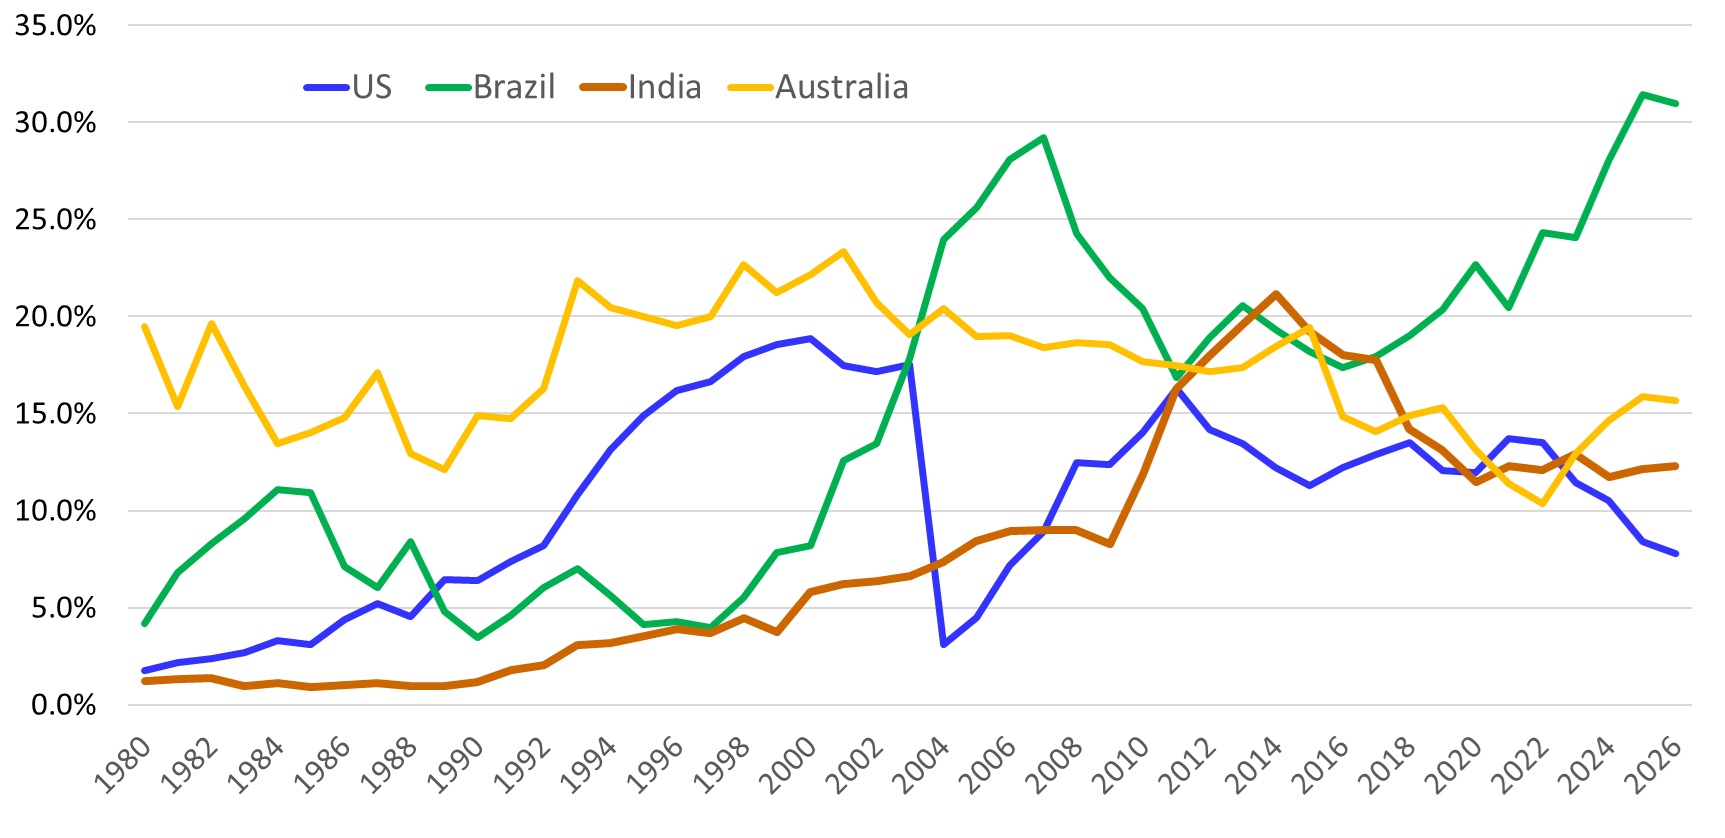
Figure 4. Percent of Global Beef Exports
Shares of global beef exports have been quite volatile over time (Figure 4). Prior to 2004, Australia was consistently the largest beef exporter. Brazil grew rapidly after 1998 and overtook Australia from 2004-2010. Between 2011 and 2017, Australia, Brazil and India were all jockeying to be the dominant beef exporter, with India the largest in 2014 and 2016 and Australia the largest fractionally in 2015. Since 2018, Brazil has dominated global beef exports with a growing share exceeding 30 percent in 2025. The U.S. has varied from the second to the fourth largest beef exporter since 1980.
Derrell Peel explains why all cattle slaughter is down and what it means for producers and the beef industry on SunUpTV from April 11, 2026.
YouTube: Cattle Slaughter Is Dropping—Here’s What It Means Marketing
Impact of Selection Pressure Applied to Marbling
Mark Z. Johnson, Oklahoma State University Extension Beef Cattle Breeding Specialist
As covered last week, in recent years there has been a significant increase in the percentage of fed cattle in the US reaching the USDA Quality Grade of Prime. This level of quality is driven primarily by the degree of marbling in the ribeye at the 12th-13th rib interface of a beef carcass. Historically speaking, the beef industry routinely saw 1 – 2% of the youngest maturity groups of fed cattle reaching the Prime Quality Grade. March, 2026 ended with 15% of the monthly harvest mix grading USDA Prime and only 8% grading Select. Of the 73 – 74% grading Choice, more are shifting into the upper two-thirds of Choice, the standard that needs to be reached for quality based, premium, branded beef products like Certified Angus Beef.
The Quality Grade of Prime indicates the highest level of tenderness, juiciness and flavor of cooked beef. Thereby, Prime indicates the greatest likelihood of a satisfying eating experience. It is apparent consumers have responded favorably to improving beef quality. The beef industry is experiencing greater demand for Prime and the upper two-thirds of Choice. Greater supply of the higher quality product has permitted more consumers to try it. Consumers like it and are willing to spend more to enjoy it. The phenomenon has increased demand and value across the entire beef industry.
Marbling is a high heritability trait and selection pressure applied to Marbling EPDs has resulted in an increased genetic potential of the US cattle population to reach this level of quality. There is no doubt that the modern norm of finishing cattle longer and to heavier weights has helped to tap this genetic potential. That being said, the additive genetic potential had to be bred in before it could be tapped.
The chart below shows the significant increase in average Marbling EPD by birth year in the Angus breed over the past half century.
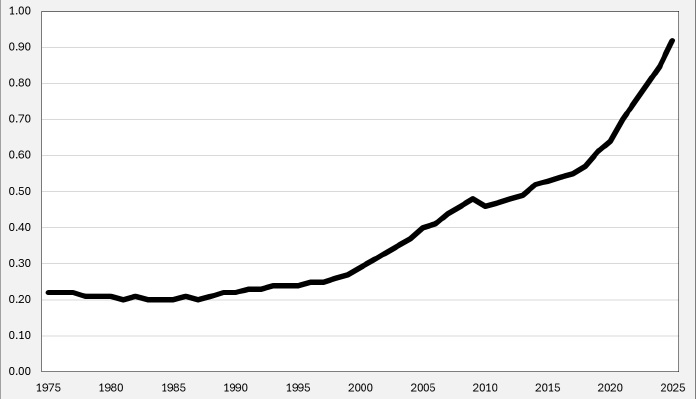 Figure 1. Average Angus Marbling EPD by Birth Year
This serves as an example of what can be accomplished when we use the modern tools available to make genetic change. Selection tools such as EPDs, genomic testing, selection indexes and genetic merit scorecards make identifying high marbling genetics more dependable and more valuable than ever before. Selection for increased marbling has been driven by economics. Because marbling increases the value of carcasses and genetic potential for increased marbling increases the value of feeder cattle and breeding stock without raising production cost, cattle breeders and producers are incentivized for select for it.
Reference
- Youtube: Genetic Trend EPD/$Value by Birth Year
- Mark Johnson explains how the percentages of Prime, Choice, and Select beef have evolved and why these changes matter for today’s producers on SunUpTV from April 11, 2026. YouTube: Increased Beef Carcass Quality
Tug-of-War in the Cattle Industry: Balancing Cow Size, Carcass Weights, and Total System Efficiency
Paul Beck, Oklahoma State University Extension Beef Cattle Nutrition Specialist
The beef industry is currently experiencing a tug-of-war between biological efficiency and market signals that reward heavier carcass weights. Recent Rancher’s Thursday webinar sessions ( YouTube: Tug of War in the Cattle Industry) highlighted the growing tension in the beef industry between the market driven feeding for heavier carcass weights, selection for increased growth and efficiency, and the economic realities of maintaining larger cows.
Carcass weights are increasing largely because feed yards are keeping cattle on feed longer and marketing systems reward pounds of carcass weight. At the same time, cow size has increased in turn raising maintenance requirements and forage demand.
Speakers also discussed the biological factors behind heavier carcasses. Growth in finishing cattle remains relatively linear even at heavier weights, and modern marketing systems favor carcass-based pricing. There are market incentives that encourage feeding cattle to heavier endpoints, including low cattle numbers, relatively inexpensive feed, and reduced discounts for heavy weight and yield grade 4 carcasses. These conditions can improve gross revenue at the feed lot but also increase days on feed and reduce feed efficiency.
Bigger cows are not necessarily more efficient cows. Cow size is closely related to feed intake, so selecting for larger mature size without considering forage resources can reduce stocking flexibility and increase production risk, particularly during drought or periods of high feed costs. Matching cow type to the ranch environment remains one of the most important management decisions producers make.
Ultimately, long-term profitability of beef production depends on balancing genetics, nutrition, and available resources across the entire production system. Producers who align cow size, stocking rate, and marketing strategy with their forage base are better positioned to remain resilient in volatile markets and challenging weather conditions.
Efficiency should drive replacement and management decisions. The most profitable cowherds are those that fit their environment and optimize performance from pasture to packer.